Smarter HDL linting, instant feedback, and fewer review cyclesHardware teams lose countless hours to manual reviews, inconsistent coding styles, and debugging that surfaces far too late in the flow. Linty HDL Designer brings modern automation to Verilog, SystemVerilog, and VHDL development — catching issues early, standardizing your codebase, and reducing review friction across your team. Whether you're an FPGA/ASIC engineer, a team lead, or a verification owner, Linty helps you ship cleaner HDL with less effort. SummaryLinty HDL Designer will help you boost reliability, enhance security and ensure maintainability of your HDL code. Checking Code Quality in Real-time Linty HDL Designer checks over 350 rules in real-time on your HDL (VHDL, Verilog/SystemVerilog and Tcl) code. Actionable Reports Linty HDL Designer provides actionable reports and dynamic graphs to get a comprehensive understanding of the design and pinpoint issues. Among others, they cover design hierarchy, clock domain crossings (CDC), reset domain crossings ( RDC), finite state machines (FSM) or combinational loops. Continuous Integration Linty HDL Designer is the first component of the Linty code quality tool chain. Check the Connected Mode section and Linty Services website to implement a powerful continuous integration pipeline for your HDL code, to ensure that every piece of code you write is bug-free, secure and highly maintainable.
Installation and ConfigurationPrerequisitesLinty HDL Designer is built upon SonarLint. If SonarLint is already installed, it must be removed before installing Linty HDL Designer. Free VersionThe free version requires no configuration, and the following rules will be checked automatically as soon as you start coding VHDL (.vhdl or .vhd files), Verilog/SystemVerilog (.v or .sv files), or Tcl (.tcl files):
Issues are displayed in the To hide problems from other extensions such as TerosHDL, watch our screencast. Paid VersionIf you're happy with the free version, you're welcome to request a trial license for the paid version to be able to:
Full list of available rules: The only configuration required is to link your VS Code workspace to your project on the Linty platform. Once linked, quality profiles, exclusions and any other pieces of configuration will be automatically applied in VS Code. Additional ExtensionsTo fully benefit from all features, we recommend installing the following powerful extensions, you can install the Linty HDL Designer Extension Pack which contains all these extensions:
UsageConnected Mode (Paid Version)Linty HDL Designer can connect to Linty to synchronize information on your project. By linking your VS Code workspace to the corresponding project in Linty, you will benefit from:
Here are the simple steps to connect your VS Code workspace to your Linty project:
Detailed Rule Description (Free and Paid Version)For each issue, you can access its associated detailed rule description.
Focus on New Code (Paid Version)You can either view all issues or focus solely on issues in new code. To switch between these modes, click
on
Open in IDE (Paid Version)Some rules, on Clock Domain Crossings (CDC)
or combinational loops
cannot be checked in real-time because they require processing time. Therefore, these issues will not appear in the
However, you can view these issues from the Linty web interface and then navigate to VS Code by clicking the
Reports (Paid Version)Generate/Refresh ReportTo generate/refresh the Linty report Ctrl + Shift + P +
Prior to your first analysis, you need to configure the following properties:
Go to Extension Setting > Linty: Local Analysis:
And edit in
Available Reports
These reports include diagrams, graphs, direct links to source code and much more.
To open the Linty report: Ctrl + Shift + P +
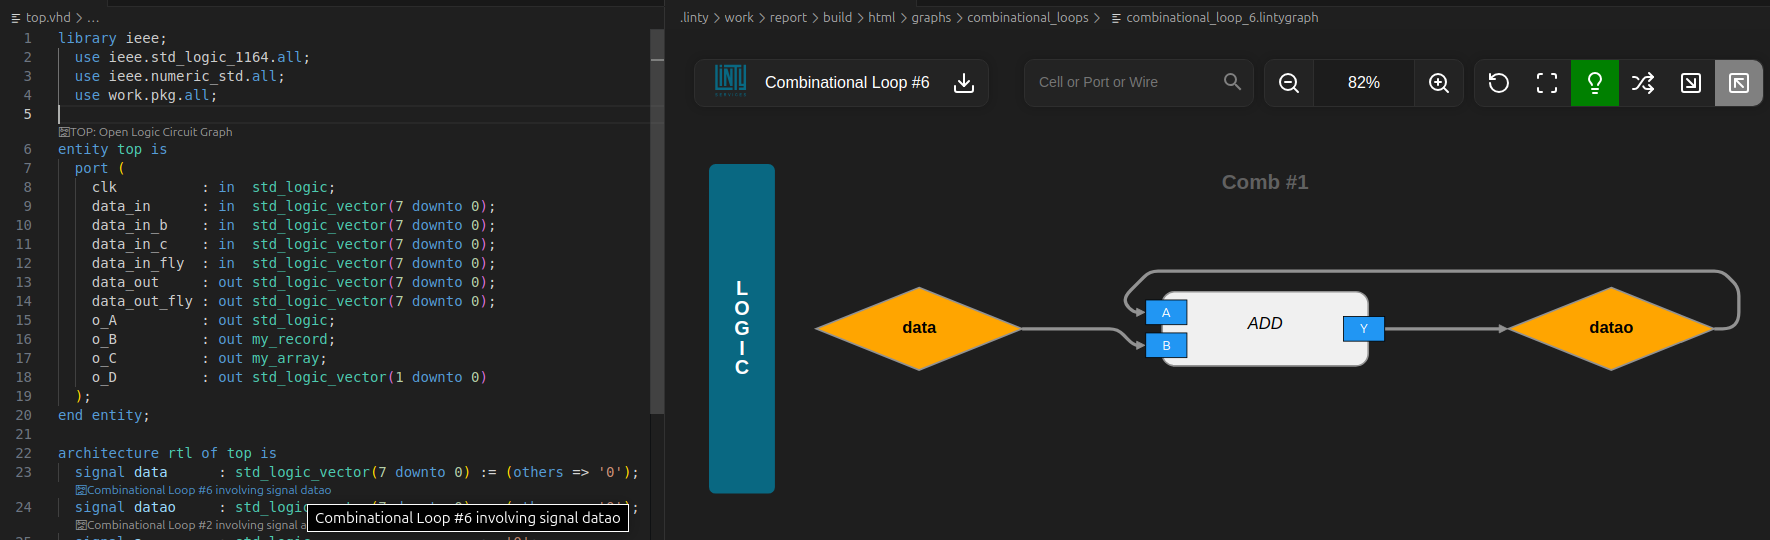
CodeLens (Paid Version)Information on CDCs, RDCs, and combinational loops are directly displayed in the source code. Are also included clickable links that open the corresponding logic circuit graphs and design graphs.
Requirements for AI Agents (Free Version)AI can generate HDL code. But can it generate your HDL code? AI assistants are great at speeding up development — especially when it comes to avoiding boilerplate and starting from scratch. But in real hardware projects, speed isn’t the problem. Consistency is. Every team has:
And if the AI assistant doesn’t know them, it can’t respect them. That’s why we introduced instruction files at Linty. We automatically generate a Markdown file that captures all your project’s coding rules — and feed it directly to AI assistants like Copilot. Same prompt. Same workflow. But now the generated code is fully compliant with your standards. Even better: the instruction file is tool-agnostic, so it can be reused with any AI agent. AI shouldn’t just write code faster. It should write code the way your team expects it. Run Ctrl + Shift + P + All CommandsAll commands are accessible by pressing Ctrl + Shift + P and then selecting
Project SampleFor an overview of all features, please, explore our project samples:
DebugIn some environments, restarting VS Code may be necessary to activate all features. Please allow some time after setting up connected mode, as synchronization with your Linty platform might take a while, depending on your network connection. If issues persist, gather debug information by configuring analyzer logs to appear in the Linty HDL Designer output by adjusting the following extension settings:
The, display log output by pressing Ctrl + Shift + P and selecting
Compatibility Matrix for Linty Toolbox Components
|