Nifty Bash Debugger
Debug Bash scripts without bashdb: breakpoints, conditions, logpoints, stepping, call stack, variables and arrays. Works with bash 4.2 to 5.2+ and Git Bash on Windows.
Maintained. No sign-in. No telemetry. Works in VS Code, Cursor, Windsurf, VSCodium and other editors that use Open VSX.
Features
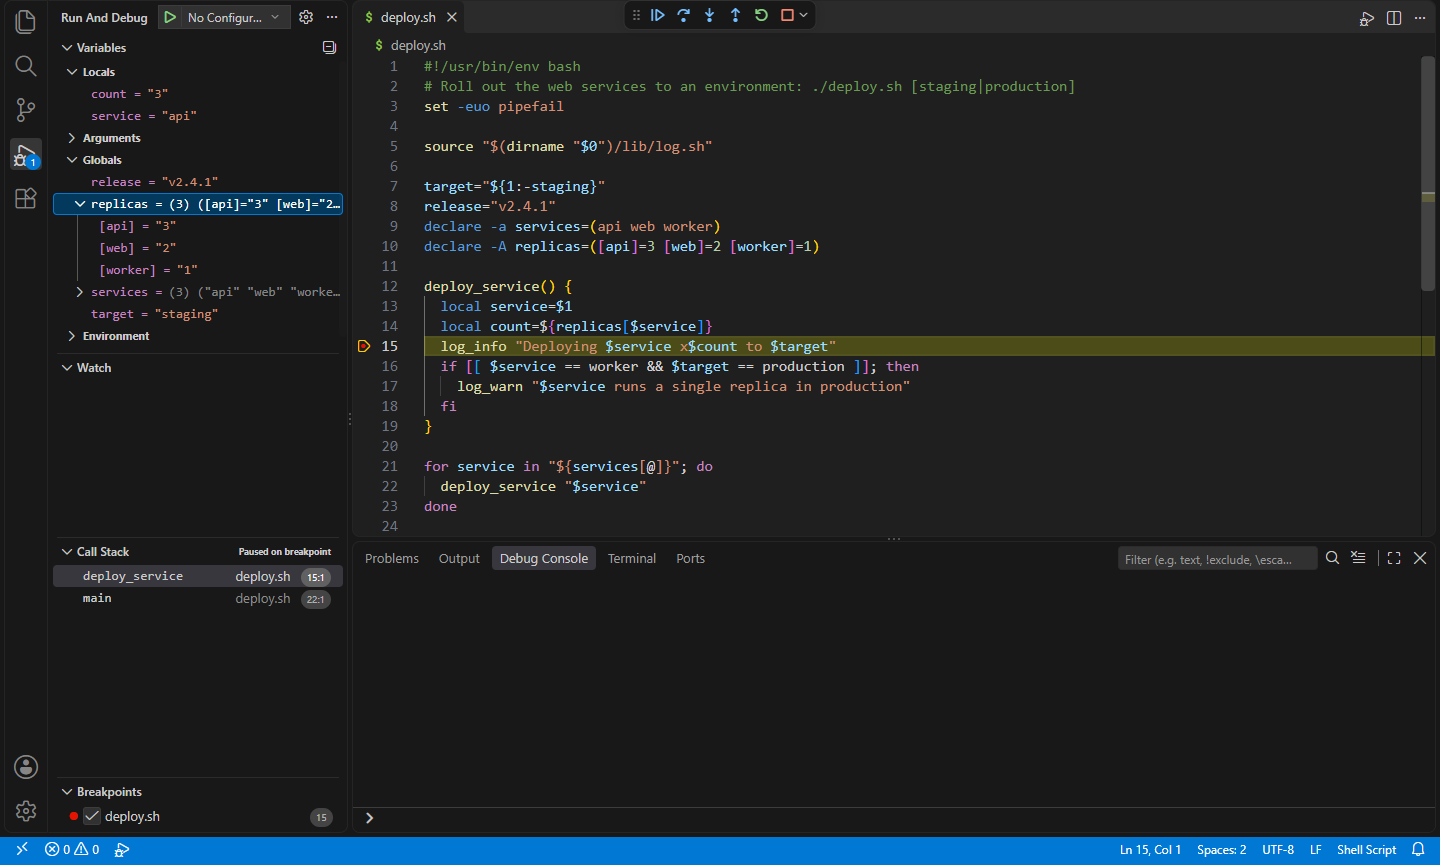
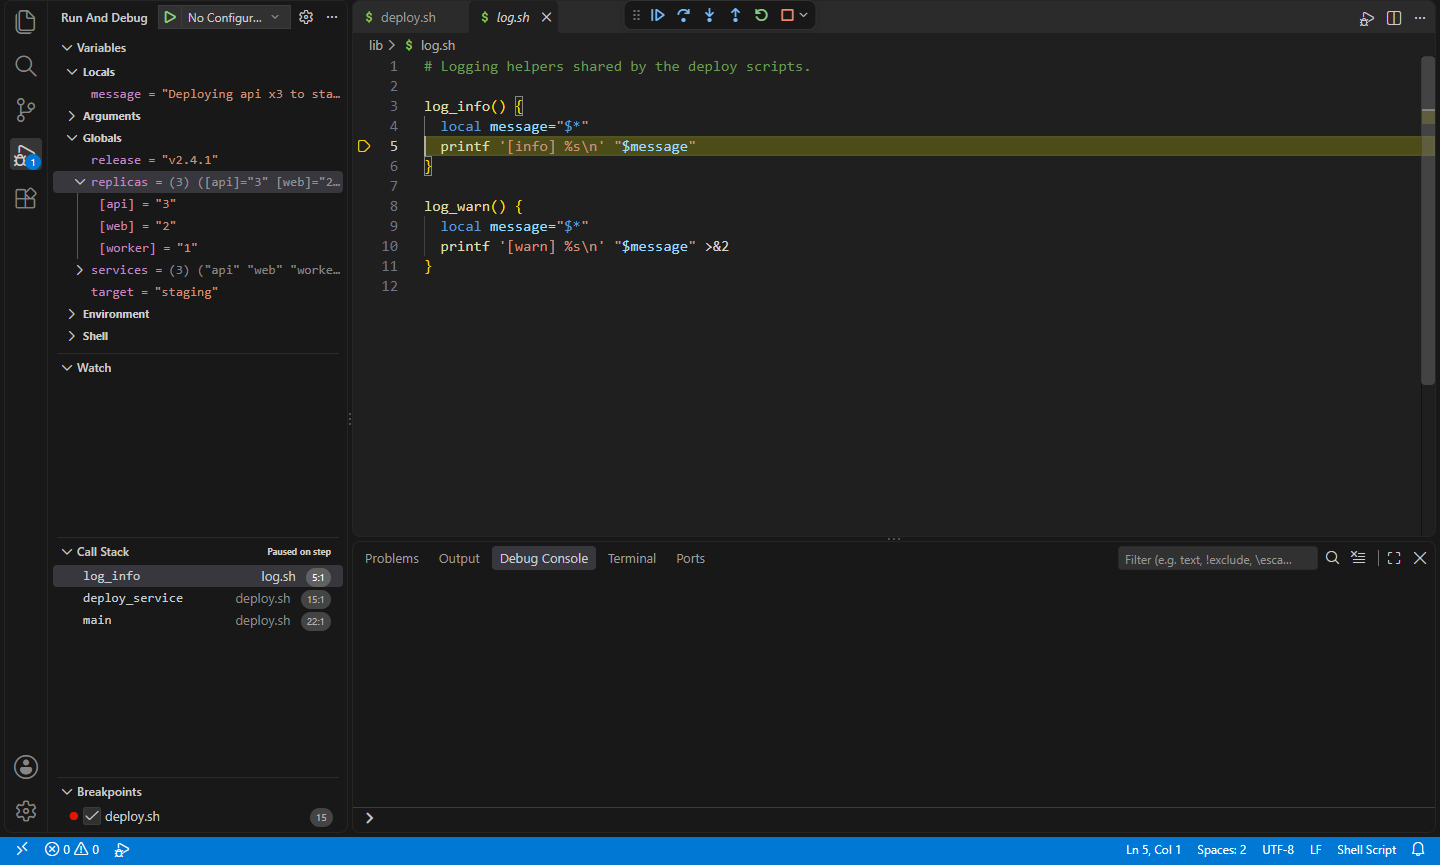
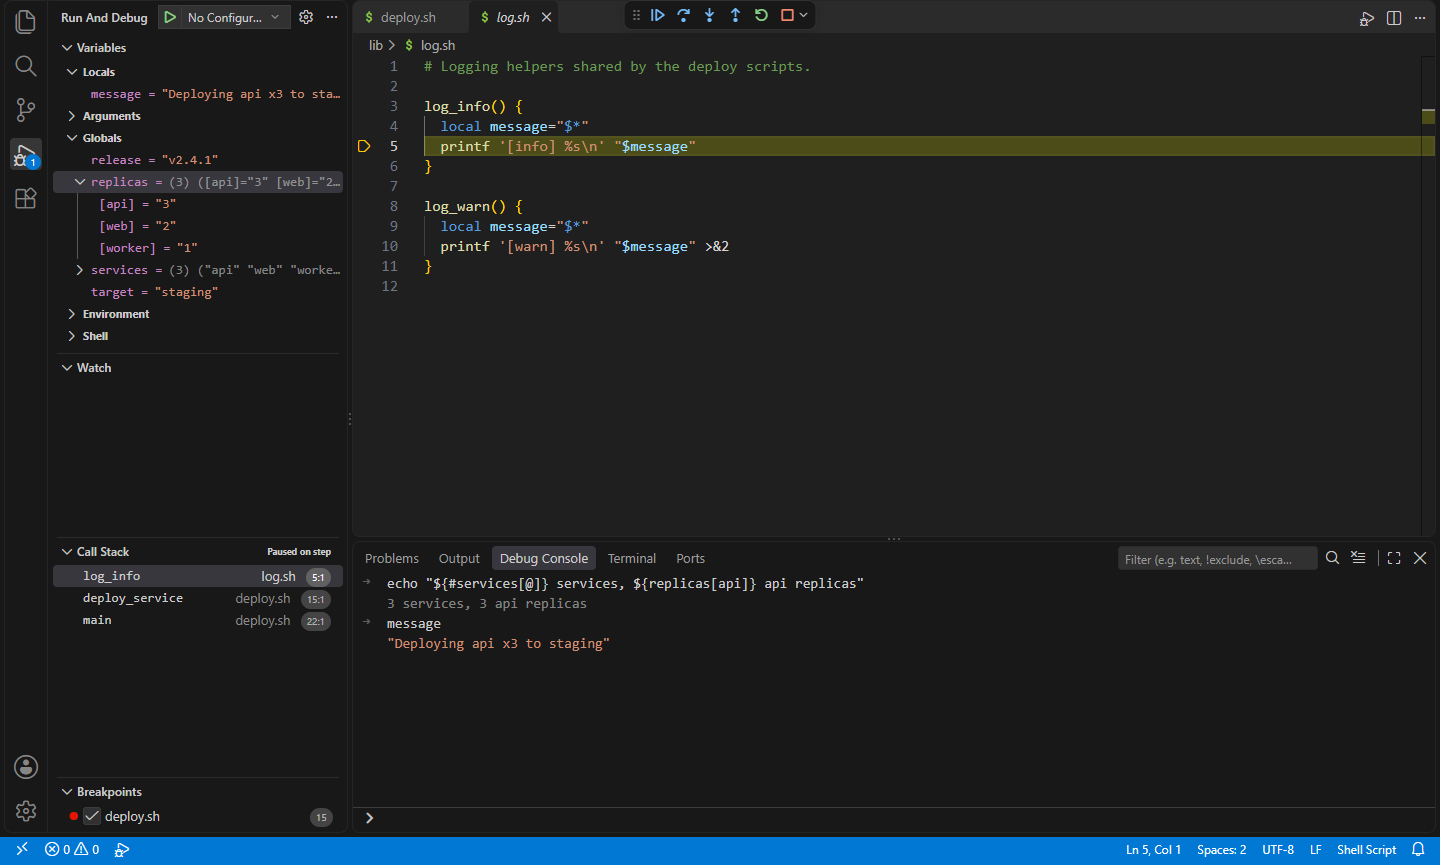
- Nothing else to install. No bashdb: the debugger drives bash itself, so it works with the bash you already have, including bash 5.2 and newer (which bashdb doesn't support) and Git Bash on Windows.
- Breakpoints that land where bash actually runs something: a breakpoint on a blank line, a comment,
fi/done or inside a here-document moves to the next command.
- Conditional breakpoints with bash tests:
$count -gt 3, "$env" == prod*, -f $lock_file, or a command such as (( i % 10 == 0 )).
- Hit counts (
5, >=3, %10) and logpoints (deploying {service} to {target}, or plain $service) that print without stopping.
- Step over, into and out, through functions and
sourced files. A breakpoint on a function's first line stops each time the function is called.
- Call stack with function names, the files they're in and their arguments.
- Variables: locals, arguments (
$1, $#, $?), globals, environment and bash's own variables, with arrays and associative arrays you can expand. Change a value in place (Set Value), including a single array item.
- Debug Console: type a variable name to see it, or run any command (
echo "${#hosts[@]}", ls "$dir", count=5) in the script's context. Hover over a variable in the editor to see its value, and use Watch expressions such as ${#list[@]} or $((total / count)).
- Pause a running script, stop it (its EXIT traps still run when it's stopped at a breakpoint), and see its exit code.
- Input and output: scripts run in the integrated terminal by default, so
read prompts work; or send output to the Debug Console with "console": "debugConsole".
- Run Without Debugging (
Ctrl+F5) runs the script as it is, with the same launch settings.
set -euo pipefail, set -x and IFS changes in your script keep working: the debugger's own commands don't trip them or show up in -x traces.
Getting started
Open a bash script and either:
- choose Debug Bash Script from the ▷ menu in the editor title, the editor's right-click menu or the Explorer's, or
- press
F5 (with no launch.json, the open script is debugged), or
- add a configuration to
.vscode/launch.json (type nifty in it for snippets):
{
  "type": "nifty-bash",
  "request": "launch",
  "name": "Deploy to staging",
  "program": "${workspaceFolder}/deploy.sh",
  "args": ["staging", "--verbose"],
  "env": { "DRY_RUN": "1" }
}
Launch configuration
| Attribute |
Default |
What it does |
program |
|
The script to debug |
args |
[] |
Arguments, as a list or one string split like a shell would |
cwd |
the script's folder |
Folder to run in |
env |
{} |
Extra environment variables (null removes one) |
stopOnEntry |
false |
Stop before the first command |
console |
integratedTerminal |
integratedTerminal (the script can read input) or debugConsole (its input is empty) |
bashPath |
the setting, then found automatically |
The bash to use |
transport |
auto |
How bash talks to the debugger: fifo (named pipes, the default on macOS and Linux) or tcp (a local port through bash's /dev/tcp, the default on Windows) |
Commands
| Command |
What it does |
Nifty Bash Debugger: Debug Bash Script |
Debug the open script (also in the editor title's ▷ menu and the right-click menus) |
Settings
| Setting |
Default |
What it does |
nifty.bash-debug.bashPath |
"" |
The bash to debug with. Empty finds one: Git Bash on Windows, Homebrew's bash on macOS, otherwise bash on PATH |
Windows
Scripts run in Git Bash (from Git for Windows). The debugger looks for it next to git on PATH, at VS Code's git.path, in Program Files\Git, in %LOCALAPPDATA%\Programs\Git and in Scoop, then tries MSYS2 (C:\msys64) and Cygwin (C:\cygwin64). Point nifty.bash-debug.bashPath at another bash.exe if yours is elsewhere.
- WSL's
bash.exe (in System32) is never used: it runs Linux, where the script's Windows paths don't exist. To debug inside WSL, open the folder with VS Code's WSL support and install the extension there; it then uses Linux bash.
- The script receives its path as
C:/path/to/script.sh (forward slashes), which Git Bash understands, so $(dirname "$0") works.
- bash talks to VS Code over a TCP connection to
127.0.0.1 on a random port (Git Bash has no named pipes that Windows programs can open). The debugger only accepts the script it started, which proves itself with a one-off token.
- Starting processes is slow on Windows, so scripts that run many external commands or
$(…) substitutions are slower in Git Bash than on Linux, with or without the debugger.
Good to know
- bash 4.2 or newer. macOS ships bash 3.2 as
/bin/bash; install a current one with brew install bash (the debugger finds it in Homebrew's folders).
- Subshells run without stopping. Code in
( … ), $( … ), background jobs (&) and the parts of a pipeline that bash runs in a subshell (such as cmd | while read …; do …; done) runs normally; breakpoints inside it are skipped. while read …; done < file and < <(cmd) loops run in the script itself and can be debugged.
- Other scripts the script starts (
bash other.sh, ./other.sh) run normally. Scripts it sources are debugged.
- Pause takes effect at the next command. If the script is waiting for a long command (
sleep 60, curl …), it pauses when that finishes.
- Outer functions' locals. bash can only list the locals of the function the script is stopped in. For functions further up the call stack, the debugger shows the variables their
local commands created, with the values bash sees now.
- The Debug Console and watches run in the innermost function, whichever call stack frame is selected.
- Some multi-line commands (an array written over several lines, a string with line breaks) are reported by bash on their last line, so put breakpoints there.
- Speed. Every command passes through the debugger's
DEBUG trap. That adds roughly 50 µs per command on Linux and 80 µs in Git Bash on Windows, so a loop that runs 100,000 commands takes about 5 to 8 seconds longer while debugging. Scripts that mostly wait for other programs barely notice.
- How it works: the script runs in your bash with a small prelude (through
BASH_ENV) that sets a DEBUG trap, set -T and shopt -s extdebug. A script that sets its own DEBUG trap, or removes it with trap - DEBUG, turns debugging off from that point. With set -T, RETURN traps are inherited by functions while debugging.
Install
- VS Code: search for "Nifty Bash Debugger" in the Extensions view, or install from the Visual Studio Marketplace.
- Cursor, Windsurf, VSCodium, Kiro, Antigravity: install from Open VSX.
Privacy
This extension collects no telemetry, needs no account and makes no network requests. On Windows, bash connects to the debugger on this computer only (127.0.0.1).
- Nifty Shell Format: shfmt Formatter for Bash: Format shell scripts (bash, sh, zsh, bats) with shfmt built in: no binary to install, reads .editorconfig, and shows syntax errors. (Open VSX)
- Nifty Env: .env Files, Profiles & Secrets: Load .env files into terminals, tasks and debug sessions, switch between .env profiles, hide secret values on screen, and check .env against .env.example. (Open VSX)
- Nifty C# Scratchpad: Run C# Snippets & NuGet: Run C# snippets instantly with NuGet packages and rich Dump() output, a LINQPad-style scratchpad and Polyglot Notebooks replacement. (Open VSX)
- Nifty Code Runner: Run Code in 25+ Languages: Run the current file or selection in 25+ languages in the terminal, with input support, your own commands and no telemetry. (Open VSX)
- Nifty Run: npm Scripts, Make & Task Runner: Everything you can run in one view: npm, pnpm and yarn scripts, make and just targets, Python and Go entry points, .NET, Cargo and Docker Compose. Run, debug or save to tasks.json. (Open VSX)
- Nifty .NET Explorer: Solution & Test Explorer: A solution explorer and test explorer for .NET in VS Code, Cursor, Windsurf and VSCodium: projects, references and files from .sln/.slnx, and xUnit, NUnit and MSTest tests in the Testing view. (Open VSX)
See all 100+ Nifty extensions and web tools at https://getnifty.dev
| |

