Aseprite Debugger for Visual Studio CodeAseprite Debugger VSC is an Visual Studio Code extension, which enables debugging of Aseprite scripts and extensions.
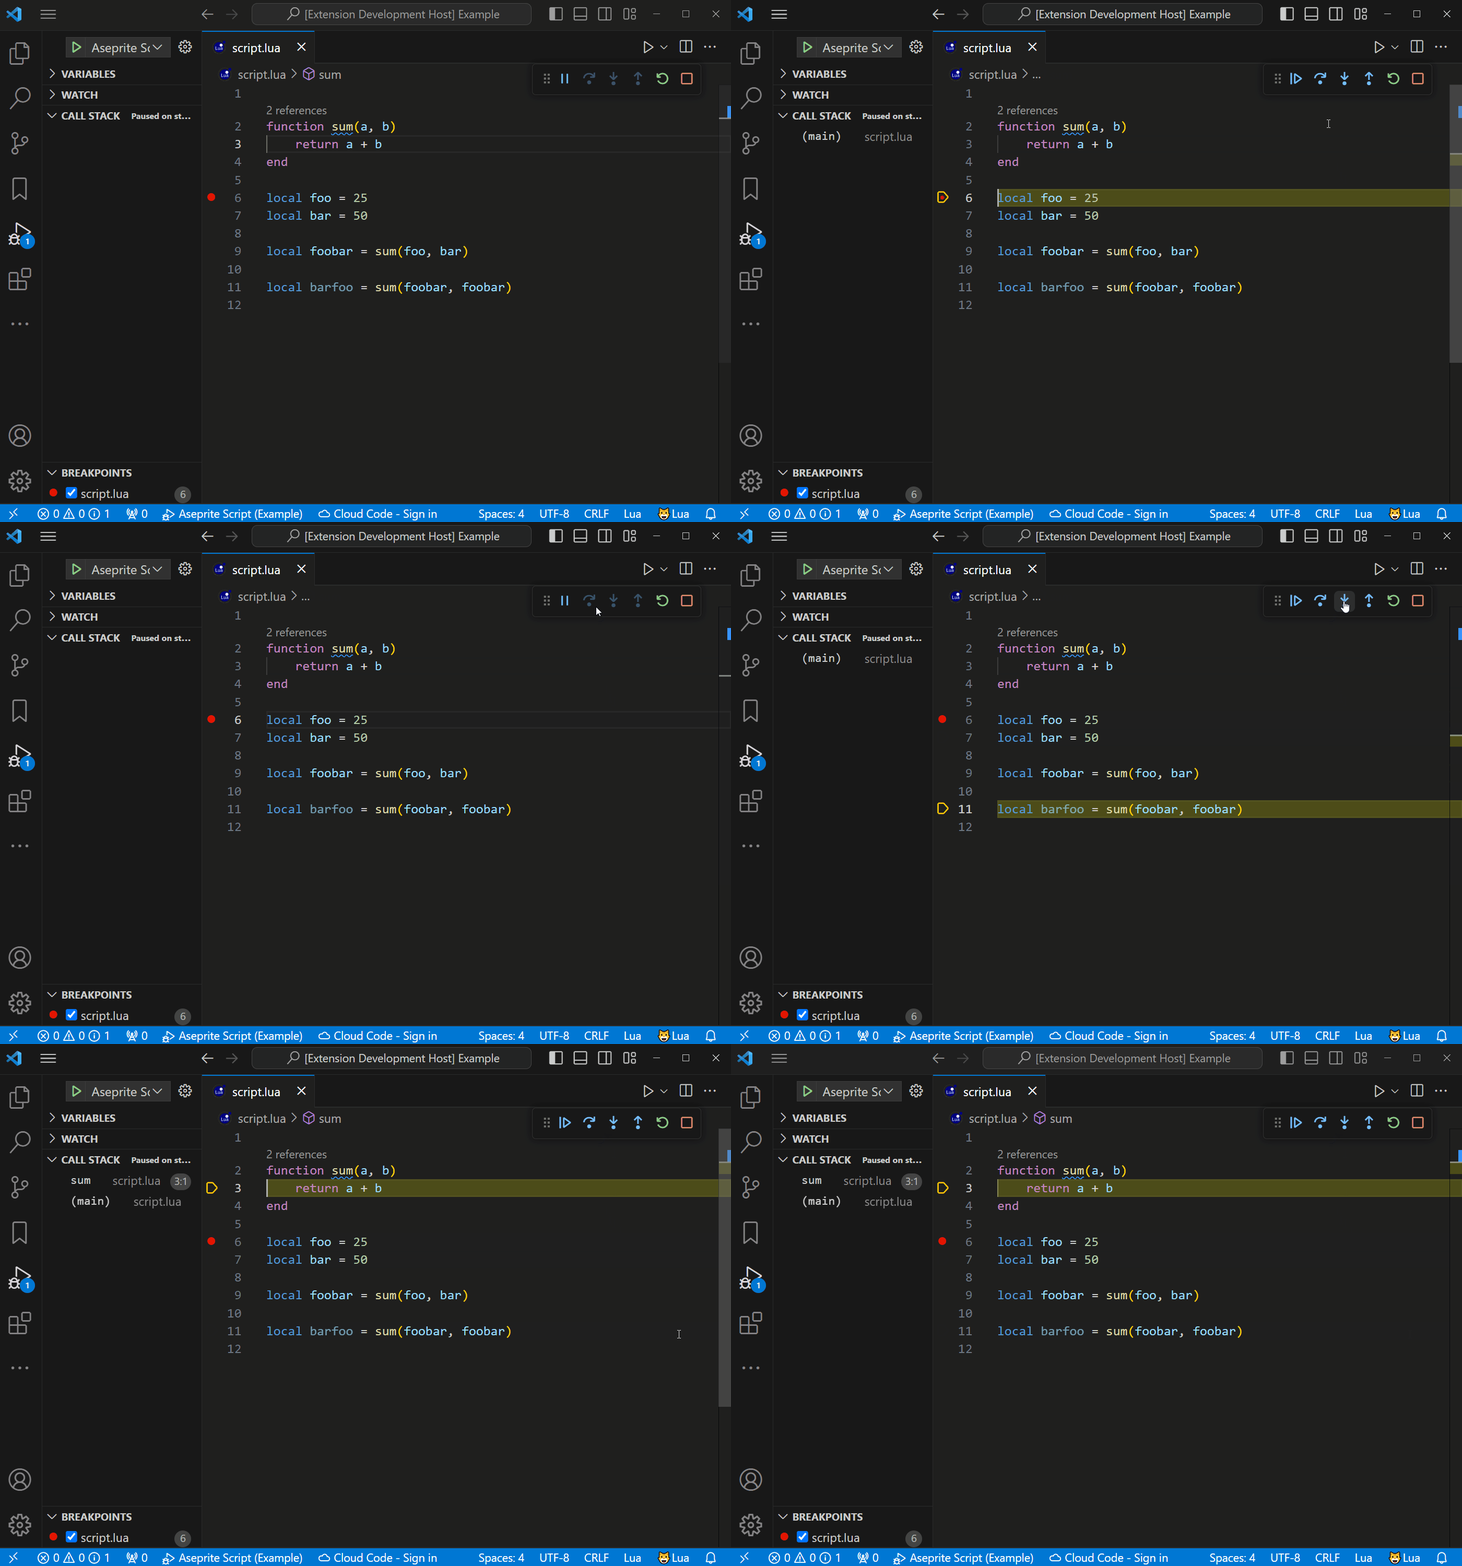
FeaturesBreakpointsSet breakpoints, step through code and view stack trace.
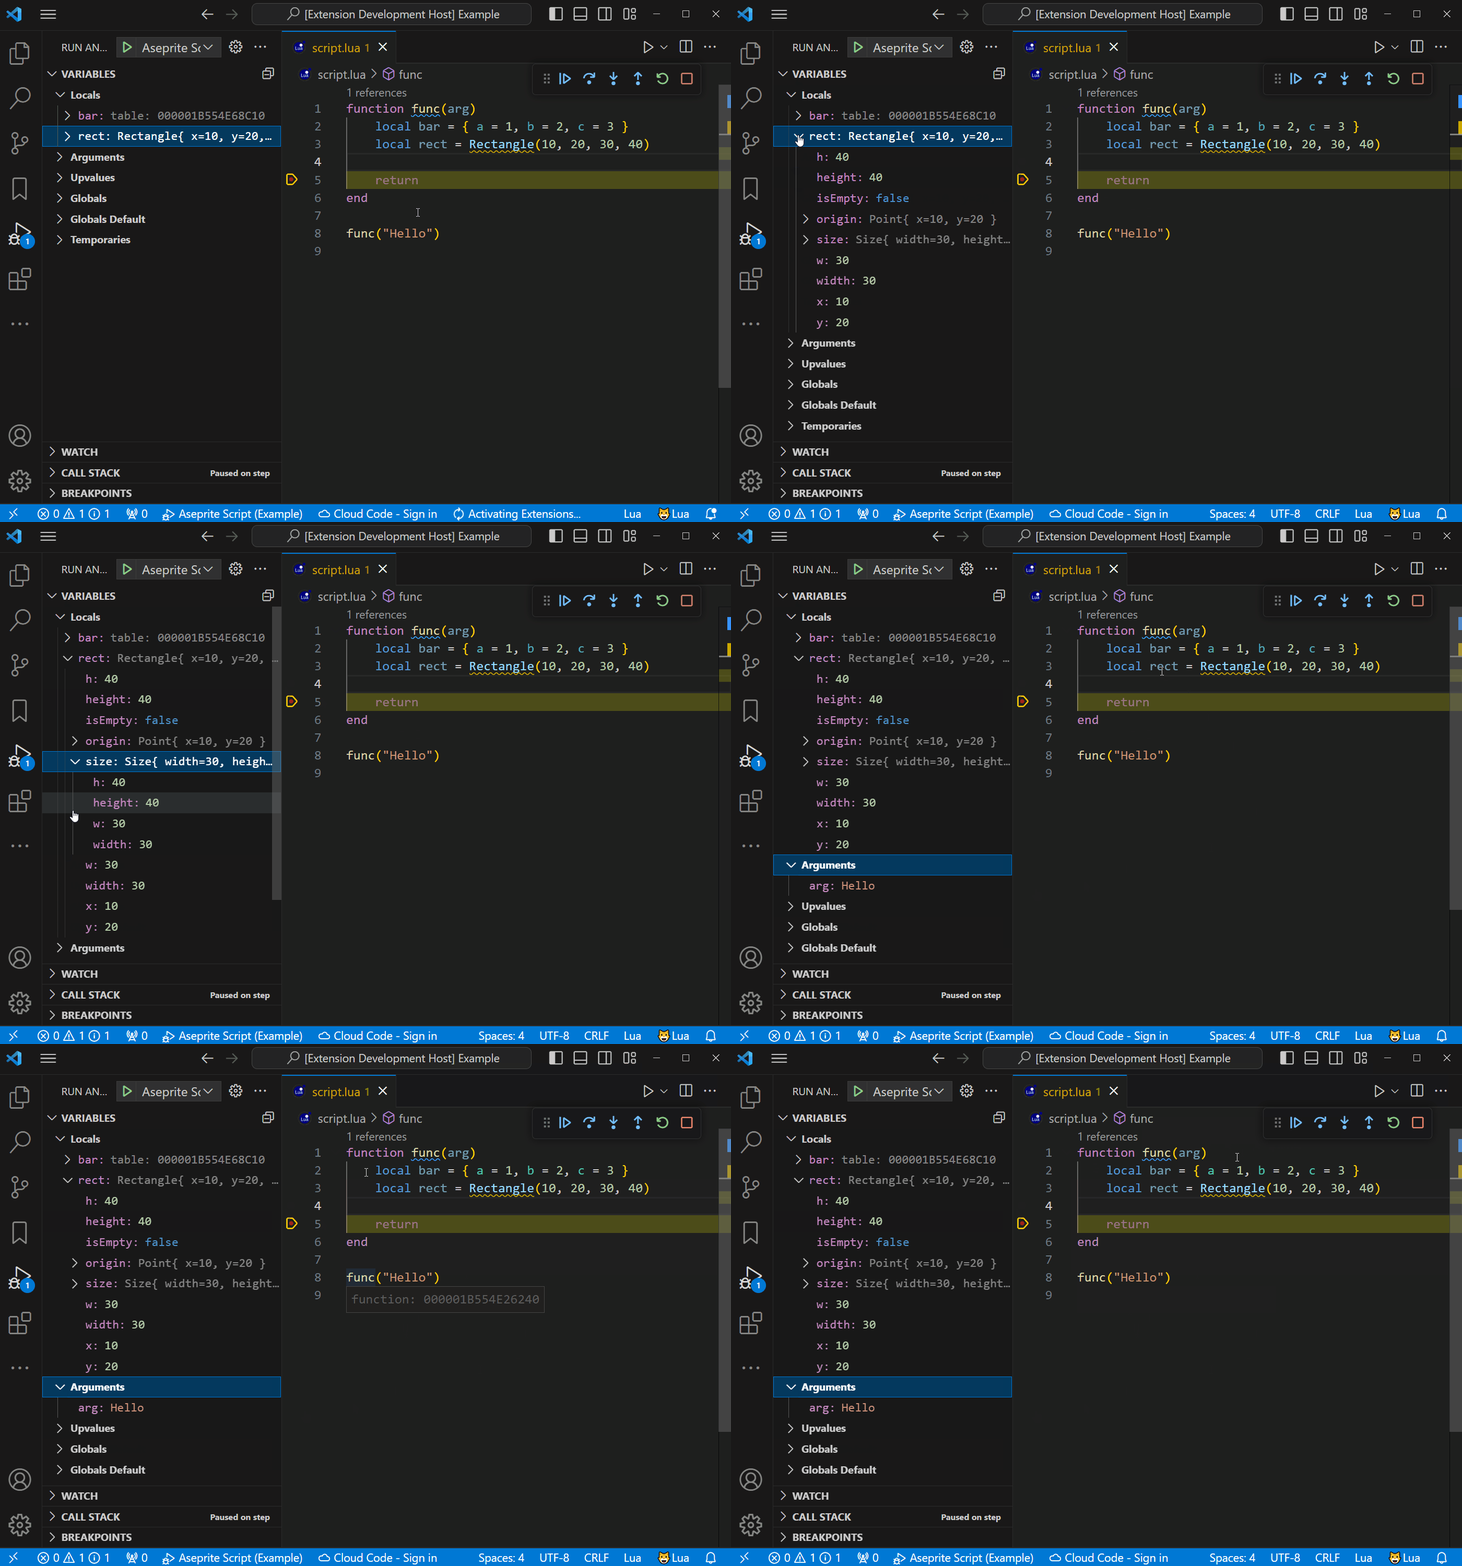
Variable InspectionInspect values of variables, including Aseprite objects.
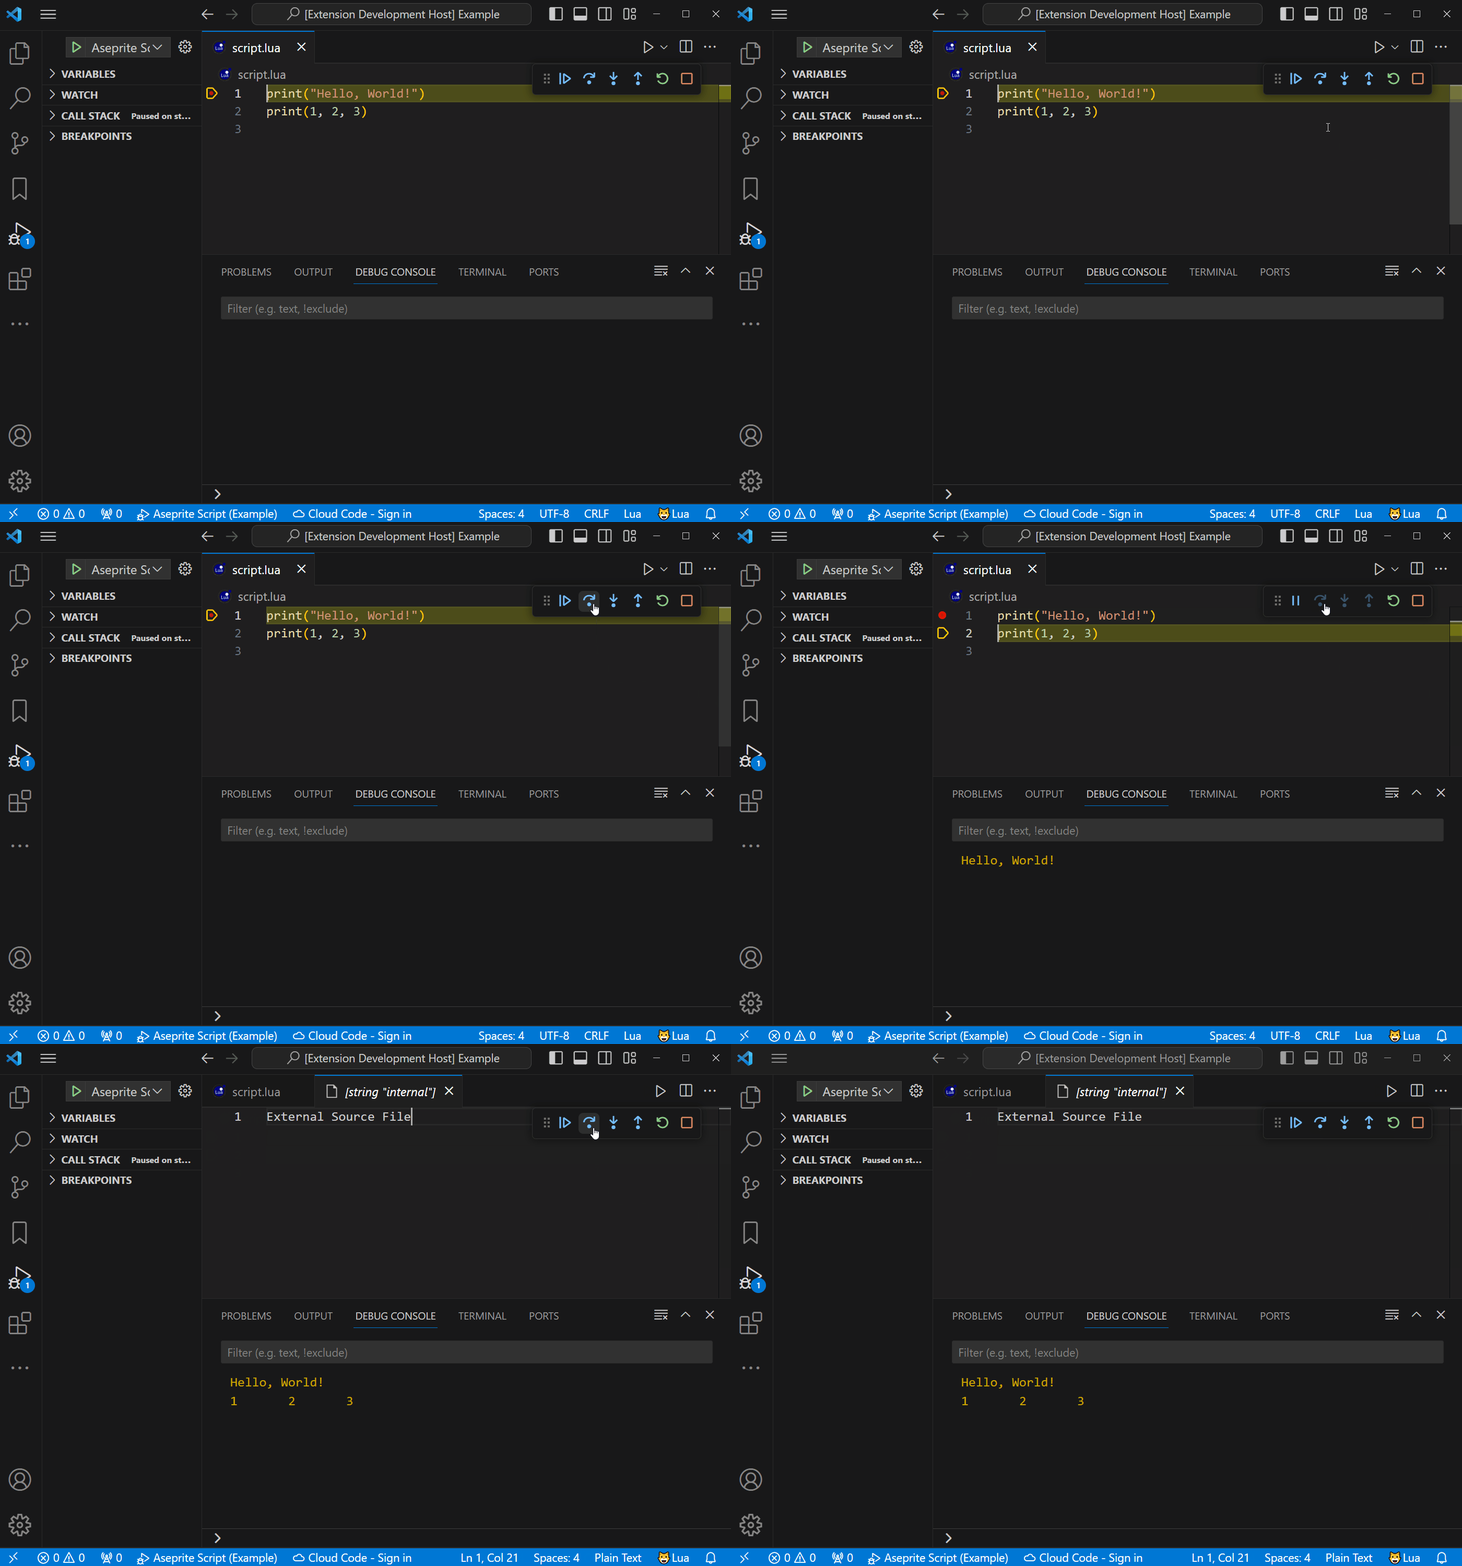
LoggingView logs in VSCode Debug Console, instead of the Aseprite Console window.
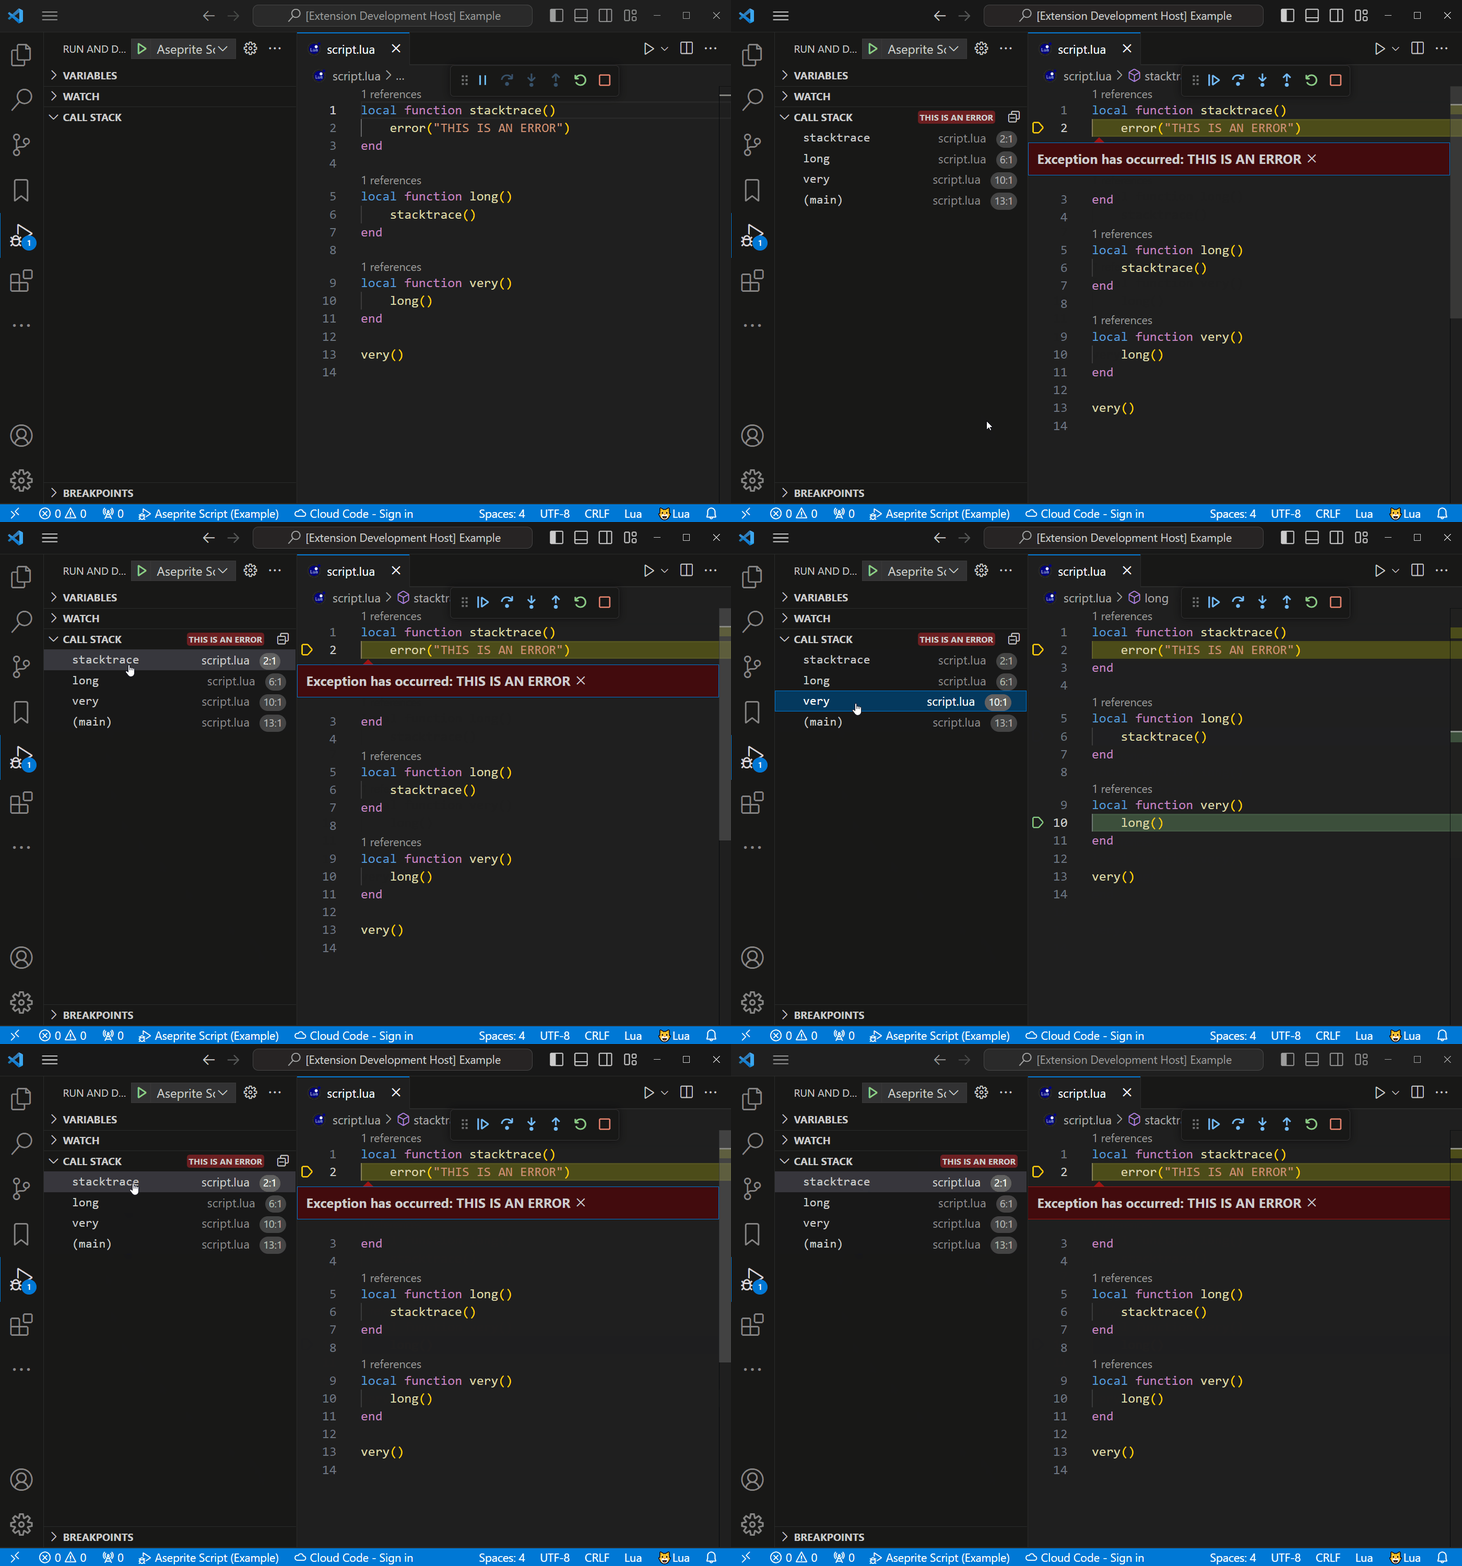
Error DetectionDetect lua errors, and provide a full stacktrace of the problematic code.
Script And Extension SupportDebug either scripts or extensions.
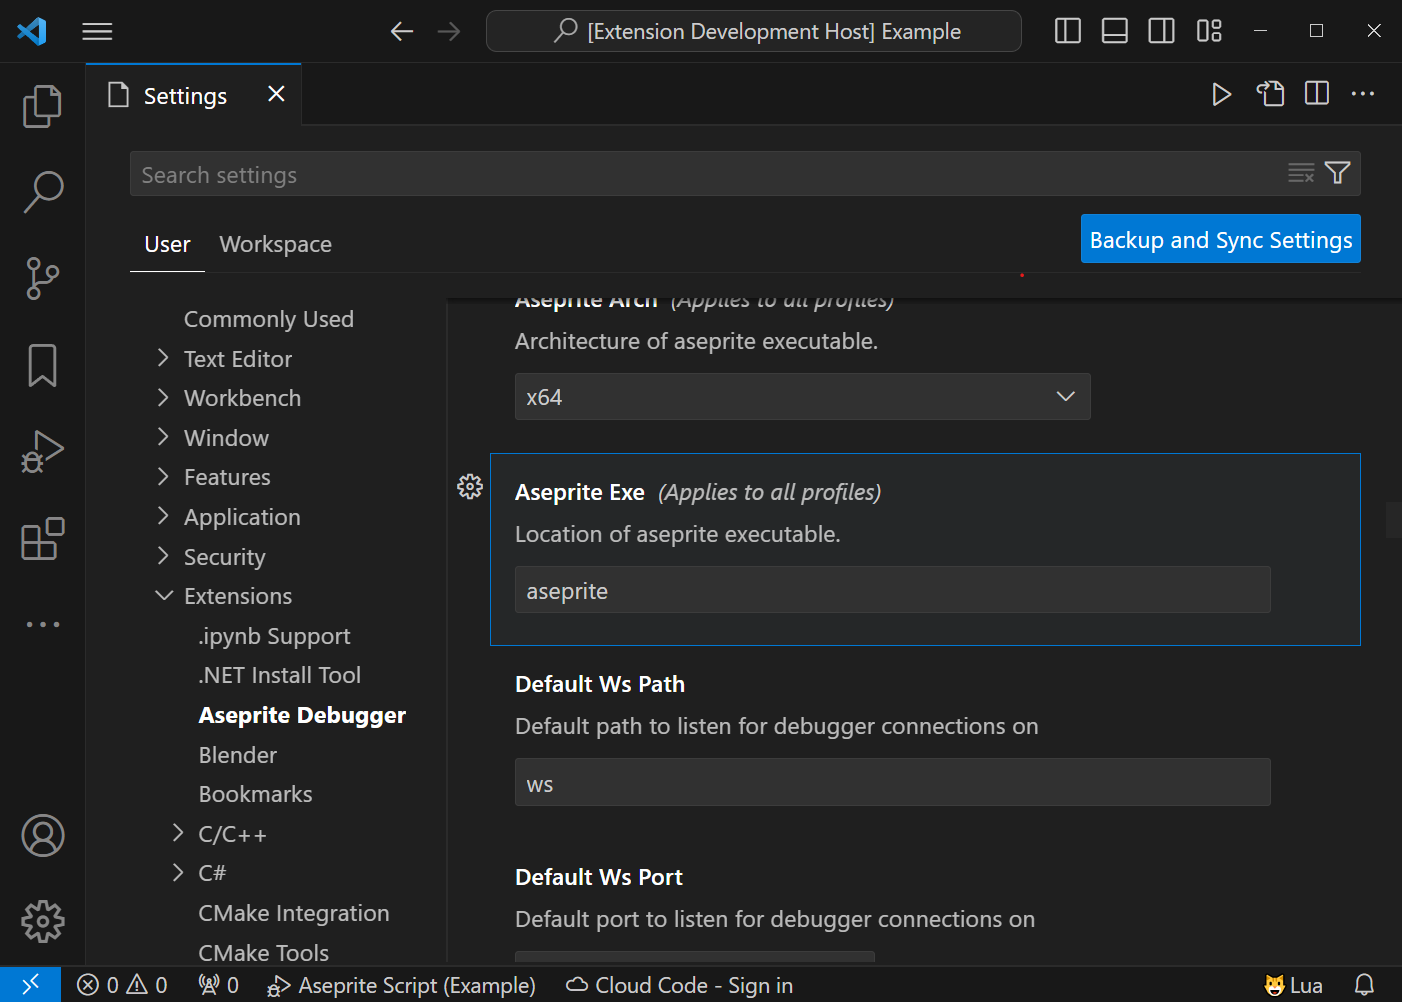
Setup Extensionthe Aseprite Debugger VSC extension require some setup after an initial install, please perform the below steps to ensure it will work properly. Install ExtensionThe extension can be installed either via. the Visual Studio Marketplace, or by directly installing the .vsix file from the latest release, using the 'Extensions: Install From VSIX...' command. Install Lua Language SupportThis extension requires an vscode extension to provide language support for lua, like Lua by sumneko. Make sure this extension, or a similar one, is installed before proceeding. Specify Aseprite LocationGo to the Aseprite Debugger extension settings, and change the 'Aseprite Exe' property to a path pointing to an aseprite executable file.
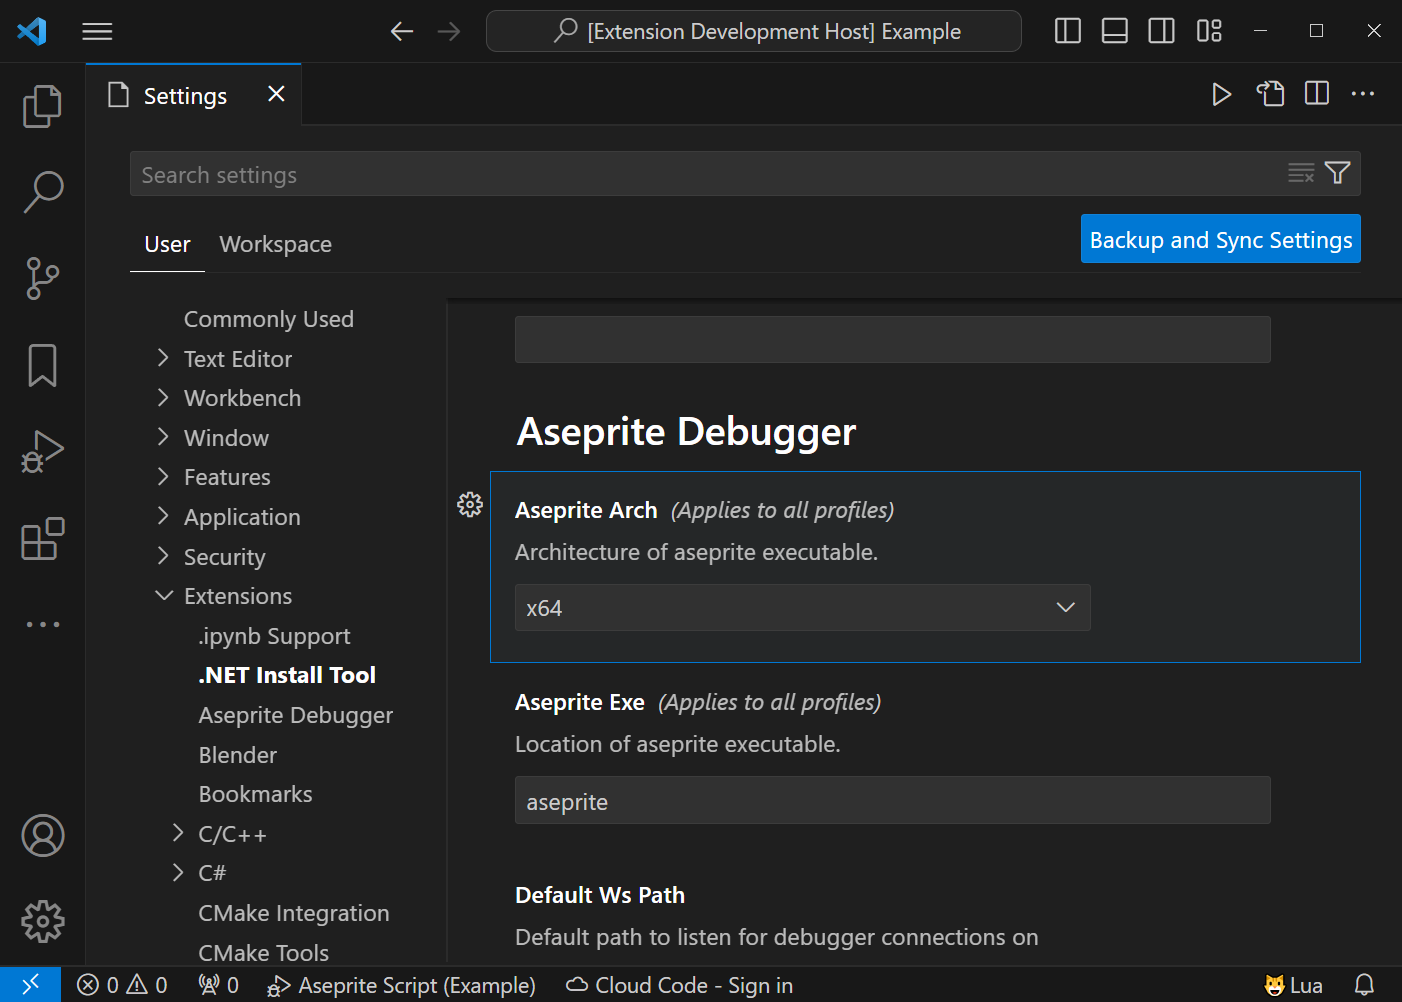
If installed through steam, its location can be determined by finding aseprite in your library, right clicking it and pressing the Manage > Browse local files item. Alternatively, the located aseprite executable can be added to path, and then the default value will work out of the box. Specify Executable Architecture (optional)This step is not neccessarry for the majority of users, since the default value is likely to be correct for the majority of aseprite installs. Go to the Aseprite Debugger extension settings, and change the 'Aseprite Arch' property to the architecture of the aseprite executable pointed to by 'Aseprite Path'.
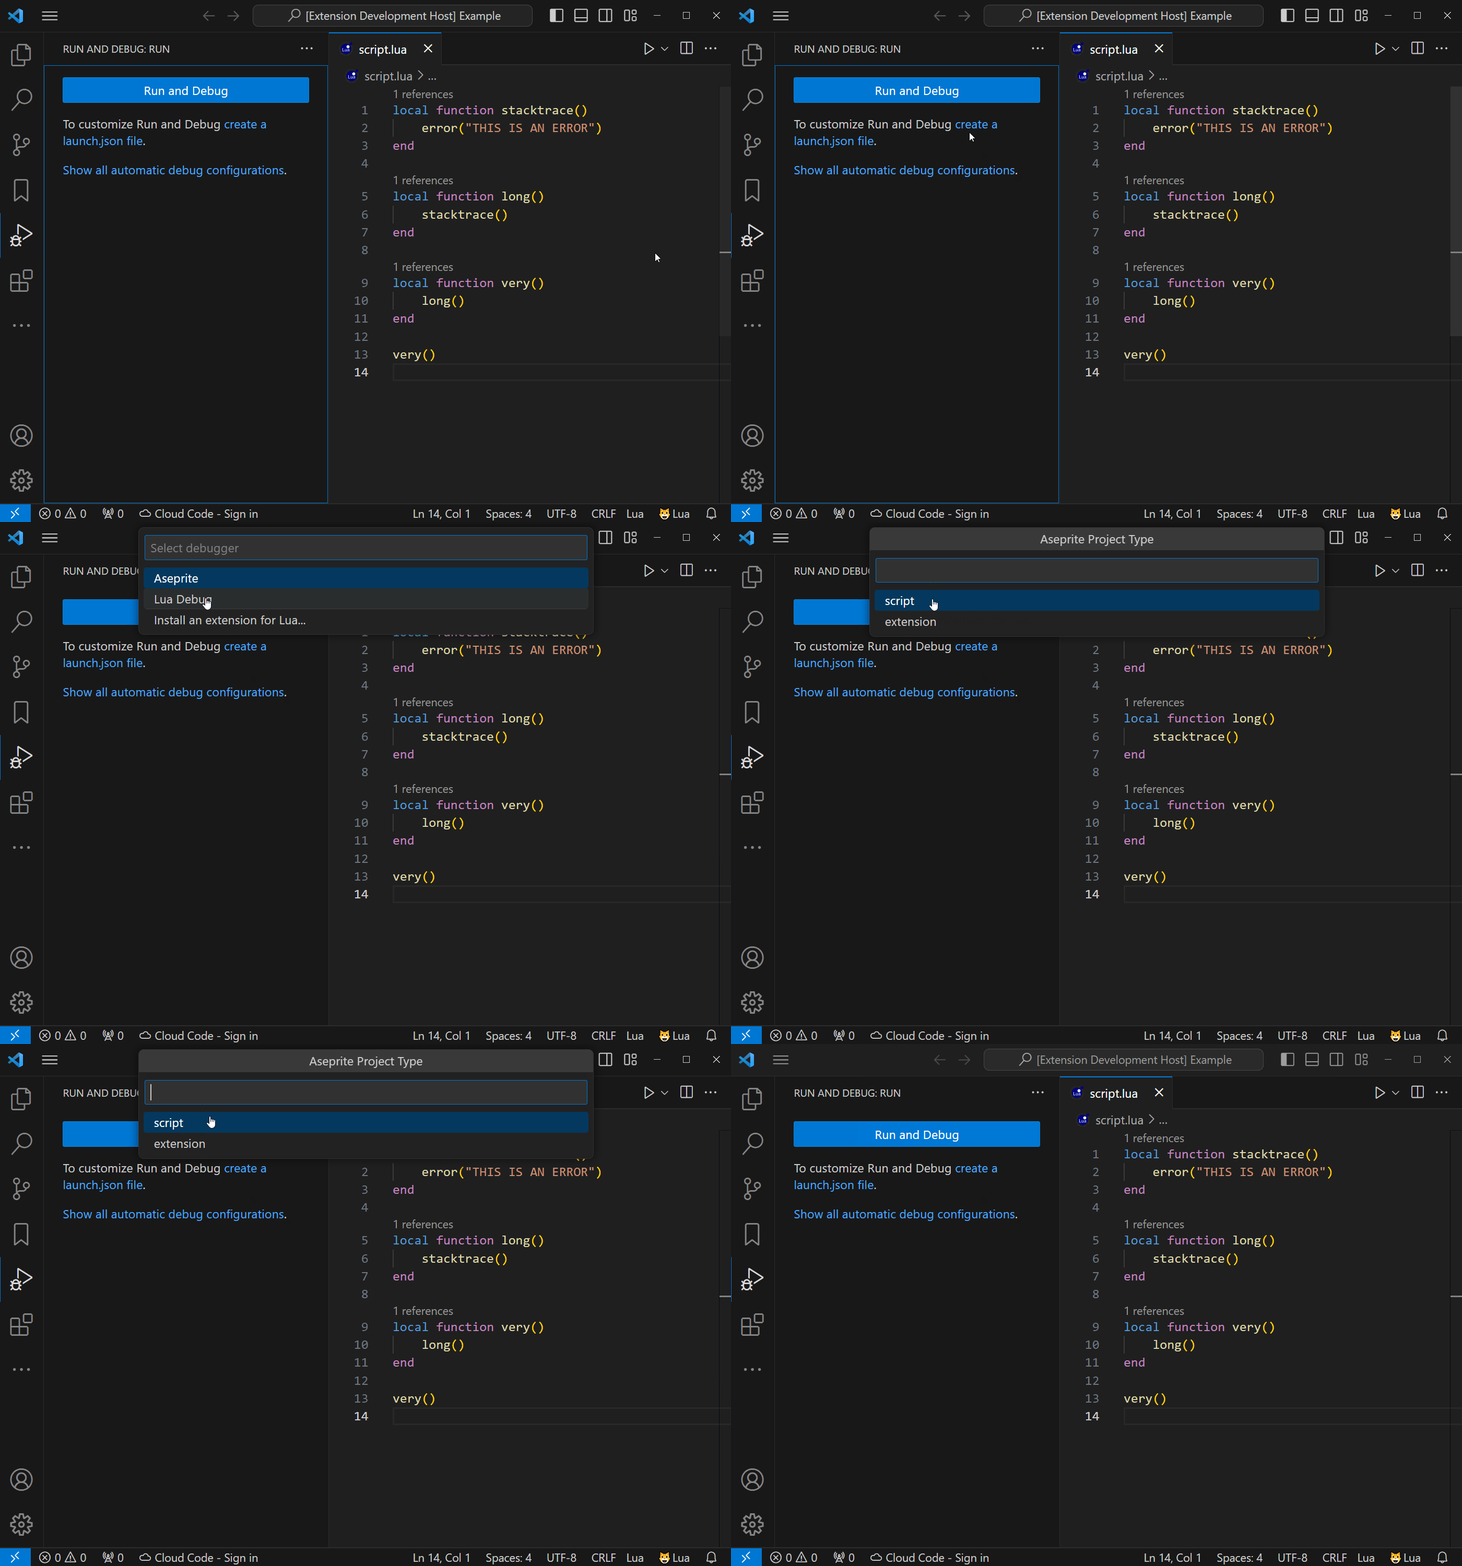
The architecture can be determined by going to 'Help' > 'About' in aseprite, and examining the version number. The last section will specify the architecture, (ex. Aseprite v1.3-x64 means architecture is x64) Setup VSCode Workspace for DebuggingTo set up a Visual Studio Code workspace for Aseprite Debugging, follow the below steps.
Debugging the workspace will now run Aseprite with the debugger attached, and the script or extension intalled in Aseprite. The first time the debugger is run, Aseprite will prompt the user for script permissions, make sure to select 'Give full trust to this script' for the 'Aseprite Debugger' script when this pops up. CommandsTo retreive the latest stacktrace from the debugger, the command 'Aseprite Debugger: Show Latest Stacktrace' can be used. This will pause the debug session and show the stacktrace. The debug session will terminate when continued, after this command has been used. This command is primarily useful for getting the stacktrace of an error not caught by the debugger, see Non Error Errors. LimitationsEditing Source Files Whilst DebuggingIf a source file is modified whilst debugging, the changes will not be reflected until the debug session has been restarted, as the source files are installed only on debug session starts. Aseprite ControlThe Aseprite application will freeze preventing any user interaction, when the debugger is paused. This is caused by the debugger needing to block the currently running lua script, which in turn blocks the entire Aseprite application process. Extension NameThe debugged extension must not start with '!', as it would no longer be guaranteed for the debugger to be loaded as the first extension. Lua GlobalsThe debugger lives inside the ASEDEB global namespace, so this value should not be modified in any scripts or extensions running in Aseprite. Additionally, the debugger overrides the global 'print' and 'error' functions, so these should not be reassigned, without calling the original print and error functions inside the reassigned functions. Non Error ErrorsThe debugger is not able to catch an error, if it was not caused by a call to 'error'. If an error is hit, and it is not caught by the debugger, you can use the 'Aseprite Debugger: Show Latest Stacktrace' as a workaround for getting the stacktrace of the error, provided no other scripts have run after the error was thrown. Windows OnlyThe debugger currently only works on windows, as aseprite is not able to load shared libraries on macos or linux, which is required for the debugger to work. Built With
LinksLicenseSee LICENSE |


