Skip to content
| Marketplace
Sign in
Visual Studio Code>Debuggers>Bevy Diagnostics ExplorerNew to Visual Studio Code? Get it now.
Bevy Diagnostics Explorer

Bevy Diagnostics Explorer

Vladimir Zaytsev

|
1,117 installs
| (0) | Free
Diagnostics Explorer for Bevy Engine
Installation
Launch VS Code Quick Open (Ctrl+P), paste the following command, and press enter.
Copied to clipboard
More Info

📊 Bevy Diagnostics Explorer – plugin and VSCode extension for visualizing diagnostics

Example

How to use

Watch the video

  1. Add dependency to Cargo.toml:
[dependencies]
bevy_diagnostics_explorer = "0.1.0"
  1. Add plugin to your app:
use bevy_diagnostics_explorer::DiagnosticsExplorerPlugin;
...
    .add_plugin(DiagnosticsExplorerPlugin)
  1. Disable default logging system
use bevy::log::LogPlugin;

...
    .disable::<LogPlugin>()

  1. Enable trace feature for Bevy in Cargo.toml:
[dependencies]
bevy = { version = "...", features = ["trace"] }
  1. Run VSCode with Bevy Diagnostics Explorer;

How it works?

Based on Tracing, Actix, and VSCode.

  • The plugin initiates a global tracing subscriber, named AgentTracingLayer. Its function is to gather diagnostic spans from the application, which are then stored in a temporary buffer. This storage process utilizes the cross-beam channel.
  • Next, the plugin creates a background thread. This thread includes an HTTP server, provided by Actix, that serves the collected spans.
  • The v1 encoding for spans and name registries is done in a simple and compact manner. In essence, it is a set of base64 buffers.
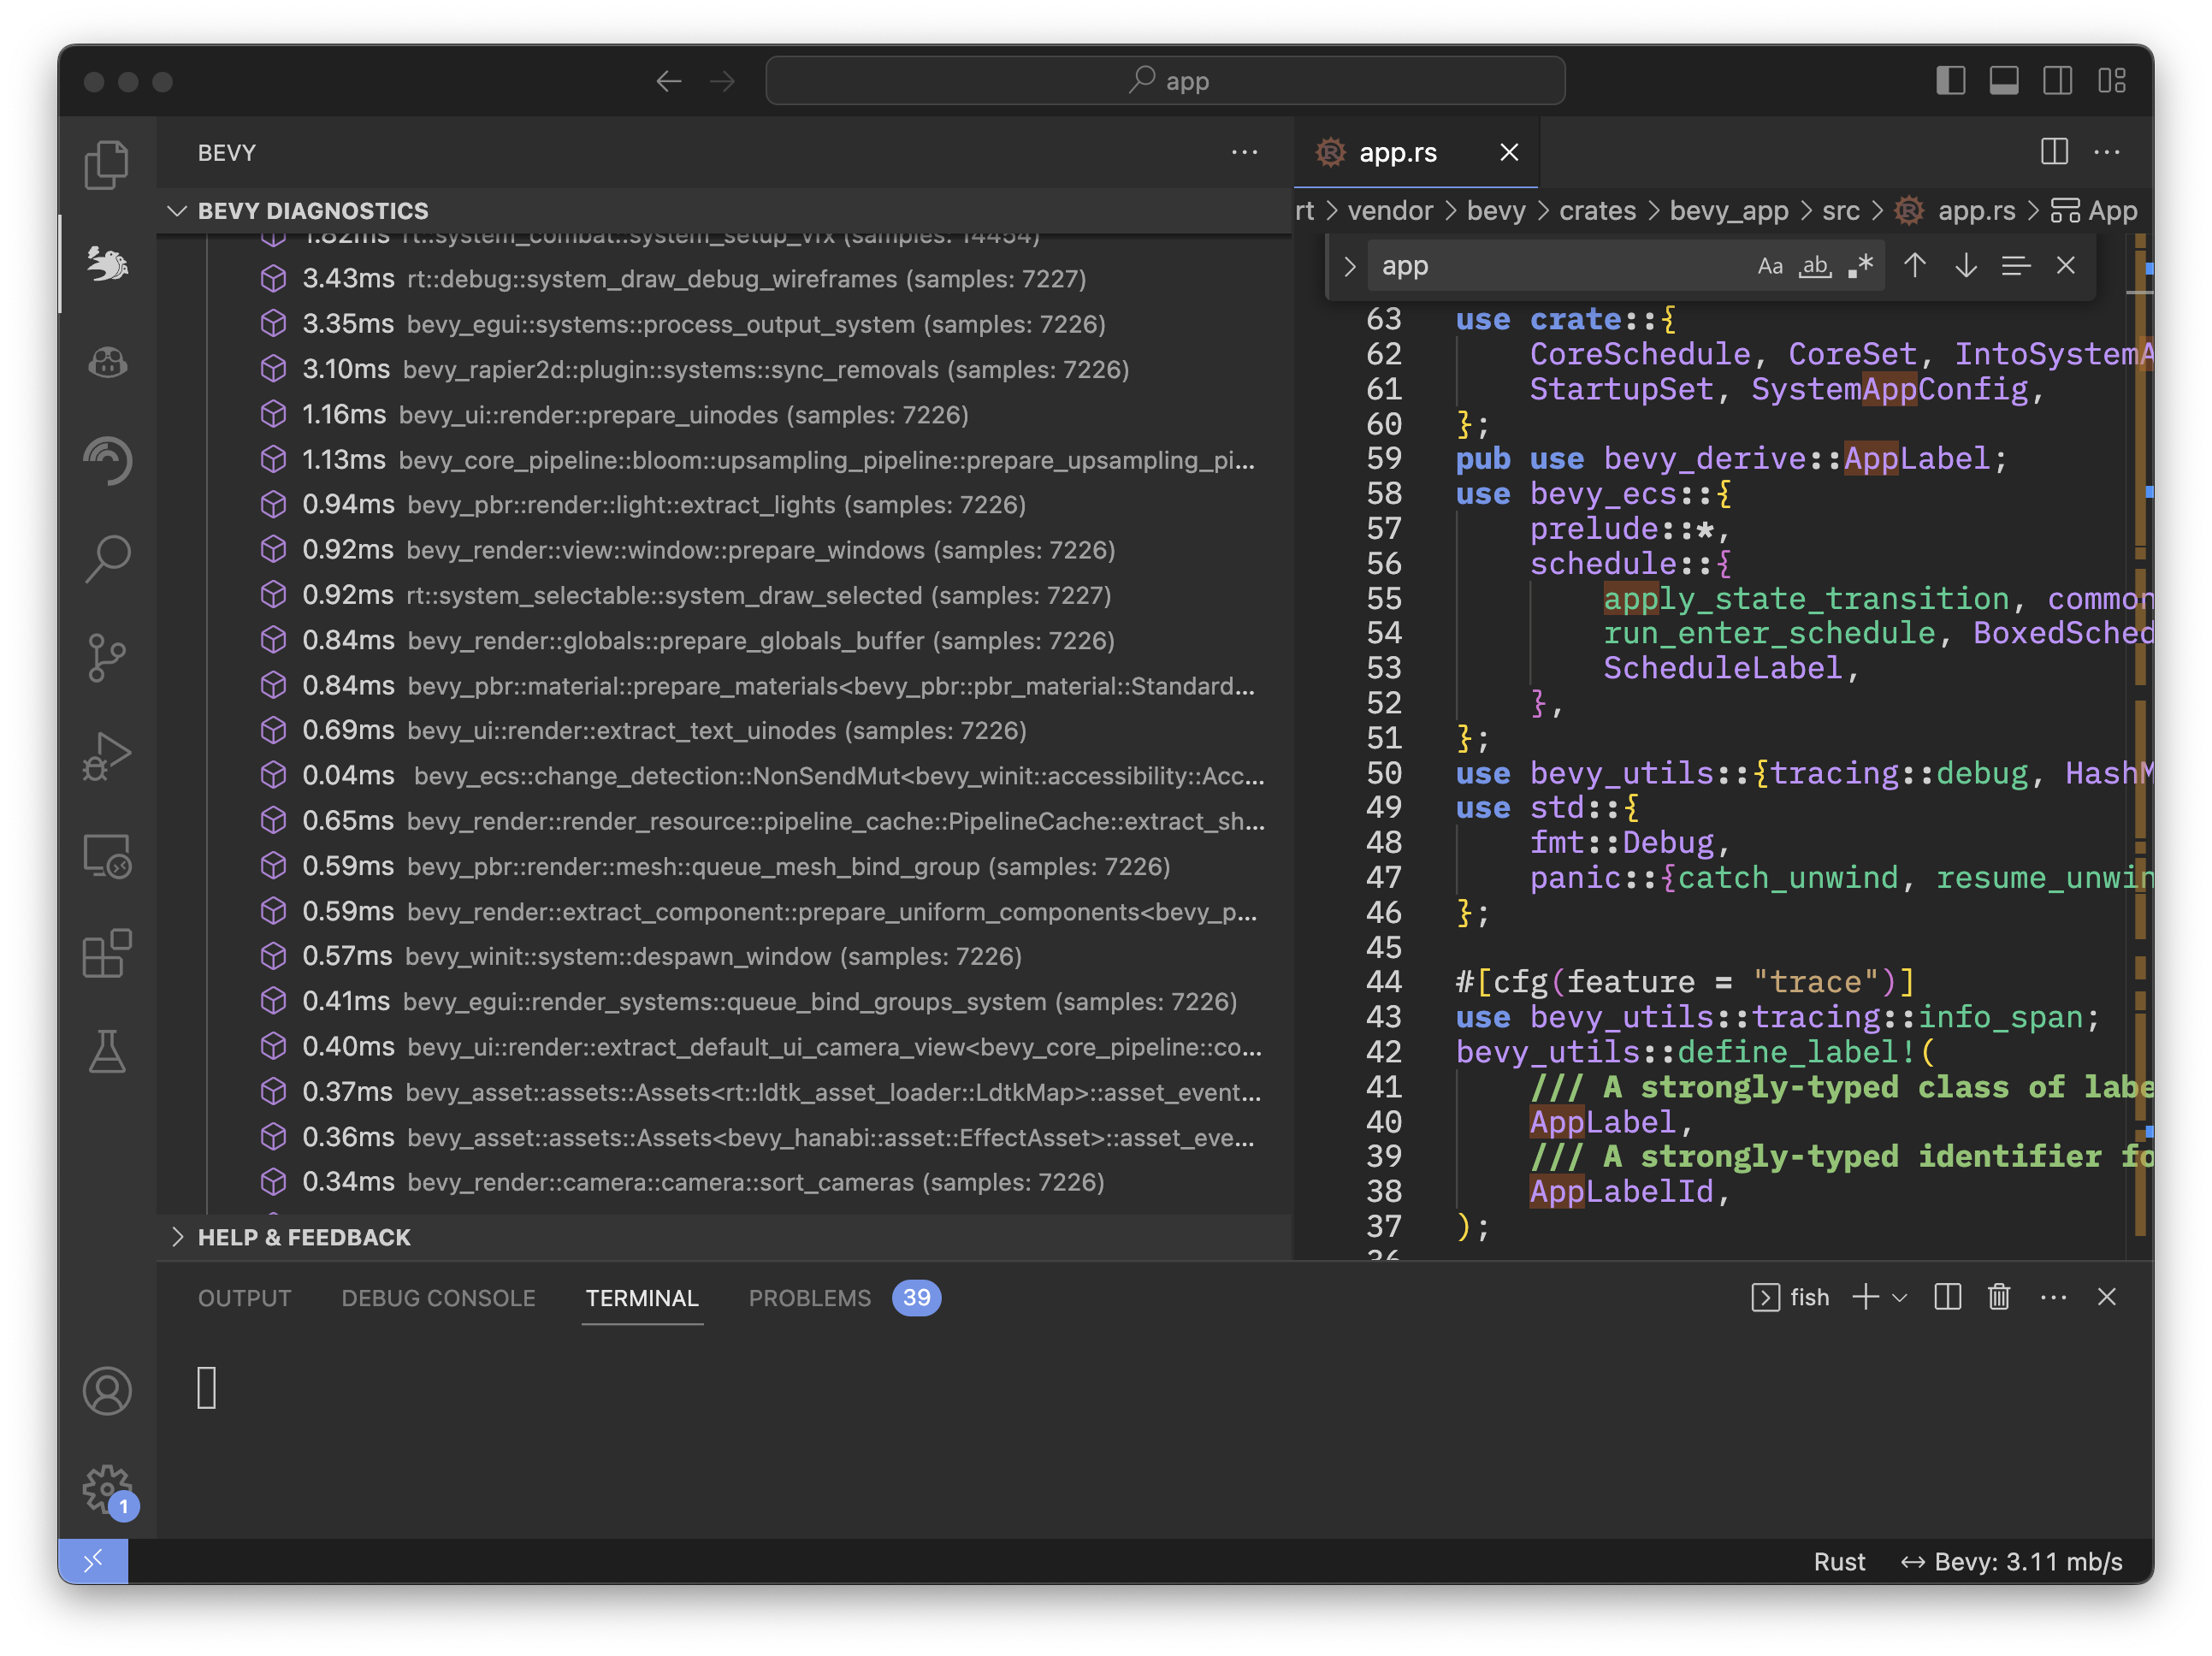
  • Lastly, the VScode extension performs a consolidation of all spans. It uses the scope/name key for this purpose, and it displays average durations calculated over an entire observed time period.

References

  • Corresponding agent: https://crates.io/crates/bevy_diagnostics_explorer
  • Source code: https://github.com/zaycev/bevy-diagnostics-explorer
  • Contact us
  • Jobs
  • Privacy
  • Manage cookies
  • Terms of use
  • Trademarks
© 2025 Microsoft