Script Progress — Data Ops Dashboard




Did it run, what did it find, and is the trend getting better or worse? One dashboard for
every recurring job. Five lines in a Python or Node script give you a live progress card, a status
bar line, and a run history that flags runs which took far longer than usual — or whose numbers
moved further than they should have. Add one call per resource and you get a map of every table,
file and service your scripts touch, with lineage.
from progress import Progress

with Progress("Nightly Load") as p:
    p.step(1, 2, "Reading input")
    p.step(2, 2, "Loading warehouse")
    p.complete(success=True, summary="INSERT: 3,990 rows")
That is the whole integration. No server to run, no package to install, no account.
- Nothing to host. Your script writes a few small JSON files; the extension watches the folder.
- Nothing leaves the machine. No network, no telemetry, no AI, no runtime dependencies.
- Everything is a switch. Fifteen sections; turn on the ones you want, in the order you want.
- Built for people who babysit pipelines. Slow-run and metric-regression detection, SLA
compliance over months, warning trends, outstanding findings, and lineage so "what breaks if
this fails?" has an answer.
Is this for you?
If your jobs run on Airflow, Dagster or Prefect, you already have a UI and you do not need this.
This is for the other half of the work: the load script you run from a terminal, the
reconciliation you kick off by hand, the scheduled task on one machine, the notebook-turned-script
that takes forty minutes. Those jobs have no UI at all, and the usual answer is watching a terminal
scroll or opening the log file afterwards to find out it failed on step 2 of 7.
Any language works. The JSON files are the contract and the schemas are documented below; the
Python and Node reporters are just the two that ship.
The views
There are fifteen sections, and you start with nine of them on. That set has a name —
Operations — so you always know where you are:
| Layout |
Sections |
What you get |
| Essentials |
7 |
What is running and what happened: the summary strip, Active Task, Pending Actions, Warnings, Last Completed, Run History and the Run Timeline. |
| Operations ← this is the default |
9 |
Everything in Essentials, plus Process Calendar (did each expected job run in its period?) and Script Health (is anything stale or failing?). |
| Everything |
15 |
Everything in Operations, plus Quick Actions, Delta Tracker, Metrics Explorer, Warning Trends, Impact Summary and the Access Map. |
Each is a superset of the one above it. Switch with Script Progress: Choose a Layout…, which
ticks the one you are currently on. Two of the fifteen need a little configuration before they
show anything — Process Calendar wants your list of expected processes, Quick Actions
wants your buttons — and both say so in place rather than sitting blank.
You are never limited to the three: Choose Dashboard Sections… toggles any section
individually, and every one can be reordered, collapsed, and shown or hidden independently in the
sidebar and the editor tab.
Before any script has reported, none of this appears — you get a single panel offering a demo
run, the getting-started walkthrough, or the layout picker.
On by default
| Section |
What it shows |
| Summary strip |
The numbers worth seeing before anything else, as tiles: coverage, runs today, failures today, warnings today, what is next due, stale scripts, metrics outside their thresholds, the dominant failure category, and the last run's result and duration. Narrow sidebars show the first five. |
| Active Task |
One card per currently running script: the step counter and progress bar, the live elapsed time ticking every second, an ETA from previous runs of the same task, the last few log lines, metric cards as they are recorded, and links to the files it has produced. Sub-step progress fills the bar within a long step. |
| Pending Actions |
Findings your scripts marked as needing a person — p.warn("…", actionable=True) — grouped by script, with the count and category each carries. Taken from every script's most recent successful run, so an item clears itself when a later successful run stops reporting it, and a failed run never clears one. |
| Warnings |
Everything the running script has warned about this run, newest first, with timestamps. Hides itself entirely when there is nothing to say. |
| Last Completed |
The most recent finished run: pass or fail, duration, warning count, its summary line, and its metrics as cards. |
| Run History |
A table of recent runs — status, task, date, duration, warnings, summary. Filter by text or by chips (OK / failed / with warnings / slow), sort any column, and expand a row for its metrics with the change since the previous run, its warnings in full, the resources it touched, its artifacts, who ran it and from which commit. Flags runs that were unusually slow or over their SLA, and metrics that landed far from their own history. Every row offers Compare with…. |
| Run Timeline |
Swim lanes per script over the last day (or week), showing when each run happened, how long it took and what overlapped with what. |
| Script Health |
One row per script: when it last ran, a dot per recent result, its failure rate, its duration trend, and whether it has gone stale against the freshness you expect. Needs no configuration — it reads run history. |
| Process Calendar |
The daily, weekly and monthly processes you expect, and whether each has actually run in its period. Per row: a status mark, a plain-English note, a dot per recent period with a compliance percentage (ran in 11 of the last 12), when it is next due, and a month grid of every run. Understands phases (2 of 3 phases until all are done), dependencies (blocked — waiting on Upstream Extract), processes that have never reported (not wired yet, never "overdue"), and reminders a set number of days before a due date. Empty until you list your processes in settings. |
Switch on as you need them
| Section |
What it shows |
| Quick Actions |
Buttons that run your scripts, grouped however you like, in a reusable terminal or as VS Code tasks. Each shows its task's last result, disables itself while that task is running, can require confirmation, can ask for a value before running (${prompt:Month}), and can disable itself with a reason when the last run says it is not needed. |
| Delta Tracker |
A sparkline per tracked metric with its current value, min, max, change and trend. Draws your acceptable range as guide lines and a separate target line, flags values outside the range, and when one run measured the same thing twice it reads found 4.2K, resolved to 0. |
| Metrics Explorer |
Every metric each script reports, run by run: a table with a sparkline per numeric metric, the change against the previous run, and a total and mean across the runs in view — so a per-run cost or row count reads as a period figure. |
| Warning Trends |
Which warnings keep coming back, on which scripts, and whether they are rising or falling over the window. Groups by the category your script gave the warning when it gave one, otherwise by wording, so "310 issues" and "311 issues" count as the same recurring finding. |
| Impact Summary |
Running totals of what your scripts have contributed via Progress.impact() — overall, this month, and how many runs are behind each figure. |
| Access Map |
A constellation of your scripts and the files, tables and services they touch, drawn from p.access() calls. Write edges stand out from reads; click any node for its lineage — what feeds it, and which scripts break if it fails. Force or radial layout, search, filter by type, a minimap, replay of the last run, and PNG export. Shows only what scripts declared, so treat it as a floor rather than a complete picture. |
And, from any surface, Export HTML Report writes a self-contained page of the whole dashboard
— sections, tables and a static map — to attach to a ticket or send to whoever asked "did it run?".
Plus a status bar item (scriptProgress.statusBar.enabled) and an Activity Bar badge
(scriptProgress.badge).
The dashboard lives in two places: the Script Progress icon in the Activity Bar (a narrow
sidebar view that stays open while you work) and Script Progress: Open Dashboard, a full
editor tab — which is where the Access Map is drawn at size.
Screenshots
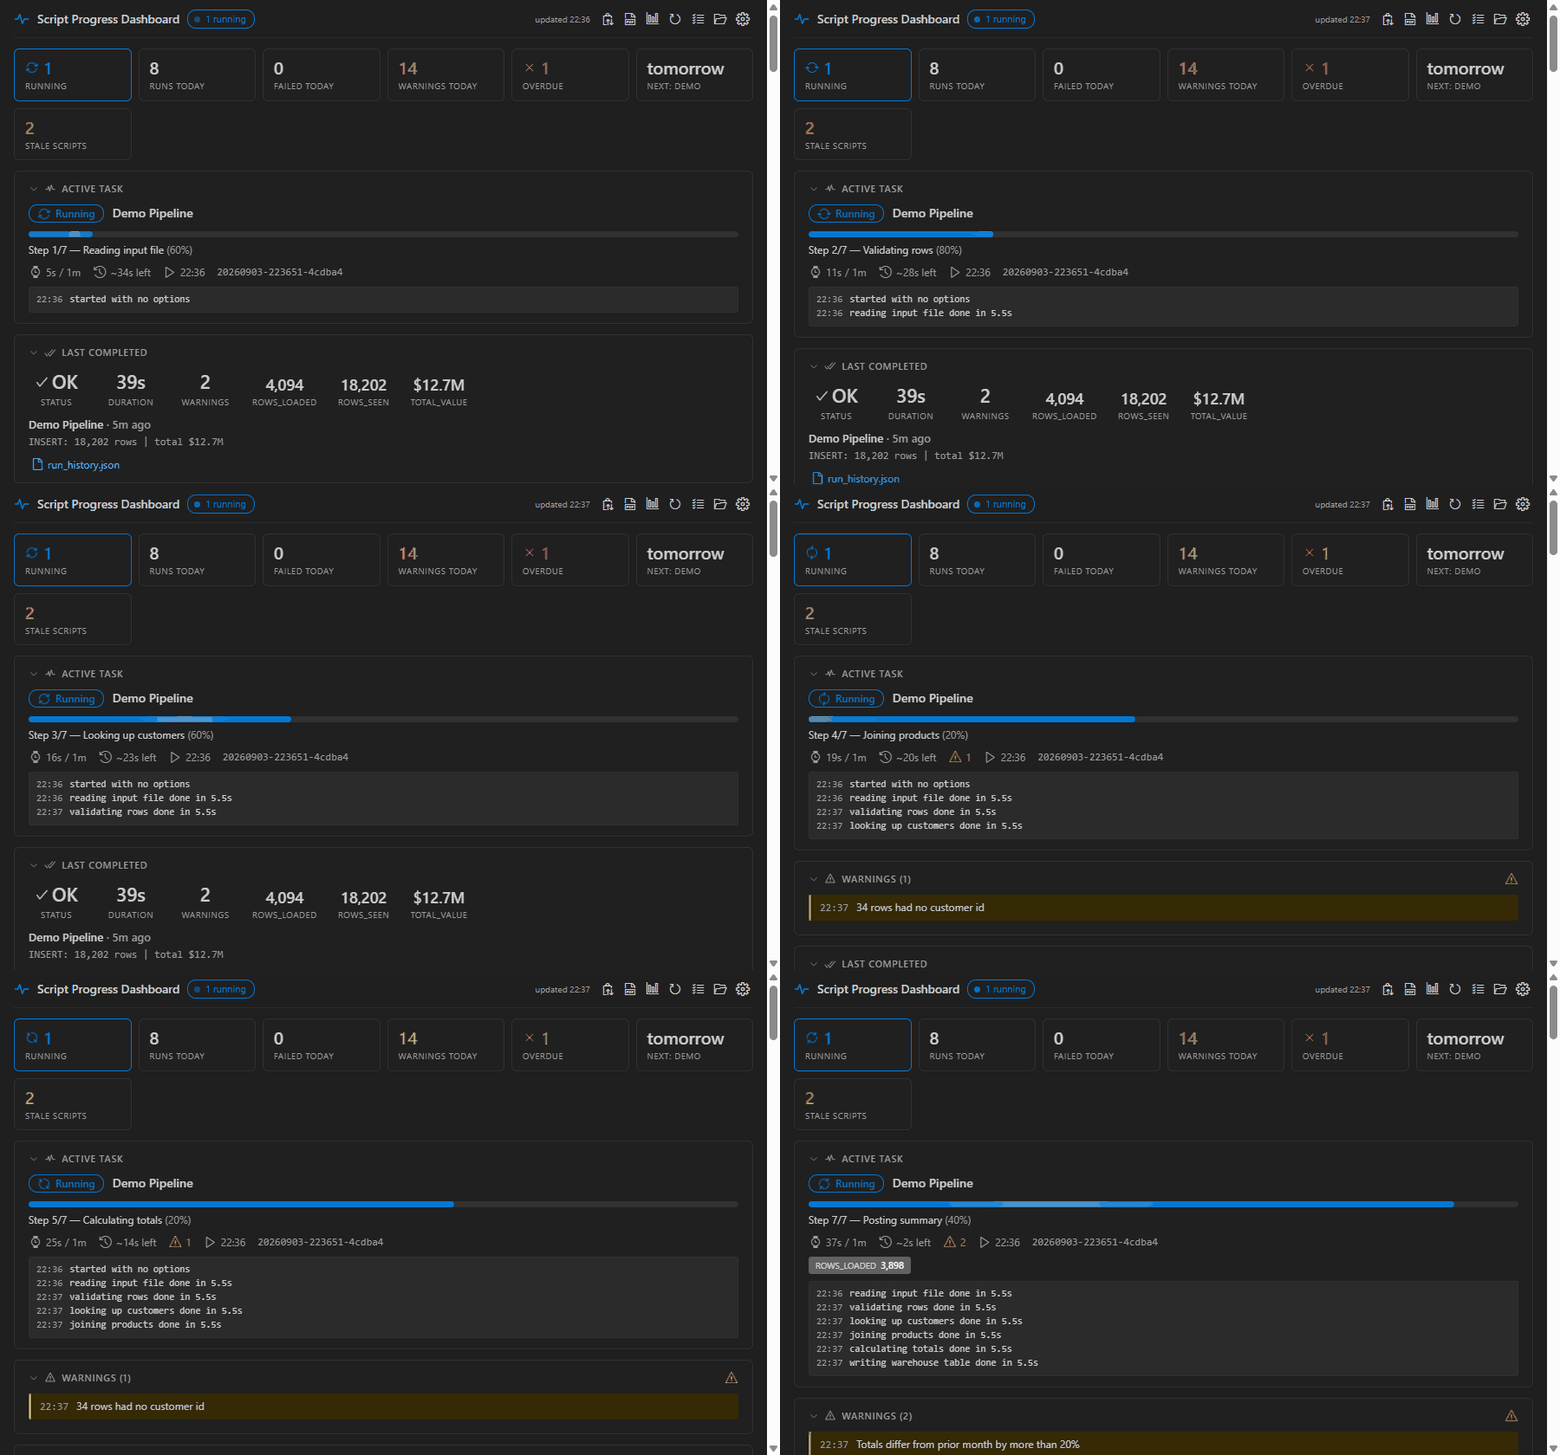
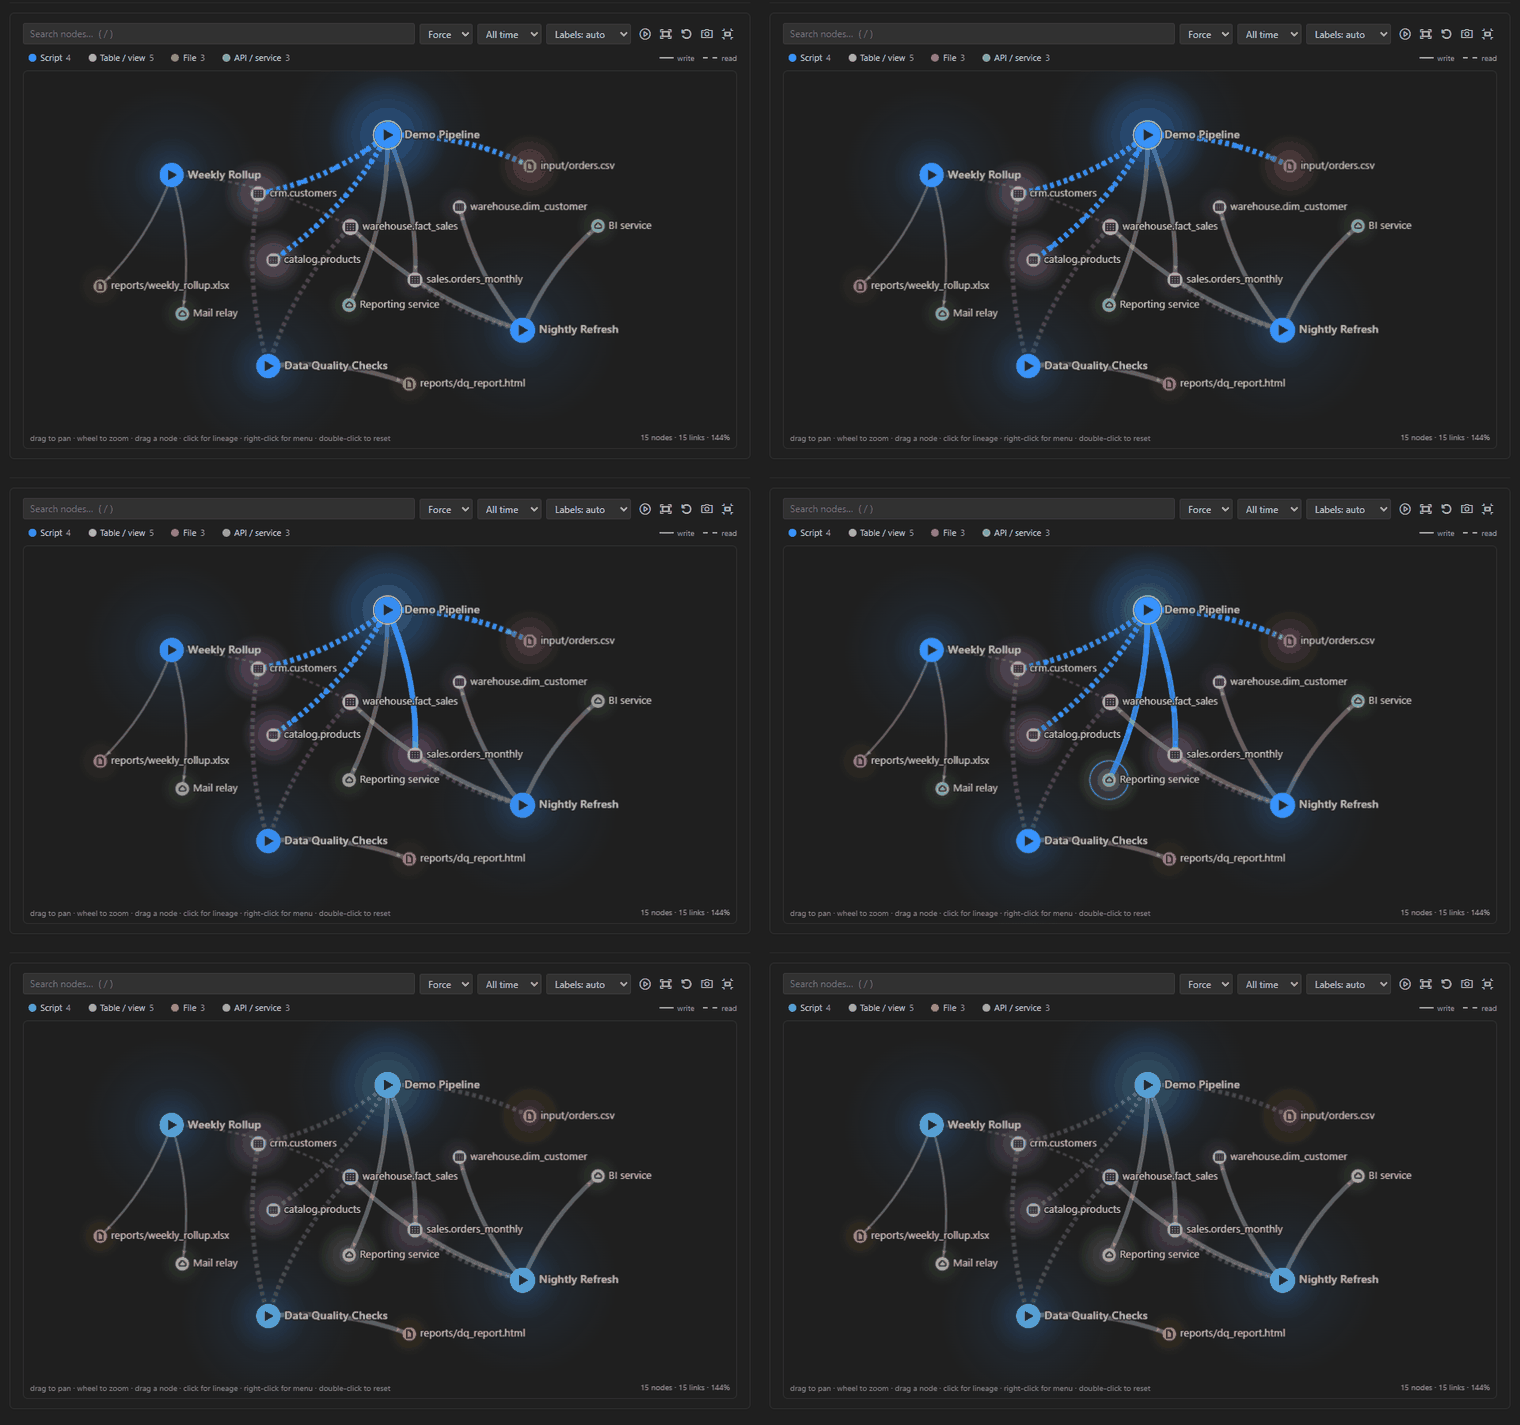
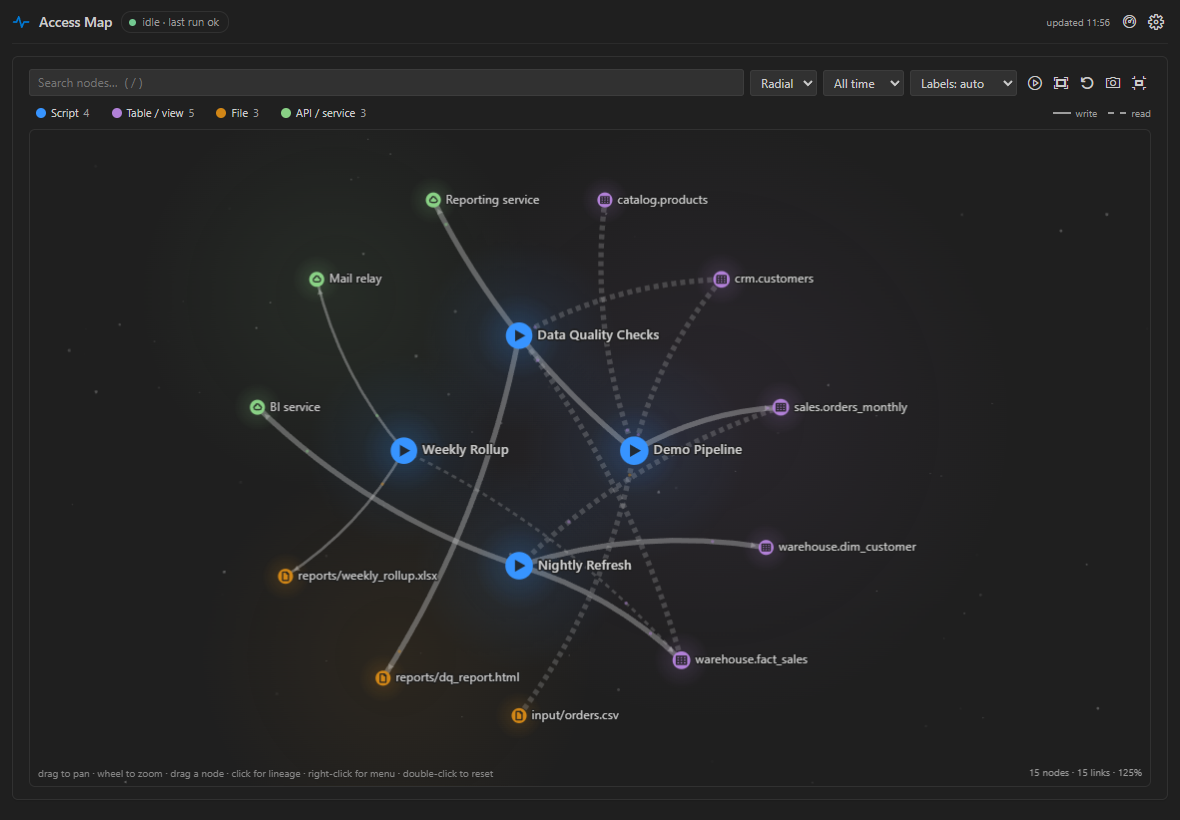
The Access Map moves only when something is running. A script's node lights up and traffic
flows along the tables and files it is using; when it finishes, the map is still.
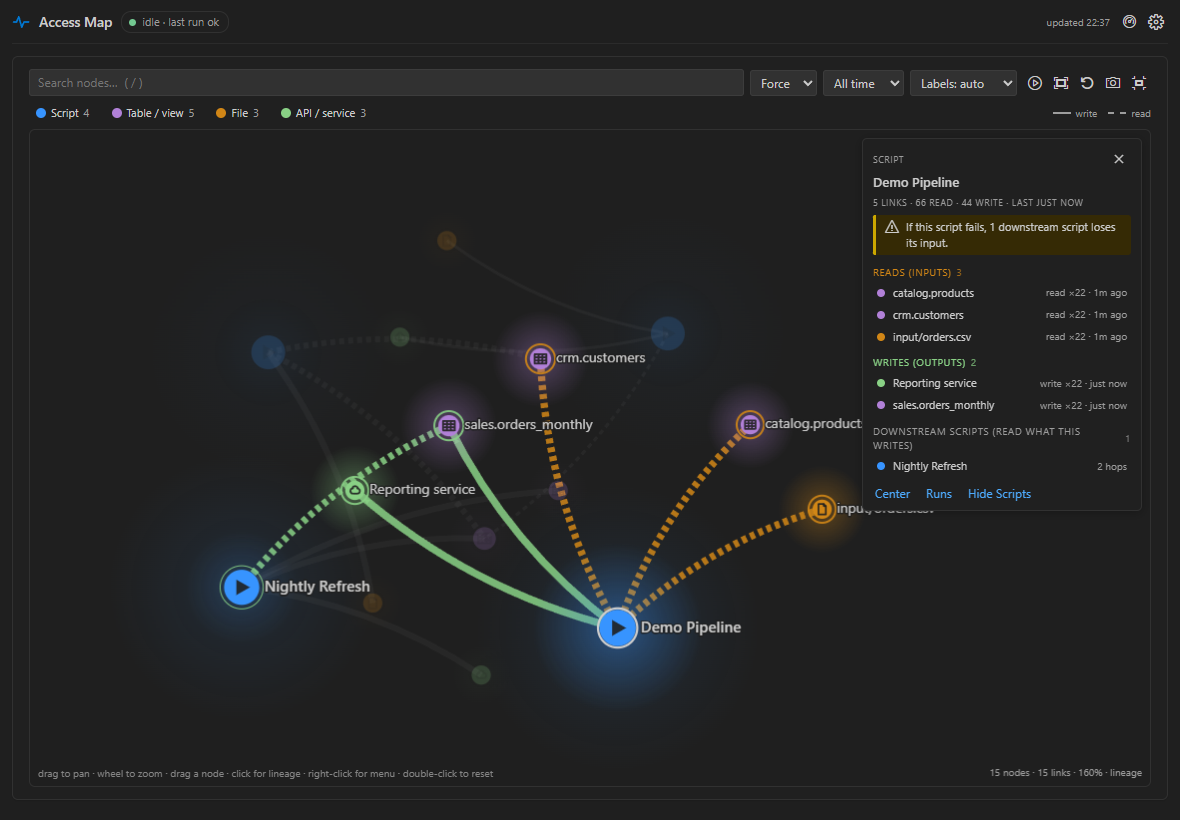
Click any node for its lineage. Inputs light orange, outputs green, and the card names the
downstream scripts that break if this one does.
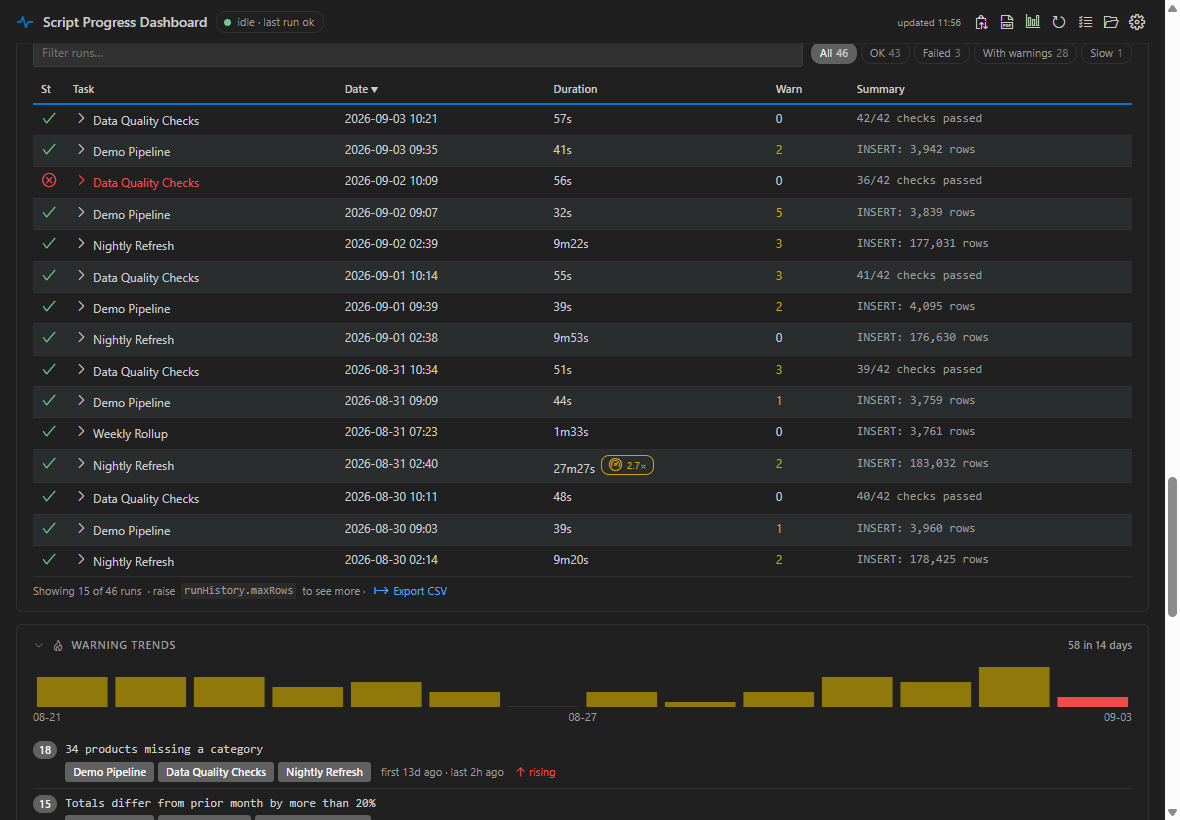
Run History flags the runs worth looking at. A run at 2.7 times its usual duration gets a
slow flag and a filter chip; Warning Trends groups warnings by message, so "17 rows had no
customer id" and "29 rows had no customer id" count as one recurring problem.
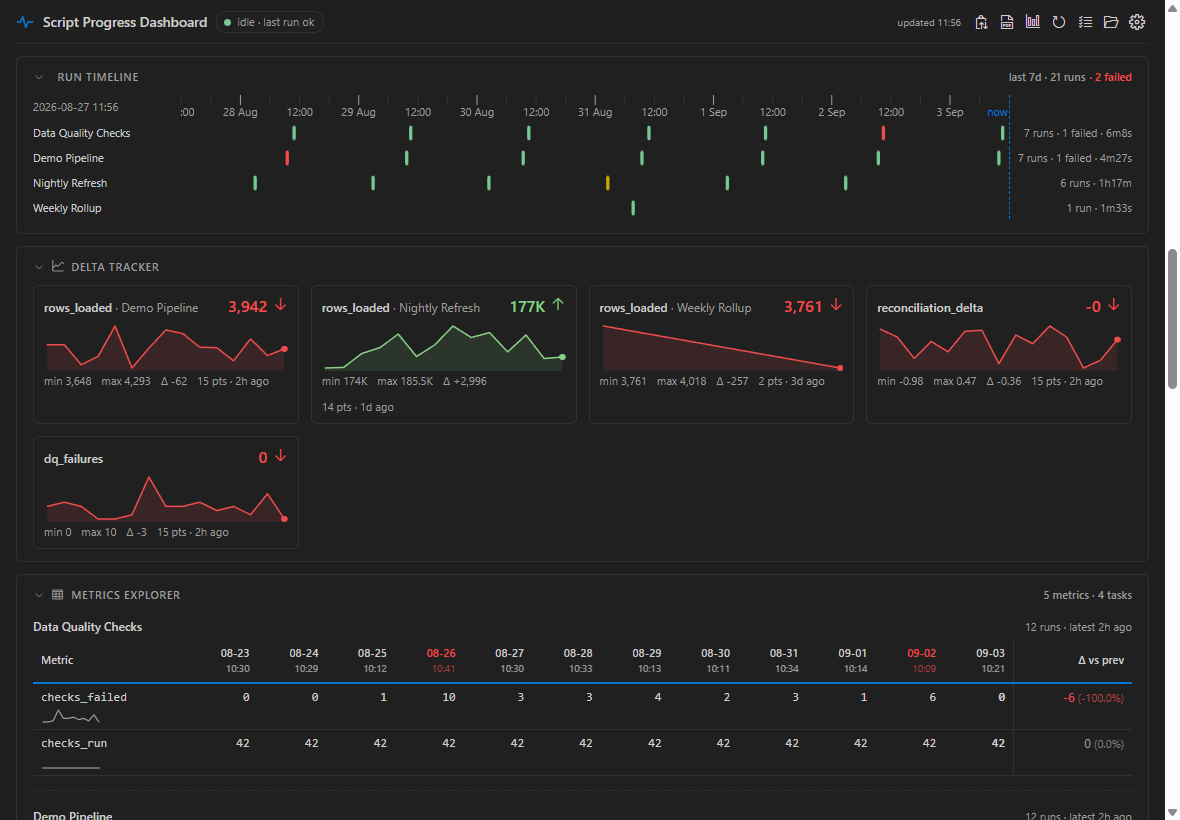
Every script on one timeline, every metric run over run. Swim lanes show what ran, how long
it took and what overlapped; the Metrics Explorer shows the change against the previous run.
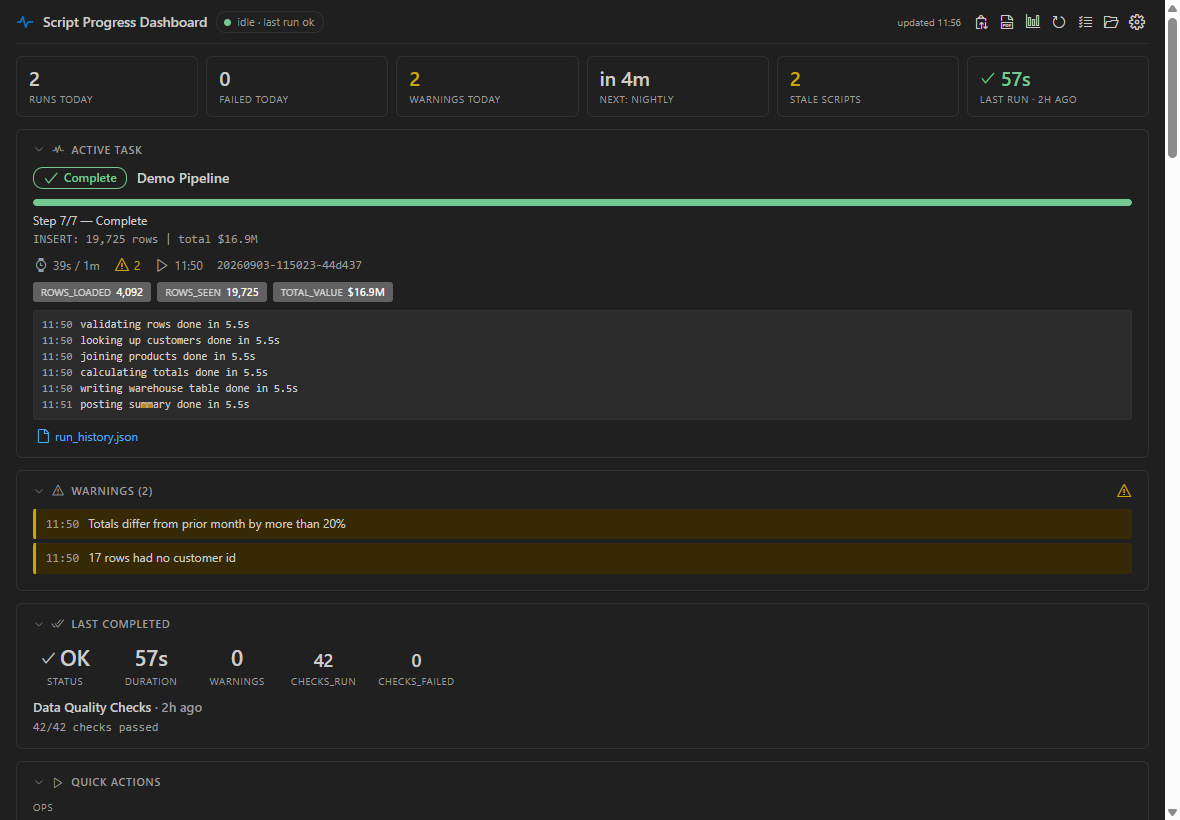
The dashboard tab. Summary strip, the Active Task card with its log tail and metric chips,
warnings, and the last completed run.
Radial layout puts scripts on an inner ring and their tables, files and services outside.
See it working in 30 seconds
Install it, open the Command Palette and run Script Progress: Simulate a Demo Run. It writes
the same files a real script writes, so the status bar, the sidebar and the dashboard fill in
front of you. Nothing to configure, no Python needed.
For the full story, the demo/ folder in the repository is a ready-made workspace with every
section switched on and two weeks of seeded history:
python seed_demo.py                    # two weeks of realistic runs for every section
python fake_run.py --fast              # the whole story in about six seconds
python fake_run.py --fail              # ends in a failure
python fake_run.py --crash             # raises mid-run; the 'with' block reports FAILED
python fake_run.py --stall             # exits without reporting, so it shows as STALLED
Install
Search Script Progress Dashboard in the Extensions view, or:
code --install-extension trevor-marshall.script-progress-dashboard
Air-gapped or offline machine? The .vsix route and an unpacked-folder route are documented in
install/README.md.
If the install does not go smoothly, these three came out of a real corporate install:
code --install-extension <id> reports "Extension not found" but the Extensions view works.
The CLI and the UI take different network paths, and a proxy can block one and not the other.
Use the view, or fall back to the .vsix.code --list-extensions shows almost nothing when run from inside another tool's terminal.
Check the folder instead: ls ~/.vscode/extensions/trevor-marshall.script-progress-dashboard-*.- A section stays empty although the settings look right. If your window was opened from a
.code-workspace file, settings in a folder's .vscode/settings.json are folder scope and
are not read — they have to live in the workspace file's "settings" block. The extension now
detects this and says so, but that is the thing to check first. And if VS Code refuses to save
any setting at all ("unable to write"), the target file usually has a JSON syntax error: check
the Problems panel before anything else.
Where your scripts run
The extension watches a folder. Your scripts must be able to write to a folder this VS Code window
can read, which means one of:
- The same machine — the ordinary case.
- A mounted or synced share. Works, with a caveat: on a sync-backed folder (OneDrive, Dropbox)
the sync client can briefly lock a file mid-write. The reporter retries and degrades to a printed
note rather than failing your job, but very chatty scripts will occasionally skip an update.
- A remote box, via Remote-SSH or Dev Containers — because then the editor is on the server
and the folder is local to it.
It does not work for a job running on a server with no shared path to your editor. There is no
agent and no network listener; "nothing to host" means there is nothing to install, not that it can
reach across machines.
Report progress
Python
Copy python/progress.py into your project — scripts/lib/progress.py is a good home. It needs
nothing outside the standard library (Python 3.10+).
from lib.progress import Progress

with Progress("Nightly Load") as p:              # 'with' reports a crash as FAILED
    p.step(1, 3, "Reading input file")
    p.access("file", "input/orders.csv")         # feeds the Access Map
    p.detail("Rows: 3,990")
    p.log("first row looks sane")

    p.step(2, 3, "Loading warehouse table")
    for i, chunk in enumerate(chunks):
        p.substep(i / len(chunks))               # progress within the step
    p.access("table", "sales.orders", mode="write")
    p.warn("12 rows had no customer id")
    p.metric("rows_loaded", 3990)
    p.artifact("output/load_report.xlsx")

    p.step(3, 3, "Reconciling")
    p.track_delta("reconciliation_delta", 0.0)   # feeds the Delta Tracker
    p.complete(success=True, summary="INSERT: 3,990 rows")
| Call |
Does |
Progress(task_name, logs_dir=None, quiet=False) |
Starts a run and writes the first file. quiet=True stops it printing. |
step(step_num, total_steps, label) |
Moves to a new step and resets the detail line. |
detail(text) |
Updates the line under the step label — row counts, file names. |
substep(fraction) |
Progress within the current step, 0.0–1.0. Only writes when it moves 1%, so tight loops are cheap. |
log(message) |
Adds a line to the dashboard's live log tail (last 20 kept). |
warn(message) |
Records a warning; shown live and counted in run history. |
metric(name, value) |
Records a named number or short string for this run. |
artifact(path) |
Records a file the run produced; shown as a clickable link. |
track_delta(metric_name, value) |
Appends one point to a Delta Tracker series (last 50 kept per metric). |
access(kind, name, mode="read") |
Records a touched resource for the Access Map. kind is file, table, api or other; mode is read or write. |
complete(success=True, summary="", metrics=None) |
Ends the run and appends a run history row. Called for you by the with block. |
The import path follows where you put the file. From scripts/lib/progress.py, run your script
from scripts/ and use from lib.progress import Progress; drop it next to your script instead
and it is just from progress import Progress.
Every call prints as well as writing, so the terminal tells the same story as the dashboard.
The decorator form wraps a whole function; the reporter arrives as its first argument:
@Progress.wrap("Nightly Load")
def main(p):
    p.step(1, 1, "Working")
    p.complete(success=True, summary="done")
Where it writes. The reporter picks its logs folder in this order:
- the
logs_dir argument,
- the
PROGRESS_LOGS_DIR environment variable,
- the nearest parent folder of
progress.py that contains a logs/ or .git/ folder, plus
/logs (so scripts/lib/progress.py writes to <project>/logs/),
./logs under the current working directory.
Point scriptProgress.logsPath at the same folder.
Run the reporter on its own to print the current state in a terminal:
python progress.py                 # reads the folder it would write to
python progress.py /path/to/logs   # or an explicit one
Warnings that can be grouped
A warning can carry more than its text, and all of it is optional:
p.warn("Section 6 discontinuities", count=310, category="cross-quarter", severity="info")
p.warn("Two records missing an owner flag", count=2, category="missing-flag", actionable=True)
count — so a steady 310 reads as steady instead of as a new warning every run.category — your own word for the kind of finding. Warning Trends groups by it when present,
which is the difference between "cross-quarter has been flat for three weeks" and a list of
near-identical sentences.severity — info, warn or error. Your judgement; nothing here infers it.actionable — this is something a person must do, not merely know. Those appear in
Pending Actions and stay there until a later successful run stops reporting them.
What a run contributed
track_delta records where a number stands now. impact records what a run added, and those
accumulate:
p.impact("corrections_found", 1204.50, label="Reconciliation corrections")
The Impact Summary then shows the running total, the figure for this month, and how many runs it
came from.
Be precise about what the number counts, and write that definition down next to the script.
A total is only as defensible as its definition, and "identified" is the word that gets
questioned first — a discrepancy that passed through a check is not money recovered. The figure
is what your scripts reported, using their own rules.
Naming a failure
When a run fails for a reason you can name, say so:
p.fail("token expired", category="auth") # or p.complete(success=False, category="auth")
The category is free text you choose — auth, quota, missing-input, validation. Nothing
interprets it; the dashboard groups by it, so a repeated cause reads as 3 of the last 5 failures
were auth in the summary strip instead of five separate stack traces. Keep the words short and
stable or the grouping is worthless. An unhandled exception is categorised by its type
automatically.
Anything else: the command line
Plenty of real work is not a Python script — a shell script, a scheduled task, a Makefile, an
agent workflow. Every reporting call has a command-line form, so any of them can appear on the
dashboard. One run spans many processes; the run lives in its file between calls.
python progress.py start    "Nightly Load" --total 3
python progress.py step     "Nightly Load" 1 3 "Reading input"
python progress.py access   "Nightly Load" table sales.orders --mode write --detail "5 rows"
python progress.py warn     "Nightly Load" "12 rows had no customer id"
python progress.py metric   "Nightly Load" rows_loaded 3990
python progress.py complete "Nightly Load" --summary "INSERT: 3,990 rows"
python progress.py complete "Nightly Load" --fail --summary "source file missing"
Also detail, substep, log, artifact, delta, and status. Set PROGRESS_TASK once and
the name can be left off the rest; --logs DIR (or PROGRESS_LOGS_DIR) picks the logs folder.
Exit codes: 0 fine, 1 a usage error, 2 there was no run to attach to. complete on a run
that is already finished is a no-op, so a shell trap can call it unconditionally:
trap 'python progress.py complete "Nightly Load" --fail --summary "aborted"' EXIT
Two runs sharing a task name. A run is identified by its name, so a second start under the
same name takes over. If that can happen — two agents both running Morning Scan — capture the
id and pass it back, and a displaced call fails loudly instead of writing its steps into the
other run:
RUN=$(python progress.py start "Morning Scan" --print-id)
python progress.py step --run "$RUN" 1 2 "Scanning"
python progress.py complete --run "$RUN" --summary "3 items"
Better still, give concurrent runs distinct names. The task name is the key for the calendar,
history and ETA, so two things sharing one are indistinguishable everywhere, not just here.
Who ran it, and from which commit
Each run records the OS username and the short git commit of the folder it ran from, so history
reads "X ran it at 10:08" and a change in behaviour can be lined up against a change in code.
Both are best-effort and never interrupt a run.
Opt out with PROGRESS_NO_USER=1 and PROGRESS_NO_GIT=1, or set PROGRESS_USER to something
else. ⚠️ The username is a personal identifier. It is stored in run_history.json and, unless you
turn it off below, in the HTML report — so it reaches anyone you send that to. It is
not in the CSV export, and not in the formatted digest. It is also in progress.json and
progress/<task>.json while the run is live. scriptProgress.report.includeIdentity
(off by default) controls whether it appears in the exported HTML report; the environment variables
control whether it is recorded at all.
Comparing two runs
Expand a row in Run History and click Compare with…, or run Script Progress: Compare Two
Runs…. The previous run of the same task is offered first. You get a Markdown document: every
metric with its change, warnings split into new / gone / still there, the duration difference,
whether the outcome flipped, and which resources one run touched and the other did not.
It never silently reorders your choice — comparing backwards in time is allowed and says so at
the top, as does comparing two different scripts.
Node
reporters/progress.js covers the core contract with no dependencies (CommonJS).
⚠️ It is not yet at parity with the Python reporter. impact(), failure category, and the
structured warn() fields (count, category, severity, actionable) are Python-only for now,
so a Node script cannot populate Pending Actions, the Impact Summary or failure patterns. The JSON
files are the contract, so a Node script can write those fields itself in the meantime. The methods match
the Python ones, camelCased: step, detail, substep, log, warn, metric, artifact,
trackDelta, access, complete.
const { Progress } = require('./progress');

await Progress.run('Nightly Export', async (p) => {   // a throw is reported as FAILED, then re-thrown
  p.step(1, 2, 'Reading');
  p.access('file', 'input/orders.csv');
  p.detail('412 rows');
  p.step(2, 2, 'Writing');
  p.metric('rows', 412);
  p.trackDelta('rows', 412);
  p.complete(true, 'wrote export.csv');
});
Without Progress.run, construct it directly: new Progress(taskName, logsDir, { quiet }). The
logs folder is resolved by the same four rules, with PROGRESS_LOGS_DIR honored identically.
Any other language works too — the files are the contract, and the JSON schemas below describe
them exactly.
Runbook generation
Generate Runbook writes a Markdown document from what the extension has actually observed: each
process, its cadence, its phases in order, the command behind each step, how long each usually
takes, what it reads and writes, and what it produces.
It marks its own blind spots, and you must fill them in. It cannot see a step performed by a
person — an approval, a file sent out and returned — so it flags a gap before, between and after
every step, and opens with a DRAFT banner until you delete it. Steps it has never seen run say so.
Sending a digest
Copy Weekly Digest gives plain text. Copy Digest for Email (formatted) gives the same
content with formatting, ready to paste into an email.
Formatted copy is Windows-only: VS Code's clipboard API writes plain text, so the extension sets
the CF_HTML clipboard format through PowerShell. Where that is unavailable or blocked, it writes
the digest to an HTML file and offers to open it so you can copy it from the rendered page. A
plain-text flavour is always set alongside, so the worst case is a clean plain-text paste.
Templates
Type a prefix in a Python file and press Tab:
| Prefix |
What it starts |
progress |
A job wrapped in a Progress block |
prog-query |
A query/extract: table read, rows returned, empty result flagged |
prog-load |
A write/load: named failure category, what it wrote, verification |
prog-recon |
A reconciliation: measures the gap before and after the fix |
prog-etl |
File in, file out, with both recorded and sub-step progress |
prog-cli |
A shell script using the command line, with an abort trap |
prog-cli is available in shell and PowerShell files; the rest in Python, with the core four also
in JavaScript.
The files
Everything lives in the folder named by scriptProgress.logsPath.
| File |
Written by |
Holds |
progress.json |
every reporting call |
The most recent write from any task: task, status (running/complete/failed), step, totalSteps, label, detail, elapsed, eta, warnings[], updatedAt, plus runId, startedAt, substep, metrics, log[], artifacts[], accessed[] |
progress/<slug>.json |
every reporting call |
The same shape, one file per task, so concurrent scripts each get their own Active Task card. The slug comes from the task name; finished slots are pruned after two days |
run_history.json |
complete() |
An array of the last 100 runs: task, date, success, elapsed, summary, warnings, plus runId, startedAt, metrics, warningItems[], accessed[], artifacts[] |
deltas.json |
track_delta() |
{ "metric_name": [ { "date", "value", "task" }, … ] }, last 50 points per metric |
access.json |
access() |
{ "nodes": [ { "id", "type", "label", "lastSeen" } ], "edges": [ { "from", "to", "mode", "count", "lastSeen" } ] }, up to 150 nodes |
Writes are atomic — temp file, then rename — so the extension never reads a half-written file.
If it ever does see bad JSON it keeps the last good copy and says so at the top of the dashboard.
The extension contributes a JSON schema for each file, so editing one of them in VS Code gives
you completion and hover documentation for every field.
A worked example, in workspace or user settings.json (every setting is described in the Settings UI):
{
  "scriptProgress.logsPath": "logs",
  "scriptProgress.refreshInterval": 2000,
  "scriptProgress.staleRunningMinutes": 30,

  "scriptProgress.sections.summary": true,
  "scriptProgress.sections.activeTask": true,
  "scriptProgress.sections.warnings": true,
  "scriptProgress.sections.lastCompleted": true,
  "scriptProgress.sections.runHistory": true,
  "scriptProgress.sections.timeline": true,
  "scriptProgress.sections.processCalendar": true,
  "scriptProgress.sections.quickActions": true,
  "scriptProgress.sections.deltaTracker": true,
  "scriptProgress.sections.metrics": true,
  "scriptProgress.sections.warningTrends": true,
  "scriptProgress.sections.scriptHealth": true,
  "scriptProgress.sections.accessMap": true,

  "scriptProgress.dashboard.sidebarSections": ["summary", "activeTask", "warnings"],
  "scriptProgress.dashboard.collapsible": true,
  "scriptProgress.dashboard.density": "comfortable",

  "scriptProgress.activeTask.showLog": true,
  "scriptProgress.activeTask.logLines": 6,
  "scriptProgress.runHistory.maxRows": 15,
  "scriptProgress.runHistory.anomalies": true,
  "scriptProgress.runHistory.anomalyFactor": 2,
  "scriptProgress.timeline.windowHours": 24,
  "scriptProgress.metricsExplorer.maxRuns": 12,
  "scriptProgress.warningTrends.days": 14,

  "scriptProgress.processCalendar.processes": [
    { "name": "Nightly Load", "label": "Nightly Load", "frequency": "daily", "dueHour": 9, "maxMinutes": 45 },
    { "name": "Weekly Rollup", "label": "Weekly Rollup", "frequency": "weekly", "dayOfWeek": 5 },
    { "name": "Month-End Close", "label": "Month-End Close", "frequency": "monthly", "dayOfMonth": 5 }
  ],
  "scriptProgress.processCalendar.view": "both",

  "scriptProgress.quickActions.buttons": [
    { "label": "Nightly Load", "command": "python scripts/nightly_load.py",
      "icon": "play", "group": "Daily", "task": "Nightly Load" },
    { "label": "Month-End Close",
      "command": "python scripts/month_end.py --month ${prompt:Month (YYMM)}",
      "icon": "calendar", "group": "Monthly", "confirm": true, "cwd": "scripts" }
  ],
  "scriptProgress.quickActions.runVia": "terminal",

  "scriptProgress.deltaTracker.metrics": ["reconciliation_delta"],
  "scriptProgress.deltaTracker.formats": {
    "reconciliation_delta": { "unit": "%", "decimals": 2, "label": "Reconciliation Δ" }
  },
  "scriptProgress.deltaTracker.thresholds": {
    "reconciliation_delta": { "min": -0.5, "max": 0.5 }
  },

  "scriptProgress.scriptHealth.staleHours": 168,
  "scriptProgress.accessMap.layout": "force",
  "scriptProgress.notifications.onFail": true,
  "scriptProgress.statusBar.clickAction": "menu",
  "scriptProgress.badge": "running"
}
Pending Actions
Findings your scripts marked actionable=True, taken from each script's most recent successful
run. On by default; it renders as a single quiet line when there is nothing outstanding.
Nothing is stored: the list is derived, so an item disappears when a later successful run of that
script stops reporting it. A failed run never clears one — a run that died before reaching the
check has told you nothing about whether the finding is still there.
Impact Summary
Running totals from Progress.impact(): overall, this month, and the number of runs behind each
figure. Off by default. See the note under What a run contributed about defining what you count.
Process Calendar
scriptProgress.processCalendar.processes is a list of { name, label, frequency } objects.
name is matched against the start of task names in run history, case-insensitively, so
"Nightly Load" covers Nightly Load Phase 2. label is what the dashboard shows.
frequency |
Extra field |
Meaning |
daily |
dueHour (0–23, default 12) |
Done if a successful run happened today. Overdue once the local clock passes that hour with no run. |
weekly |
dayOfWeek (1 = Monday … 7 = Sunday, default end of week) |
Done if a successful run happened since Monday. Overdue past the end of that weekday, or if a whole week was missed. |
monthly |
dayOfMonth (1–31, default last day) |
Done if a successful run happened this calendar month. Overdue past the end of that day. |
Dependencies between processes. dependsOn lists task names that must have run successfully
in the current period before this process can:
{ "name": "Downstream Load", "label": "Downstream", "frequency": "monthly", "dayOfMonth": 5,
  "dependsOn": ["Upstream Extract"] }
It then reads blocked — waiting on Upstream Extract rather than overdue, because there is
nothing you can do about it yet and calling it overdue points at the wrong step. Blocked never
overrides done: if it ran, it ran.
⚠️ It means exactly "the named process has not run in this period". It cannot know about a step a
person performs — a file sent to someone and returned — so do not read it as "everything upstream
is ready".
Reliability over time. Each row carries a dot per recent period and a percentage: ran in 11 of
the last 12. A period before the process first ran is drawn hollow and excluded from the
figure — a process wired up last week is not "0% for the year". Configure with
processCalendar.compliance and processCalendar.compliancePeriods.
reminderDays on a process notifies you when its due date is approaching rather than only once
it has been missed — "reminderDays": 2 fires once, two days out. The calendar always knew this;
until now it could only report the past.
A process that has never reported is shown as not wired yet rather than overdue.
Processes made of several phases. When a process is not one script — phases that run on
different days, sometimes waiting on someone else — list them in subtasks:
{ "name": "Quarter Close", "label": "Quarter Close", "frequency": "monthly", "dayOfMonth": 25,
  "subtasks": ["Quarter Close Phase 1", "Quarter Close Phase 2", "Quarter Close Phase 3"] }
Each name matches as a prefix, like name itself. The process reads 2 of 3 phases with a pip
per phase until every one has run successfully in the period, and only then says done.
All date math is local time. scriptProgress.processCalendar.view picks list, grid (a month
grid per process) or both; scriptProgress.processCalendar.upcoming adds a "next due" line. A
failed attempt after the last success is noted even when the status is otherwise fine.
Quick Actions
Each entry in scriptProgress.quickActions.buttons takes label and command, plus optional
icon (a Codicon name such as play, sync, beaker, mail), group (a heading),
confirm (defaults to true — it shows the final command before running), cwd (relative to
the workspace folder) and task (the task name the button starts, so the button can show its
last run).
In command:
${prompt:Your question} — anywhere, any number of times. You are asked for each value before
the command runs; pressing Escape cancels.${file} — the active editor's file.
scriptProgress.quickActions.runVia chooses how a button runs: terminal sends the text to one
reusable Script Progress terminal, task runs it as a VS Code task so the exit code is
captured. scriptProgress.quickActions.asTasks also exposes every button as a task of type
scriptProgress, so it appears under Terminal → Run Task and can be bound to a key.
scriptProgress.quickActions.disableWhileRunning disables a button while the task named in its
task field is running.
scriptProgress.quickActions.contextMenu adds Run with Script Progress to the Explorer and
editor-tab context menus for .py, .js, .ts, .ps1, .sh, .cmd, .bat and .r/.R
files; scriptProgress.quickActions.interpreters maps each extension to the command prefix used
to run it (".py": "python", ".ts": "npx tsx", and so on).
Workspace trust. Quick Actions run shell commands from settings, so in an untrusted
workspace buttons defined by the workspace's own settings are ignored and nothing is run.
Buttons that know when they are pointless. enableWhen checks the last successful run of a
task before offering a button:
{ "label": "Fix issues", "command": "python fix.py", "task": "Audit",
  "enableWhen": { "metric": "issues", "gt": 0 } }
The button stays visible and disabled, with the reason on hover — "last run had issues = 0,
needs more than 0". If the metric or the run is missing it stays enabled.
Run Timeline
scriptProgress.timeline.windowHours is how far back the lanes reach (default 24; 168 for a
week). scriptProgress.timeline.showFailed keeps failed runs on the track (default on). Bars
are coloured by result; a bar that took far longer than that script usually does is marked slow,
and one that passed the process's maxMinutes gets the failure stroke. Hover a bar for its times.
Anomalies and limits
Two things flag a run as worth a look, in Run History, Last Completed, the timeline and the
notifications:
- Slow —
scriptProgress.runHistory.anomalies (on) compares each run with the median of that
script's previous successful runs (needs at least three) and flags it at
scriptProgress.runHistory.anomalyFactor × the usual time (default 2). The flag shows the
factor, e.g. 2.7×, and the expanded row says what "usual" was.
- SLA — give a Process Calendar entry
maxMinutes and any run of it longer than that is
flagged, the Active Task card shows elapsed against the limit, and
scriptProgress.notifications.onSlow can warn the moment a running script passes it.
Metric regressions
The anomaly detector also watches the numbers, not just the clock. A metric that lands far from its
own median across previous runs of the same task is flagged in Run History and explained in the
row's detail: rows 200 — usually about 4,000 (7 prior runs).
Duration anomalies catch infrastructure; these catch data. It needs at least four prior
successful runs before it will say anything, and runHistory.ignoreMetrics excludes anything
naturally variable — without that, one restless number teaches you to ignore all of them.
Delta Tracker
scriptProgress.deltaTracker.metrics lists which series from deltas.json to chart; empty means
every metric present. scriptProgress.deltaTracker.points caps how many recent points each chart
draws (default 50).
scriptProgress.deltaTracker.formats sets display per metric — unit, decimals, label — and
scriptProgress.deltaTracker.thresholds sets an acceptable range per metric with min and max.
Values outside the range are highlighted on the chart and counted in the summary strip.
A goal is not a band. target draws its own line, so the chart answers "are we at goal?"
and not only "which way is it moving?":
"scriptProgress.deltaTracker.thresholds": { "reconciliation_delta": { "min": -0.5, "max": 0.5, "target": 0 } }
Measuring twice in one run. Call track_delta() more than once and the card says what the
run found and what it left behind — found 4.2K, resolved to 0 — instead of drawing two dots you
have to interpret. Points are paired by run id, so unrelated readings are never joined up.
Bringing history with you. Script Progress: Import Delta History… reads a plain
[{ "date": "...", "value": 1.23, "task": "..." }] array (or { "metric": [ ... ] } for several
series) into deltas.json, so a series that existed before this extension did starts with its
real depth. It merges rather than replaces, skips points already present, and reports anything it
could not read.
Coverage
One figure in the summary strip for is the routine holding together, combining schedule
adherence, run success and metrics-in-range. Its three inputs are always in the tooltip —
4/4 processes on time · 53/59 runs in 30 days · 0/1 metrics in range.
It is not a data-quality score, and it is not named like one on purpose. This extension can
see whether your jobs ran, whether they succeeded, and how the numbers they report about
themselves moved. It cannot see your data. A composite is honest while you can check what went
into it; it stops being honest the moment its name promises more than its inputs support.
Blocked and never-run processes are excluded — neither is this process failing to comply. Turn it
off with coverage.show.
Metrics Explorer
One table per script: its metrics down the side, its last scriptProgress.metricsExplorer.maxRuns
runs across (default 12), a sparkline per numeric metric and the change against the previous run
that reported it. scriptProgress.metricsExplorer.metrics narrows it to the names you care about.
A Total column sums each numeric metric over the runs in view, with the mean in its tooltip —
so a per-run number worth accumulating, such as a cost, reads as a period total. Turn it off with
scriptProgress.metricsExplorer.totals.
Warning Trends
Warnings from the last scriptProgress.warningTrends.days (default 14) grouped by message —
numbers and ids are normalised so "17 rows had no customer id" and "29 rows had no customer id"
count as one pattern — with a daily bar chart, the scripts each pattern came from, and whether it
is rising or falling. scriptProgress.warningTrends.top caps the list (default 8).
Script Health
scriptProgress.scriptHealth.staleHours (default 168 — seven days) is how long a task can go with
no run before it is called stale. scriptProgress.scriptHealth.resultDots is how many recent
results to show as dots per task, 0 for none.
scriptProgress.runHistory.trend controls the duration sparkline shown here and in expanded
history rows.
Access Map
Turn on scriptProgress.sections.accessMap and open it with Script Progress: Open Access Map
(the editor tab draws it full size; the sidebar shows a small preview when
scriptProgress.accessMap.sidebarPreview is on).
Controls: drag the background to pan, wheel to zoom, drag a node to move it, type in the search
box (or press /) to filter, click a node for its lineage — everything upstream of it lit
orange, everything downstream lit green, two hops out — right-click for a menu (focus, centre,
hide the type, copy the name, show its runs in Run History), click a legend entry to hide a type,
F to fit, R to re-layout, Esc to clear, and double-click the canvas to reset. Node types are
task, file, table, api and other; solid lines are writes, dashed lines are reads, line
width grows with use, and nodes fade with age since last seen. The toolbar replays the last runs
through the map, fits, resets, saves a PNG, and opens the map full-size.
| Setting |
Does |
scriptProgress.accessMap.layout |
force settles into a physics constellation; radial puts scripts on an inner ring and resources on an outer ring grouped by type |
scriptProgress.accessMap.maxNodes |
Cap on nodes drawn; least recently seen are dropped first |
scriptProgress.accessMap.timeWindowDays |
Only draw what was seen in the last N days (0 = everything) |
scriptProgress.accessMap.labels |
auto, all or scripts |
scriptProgress.accessMap.sidebarPreview |
Small live preview in the sidebar |
scriptProgress.accessMap.replay |
When a run completes, replay its path through the map |
scriptProgress.accessMap.halos |
Soft glow behind each node |
scriptProgress.accessMap.ambient |
Traffic particles on the links a running script is using right now — direction shows reads vs writes. The map is still when nothing is running: motion means activity |
scriptProgress.accessMap.glyphs |
Type glyphs inside the nodes (terminal, table, file, cloud) |
scriptProgress.accessMap.minimap |
A minimap in the corner; click it to pan |
scriptProgress.accessMap.starfield |
A faint static starfield behind the graph (off by default) |
Motion honors the system reduced-motion setting.
Notifications
scriptProgress.notifications.onFail and .onStall are on by default; .onComplete and
.onWarning are off. .onExit notifies when a Quick Action's process exits non-zero.
.onSlow warns when a run passes its maxMinutes, or finishes far slower than usual.
.mirrorProgress additionally mirrors the running task into a native VS Code progress
notification with a percentage — useful on a second monitor, noisy otherwise.
Status bar and badge
scriptProgress.statusBar.enabled shows the current task bottom-left.
scriptProgress.statusBar.idleMode decides what happens when nothing is running: last keeps the
most recent result on screen, hidden removes the item.
scriptProgress.statusBar.clickAction makes a click open a menu of actions (menu) or go straight
to the dashboard (dashboard).
scriptProgress.badge puts a number on the Activity Bar icon: running tasks, failures today,
or off.
Commands
Everything is under the Script Progress category in the Command Palette.
| Command |
Does |
| Open Dashboard |
Opens the full dashboard in an editor tab |
| Open Access Map |
Opens the Access Map at full size |
| Show Sidebar |
Focuses the Script Progress view in the Activity Bar |
| Show Run History (text) |
Dumps run history to an output channel |
| Refresh |
Re-reads the files now |
| Open Logs Folder |
Reveals the logs folder, offering to create it |
| Run Quick Action… |
Picks one of your buttons and runs it |
| Run with Script Progress |
Runs the current or selected script file using the configured interpreter |
| Copy Daily Summary |
Copies today's runs, failures and warnings to the clipboard |
| Copy Weekly Digest |
A week's rollup: what ran, what failed, what is overdue, how tracked metrics moved |
| Compare Two Runs… |
Picks two runs and opens their differences as Markdown |
| Import Delta History… |
Merges an existing [{date, value, task}] series into deltas.json |
| Generate Runbook |
Writes a Markdown runbook from what the extension has observed |
| Copy Digest for Email (formatted) |
The weekly digest as formatted text, ready to paste into an email |
| Export Run History (CSV) |
Writes run history, with metrics, to a CSV file |
| Export HTML Report |
Writes a self-contained HTML page of the whole dashboard, static map included, to share |
| Archive Run History |
Moves the current history aside into a dated file and starts fresh |
| Clear Run History… |
Empties run history after confirmation |
| Choose Dashboard Sections… |
Ticks sections on and off without opening Settings |
| Simulate a Demo Run |
Writes the same files a real script writes, so you can see it work |
| Open Settings |
Jumps to the extension's settings |
| Open Getting Started |
Reopens the walkthrough |
Status Menu also exists as a command but is hidden from the palette: it is what the status bar
item opens when scriptProgress.statusBar.clickAction is menu.
Keybindings
| Keys (Windows / Linux) |
Keys (macOS) |
Command |
Ctrl+Alt+Shift+D |
Cmd+Alt+Shift+D |
Open Dashboard |
Ctrl+Alt+Shift+R |
Cmd+Alt+Shift+R |
Run Quick Action… |
Theme colors
Every color in the dashboard is a VS Code theme variable, so it looks right in Light, Dark and
High Contrast without configuration. Four are contributed and can be overridden:
| Id |
Used for |
scriptProgress.running |
Running task: progress bar, badge, map pulse |
scriptProgress.complete |
Completed task |
scriptProgress.failed |
Failed task |
scriptProgress.stalled |
Stalled task |
{
  "workbench.colorCustomizations": {
    "scriptProgress.running": "#4fc1ff",
    "scriptProgress.stalled": "#ffcc00"
  }
}
Privacy
The extension reads JSON files in your logs folder and renders them. It makes no network
requests, sends no telemetry, bundles no runtime dependencies, and calls no AI service. The only
thing it runs on your behalf is a Quick Action command you wrote yourself, in your own terminal —
and not at all in an untrusted workspace.
Two other processes start, both local and both avoidable:
- The Python reporter runs
git rev-parse once per run to record the commit. PROGRESS_NO_GIT=1
stops it. It resolves git from PATH only, never from the working directory.
- Copying a formatted digest starts a short-lived PowerShell process on Windows to set the
clipboard, from the absolute path in
System32. It reads nothing and sends nothing anywhere.
It records the OS username and git commit per run so history can say who ran what. Both are
opt-out (PROGRESS_NO_USER=1, PROGRESS_NO_GIT=1, or set PROGRESS_USER to something else).
They are written to progress.json, progress/<task>.json and run_history.json — all of them
files in your own logs folder. The only way either leaves your machine is the HTML report,
and only when scriptProgress.report.includeIdentity is on; it is off by default. The CSV
export and the formatted digest carry neither.
Formatted-digest copying starts a short-lived PowerShell process on Windows to set the clipboard.
It reads nothing and sends nothing anywhere.
It writes nothing else, with one opt-in exception: turn on scriptProgress.events.file and it
writes last_event.json into your logs folder when a run completes, fails, stalls or exits, so a
tool outside VS Code can watch for it. That is a local file — there is no webhook option, by
design.
It activates after startup in every window, and that costs one folder check and a file watcher.
When the logs folder does not exist, nothing else runs until it appears.
Build from source
npm install          # TypeScript, types and Codicons — dev-time only
npm run compile      # tsc -> out/  (also refreshes media/codicons/)
npm test             # node --test, no VS Code download needed
python python/test_progress.py
npm run package      # dist/script-progress-dashboard-<version>.vsix, via npx @vscode/vsce
Press F5 in this folder to launch an Extension Development Host on the demo workspace.
Known limits
History is capped at 100 runs and warnings at 20 per run. Both caps drop the oldest first, and
both have consequences worth knowing: with several scripts a day, a task's last successful run can
age out of history, and when it does its Pending Actions disappear with it and the coverage
figure starts counting "the last 100 runs" rather than the last 30 days (it says so when that
happens). Warnings marked actionable are exempt from the per-run cap — they are never dropped.
Archive history before it rolls if you need to keep it.
The Access Map shows only what scripts declared. A job nobody instrumented, a table read
through a view under another name, or anything running outside the reporter is invisible to it. So
"what breaks if this fails?" is answered from declared access only — treat it as a floor, not a
complete picture.
- A relative
scriptProgress.logsPath resolves against the first workspace folder in a
multi-root workspace. Use an absolute path if that is not the one you mean.
- Two scripts finishing in the very same instant can race on
run_history.json. The reporter
retries, but one row can be lost — never corrupted, and never the file.
progress.json is a single slot, so two scripts running at once take turns owning it. The
per-task files under progress/ are what give each one its own card; history, deltas and the
Access Map record both regardless.- Requires VS Code 1.80 or newer. The unpacked-folder install route additionally needs the
extensions.json entry described in install/README.md on 1.136.
Changelog
Every release is listed in CHANGELOG.md, and the reasoning behind the bigger
judgement calls — including the ones deliberately not built — is in ROADMAP.md.
Credits
Icons from Codicons (Microsoft) — code MIT,
icons CC-BY-4.0.
Extension © 2026 Trevor Marshall. MIT license.

