TraceFlow — AI Python DebuggerAI-powered Python crash debugger for VS Code. Captures the full crash context — call stack, variables, exception type — and delivers the exact fix with one click. Installation Launch VS Code Quick Open ( Ctrl+P), paste the following command, and press enter.Copied to clipboard |

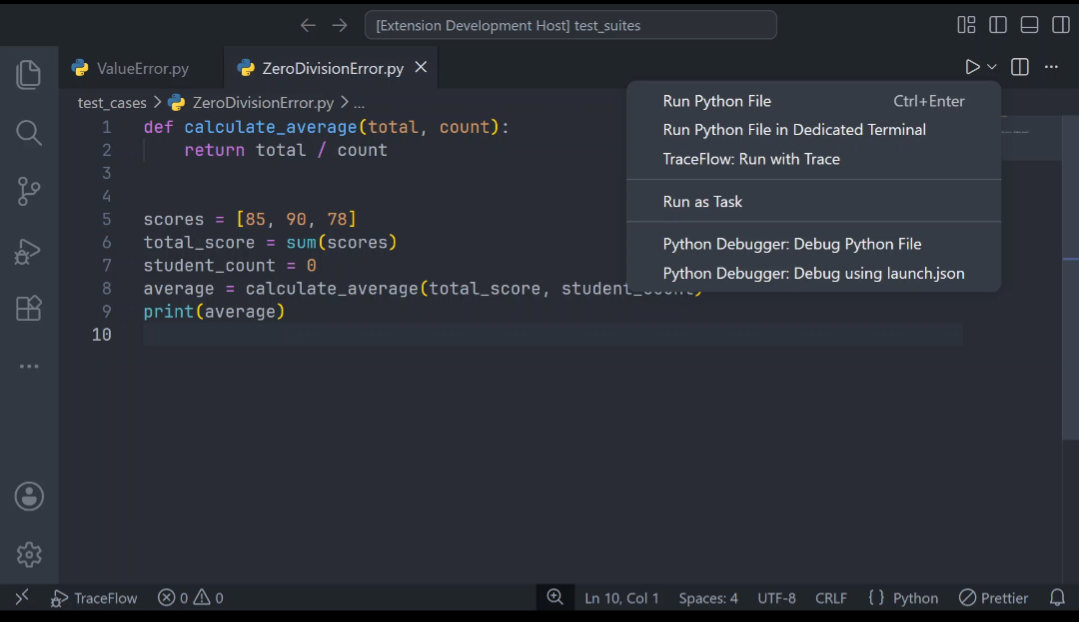
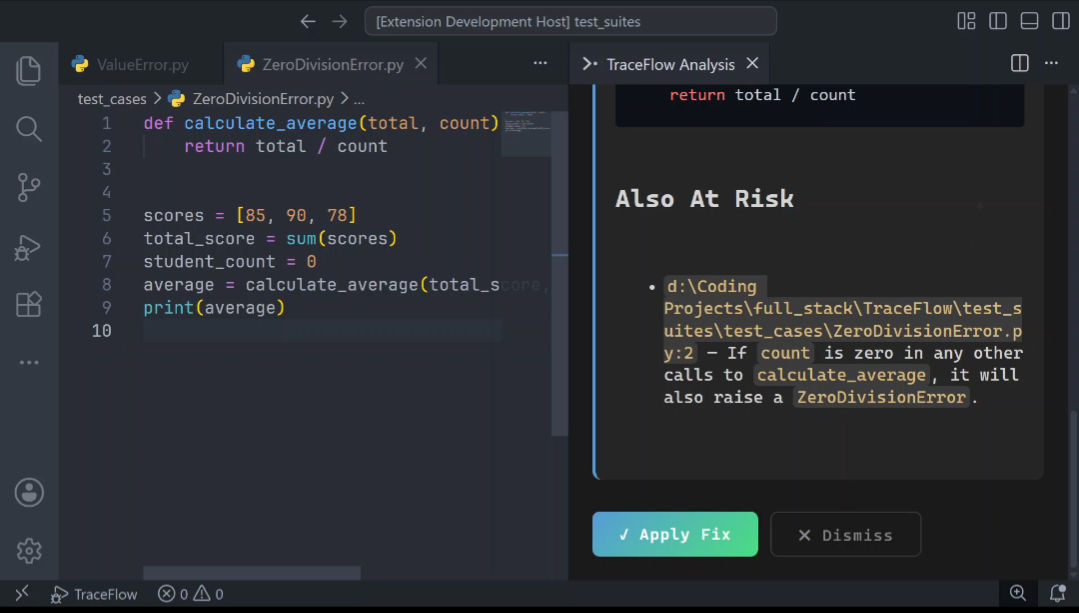
TraceFlow — AI Python Debugger for VS CodeTraceFlow is an AI-powered Python debugger for VS Code that captures the full crash context — call stack, variables, exception type, and source code — and delivers the exact fix with one click. You hit run, your Python code crashes, and within seconds TraceFlow tells you exactly why it crashed, which function caused it, and gives you a complete fix you can apply directly to your file — without leaving the editor. ▶ Watch the full demo · Get Started Free Why TraceFlowPython's error messages tell you what crashed. They don't tell you why. You get a one-line exception. You have no idea what the variable values were at the moment of crash, which function in the call stack was actually responsible, or what the fix looks like. So you spend 20 minutes on Stack Overflow debugging something that should take 2 minutes. TraceFlow fixes this by capturing the complete picture at the moment of crash and sending it to AI for deep analysis — not just the error message, but everything. How It Works1. Run your Python file Click the TraceFlow button in the editor toolbar or the status bar item. 2. Crash detected automatically If your script crashes, TraceFlow captures the full context instantly:
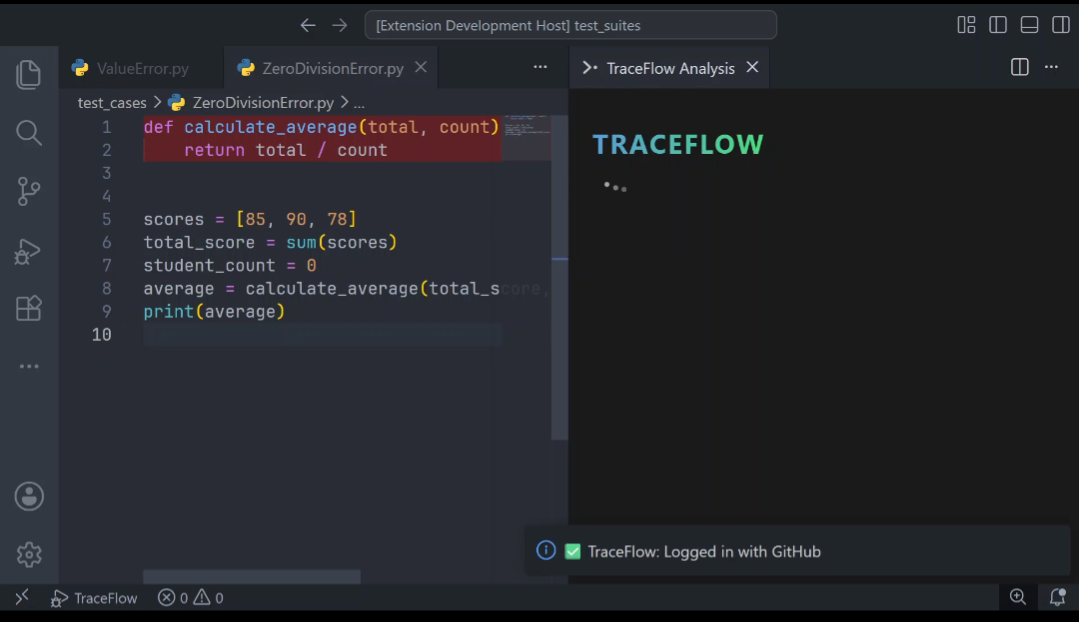
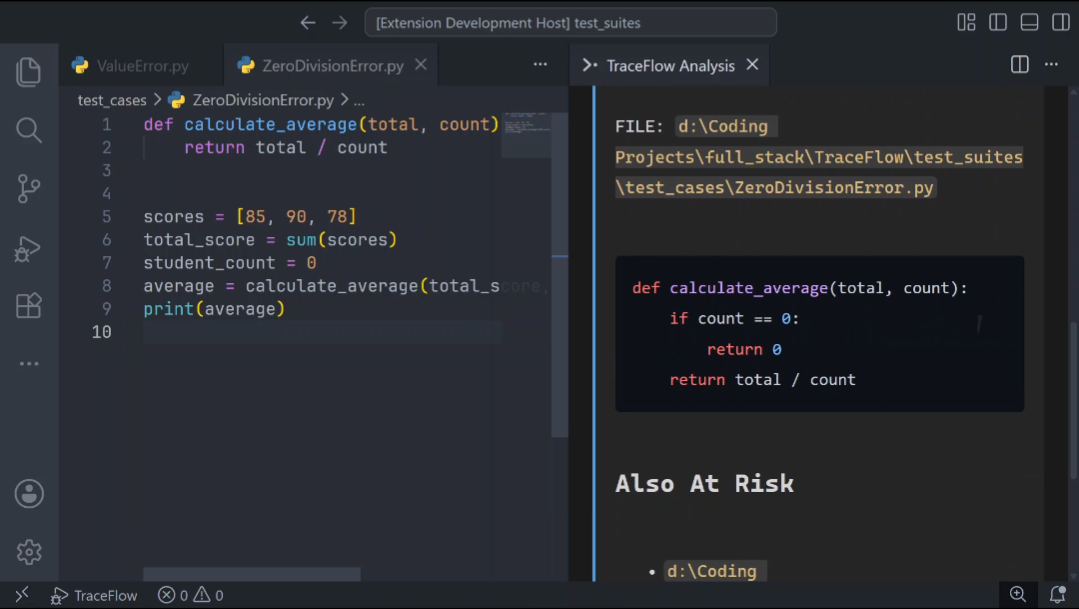
3. Crashed function highlighted in red The exact lines that caused the crash are highlighted red in your editor and scrolled into view automatically. 4. AI analysis streamed in real time The TraceFlow panel opens beside your editor and streams:
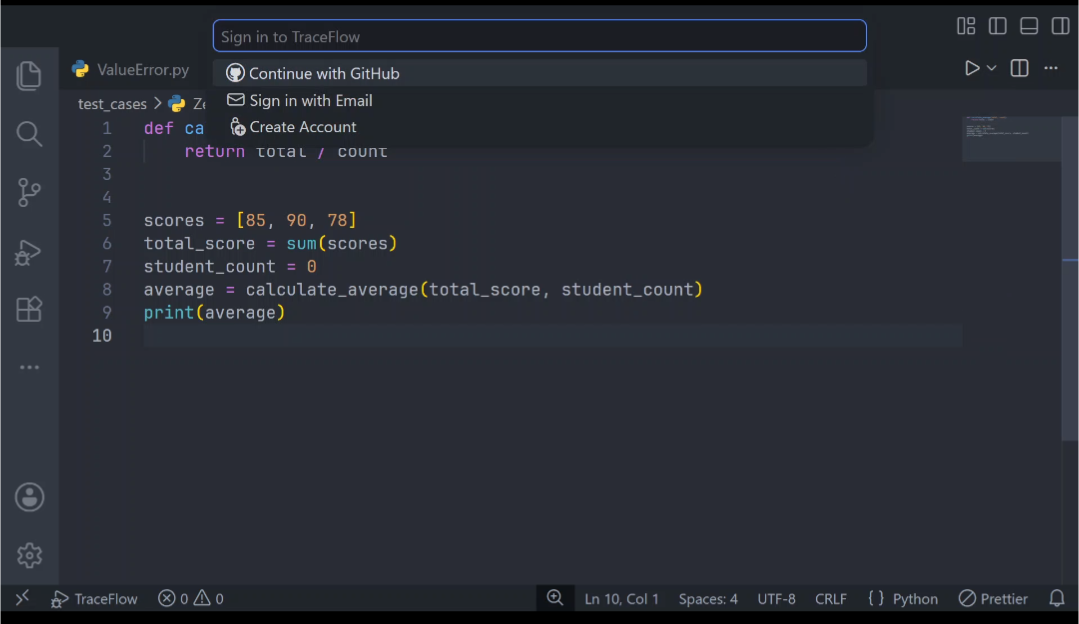
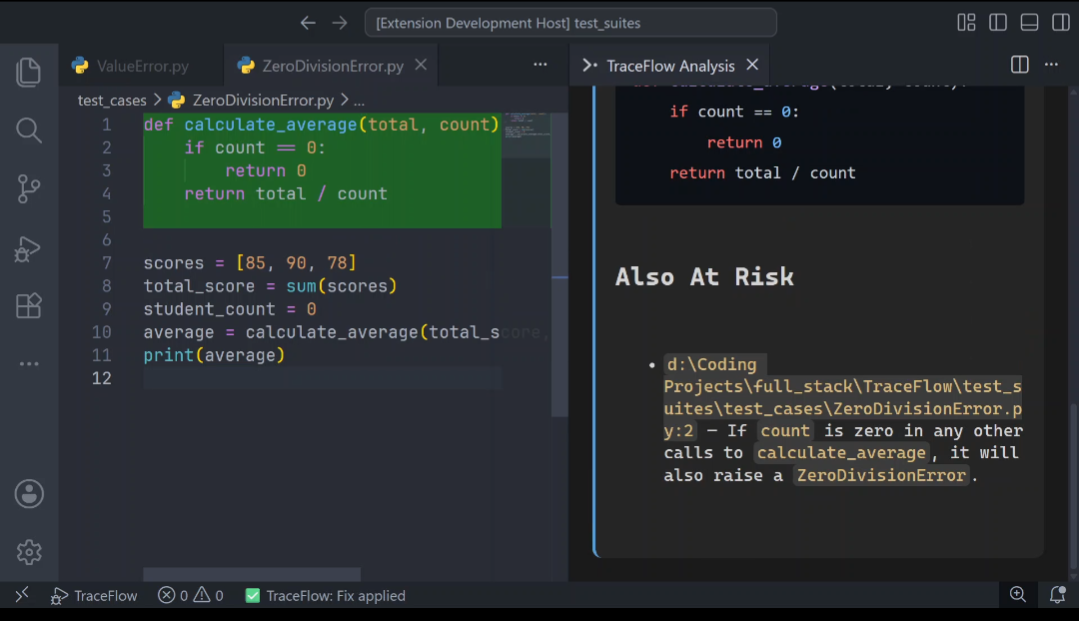
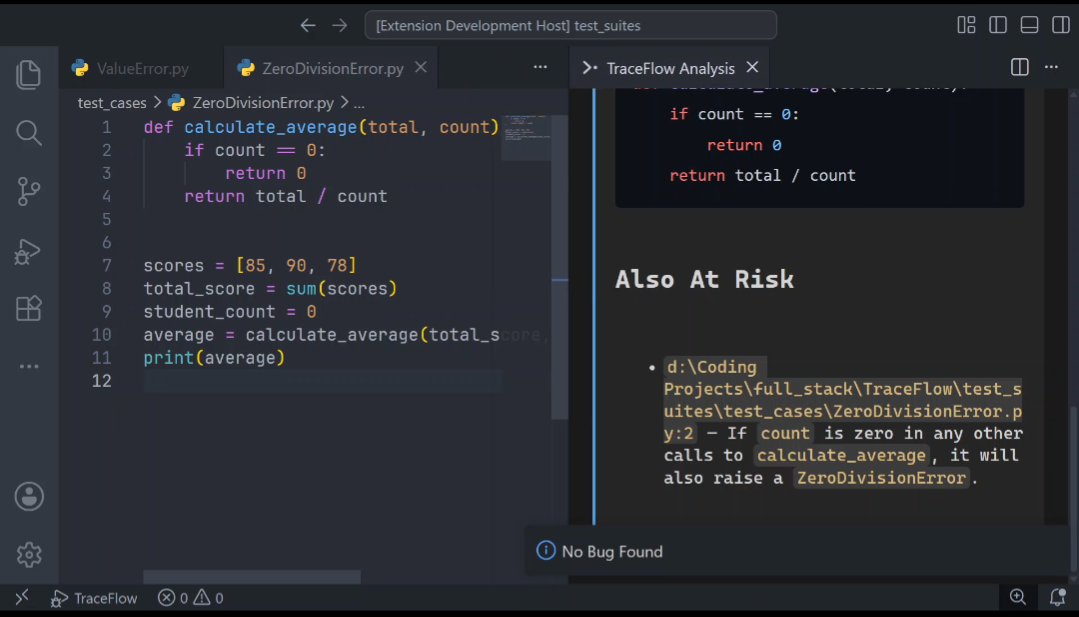
5. Apply Fix in one click Click Apply Fix and TraceFlow patches the exact lines in your file. The fixed lines briefly highlight in green so you can see exactly what changed. The file is saved automatically. Demo
What Makes TraceFlow DifferentMost AI coding tools send only the error message to AI. TraceFlow captures the full crash context — variable values, call stack, source code — before sending anything. The difference in diagnostic quality is significant.
Features
Getting Started
Commands
All commands available from the Command Palette ( PlansFree — 5 AI analyses per day. No credit card required. Pro — $9/month for unlimited analyses. PrivacyWhen a crash occurs TraceFlow sends only the relevant crash context — call stack, surrounding source code, and variable state at the moment of the error — to TraceFlow's backend for AI analysis. Your full codebase is never uploaded. Only the minimum context needed to diagnose the specific crash. Requirements
Known Limitations
Feedback and SupportFound a bug or have a feature request? Reach out at traceflow.pasly.co or open an issue on GitHub. Feedback directly shapes what gets built next. Release NotesSee CHANGELOG.md for full release history. |