Claude/Codex Usage — Quota & Context Statusbar


Your quota runs out in the middle of a task, and the reset is three hours
away. Nothing warned you it was coming, and nothing tells you what spent it.
This extension keeps that answer in the status bar: how much of your 5-hour and
7-day window is already gone, whether the pace you are working at still fits
before the reset, and how full the context window is — colour-coded, at a
glance, without leaving the editor. Hover it, or dock the panel, and it also
says where the tokens went: which subagent, on which model, and how much of
the total was a cache being rebuilt after a pause.
It works with Claude Code and Codex in one status-bar item, with no
setup. In Auto the bar follows whichever provider is actually active in the
workspace, so a finished Claude transcript no longer holds the line while Codex
is running. Claude Code gets the full local-transcript picture — quota, context,
cache tier, cache hit rate, token details. Codex reports quota, context, cached
input, token details and the active model + reasoning effort from its local
app-server and rollout history.
Install: search “Claude/Codex Usage” in the VS Code Extensions
view, use Open VSX for
VSCodium-compatible editors, or run
code --install-extension solux-dev.cc-statusbar.
| English |
Русский |
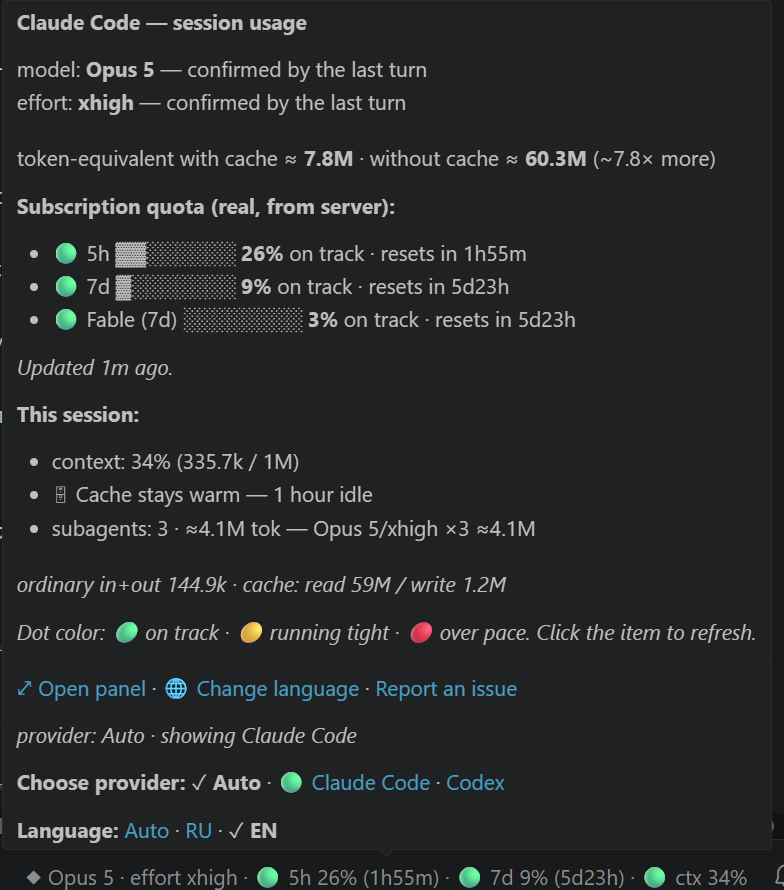 |
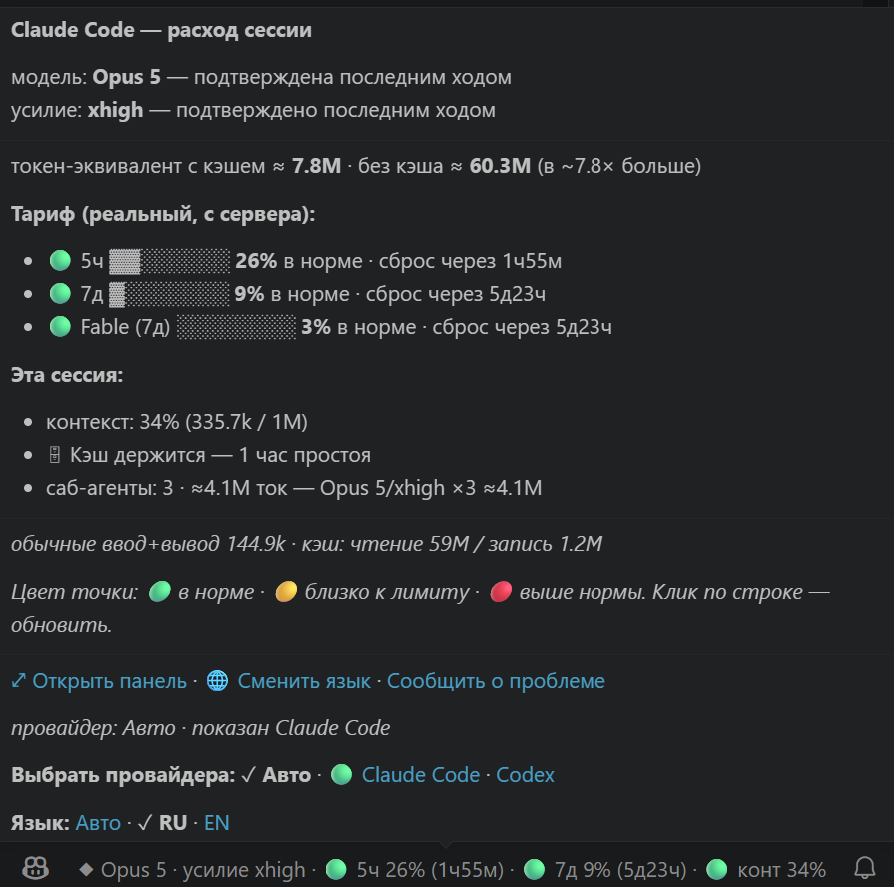 |
The collapsed bar lives at the bottom-right of the status bar; hover it for the
full breakdown shown above. Want to keep it open? Click “⤢ Open panel” in
the tooltip (or run “Claude/Codex Statusbar: Open usage panel”) to dock a
live-updating panel that stays until you close it.
How this differs from the other usage bars
Compared against the six most-installed alternatives —
claude-code-usage-tracker, ccusage-vscode, claudemeter,
claude-monkey-bar, vscode-codex-usage and claude-state-bar — with each
project's own README as the source, checked 25 August 2026. Four things this one
does that they do not:
|
cc-statusbar |
The others |
| Cache economy |
Reads the prompt-cache tier from the transcript — 1 hour or 5 minutes — and prices each cache write at the tier its own turn states (a turn that states none is priced by a setting, not by a guess), then adds a line for what pausing costs: a cache goes cold and the whole context is loaded again. |
None of the six tells one cache lifetime from another. The closest, ccusage-vscode, prices cache tokens only to reach a total in dollars. |
| Delegated work as spend |
What each subagent spent, grouped by model and reasoning effort, most expensive first, with the nesting depth that says who chose to spend it. |
None of the six attributes spend to the agent that spent it. claude-state-bar monitors running agents, which answers who is working now — not what that work cost. |
| Quota from four independent sources |
The account usage payload, a passive statusLine bridge, a header poll, and Claude Code's own on-disk copy. The freshest valid reading wins, so one channel breaking stays invisible, and a stale reading is always shown with its age. |
claude-code-usage-tracker reads one channel — its own README says "all data comes from the Anthropic API… no local JSONL parsing or file watching is involved" — and claudemeter likewise one; claude-state-bar also one, and only after you set it up by hand. There is no second source to fall back on. |
| Both providers, zero setup |
Claude Code and Codex in the same item, through the logins both tools already have on the machine. |
vscode-codex-usage covers Codex only; four of the others cover Claude Code only. claude-state-bar covers both too, but its Claude plan usage needs an Org ID and a sessionKey copied out of your browser's DevTools. |
The status bar, both hovers, both panels and every command are also fully
Russian as well as English, following the editor's display language. (Inside
VS Code's own settings editor, the provider, language and Codex-path settings
are translated; the remaining setting descriptions are English.)
What it shows
Compact status-bar line (click to refresh) — it shows which model you are
talking to, then the tariff per window, then the context-window fill:
◆ Opus 5 · effort high · 🟢 5h 24% (2h41m) · 🟢 7d 41% (4d3h) · 🟢 ctx 47%
◆ GPT-5.6 Sol · effort high · Codex · 🟢 7d 10% (6d21h) · 🟢 ctx 18%
◆ Opus 5 is the model of the session in front of you, confirmed by its
last real turn (read from the local transcript). In a chat that hasn't answered
yet the marker changes to ◇ and the name comes from Claude Code's own settings
— what a new chat is set to start on:
◇ Sonnet 5 (planned) · effort high · …    ← new chat, pinned in settings
◇ default model · effort high · …         ← new chat, no model pinned (account default)
⚠ Sonnet 5 → Opus 5 · effort high · …     ← the model just changed
◆ Opus 5 · ⚠ effort high → xhigh · …      ← the effort just changed
◆ Opus 5 · ⚠ new chat: Sonnet 5 · …       ← an unanswered chat is open beside this one
A change stays highlighted until the next reply, not for a fixed number of
seconds — a timer would quietly expire while you are away from the keyboard,
which is exactly when a switch goes unnoticed.
A resumed chat keeps its confirmed model: its transcript already exists, so a
known fact is never downgraded to an expectation just because the process
restarted. When an unanswered chat is open next to an active one, the bar names
it (⚠ new chat: …) instead of guessing which tab you are looking at — VS Code
exposes no API for that. It stays silent when both would run the same model, i.e.
when nothing can go wrong.
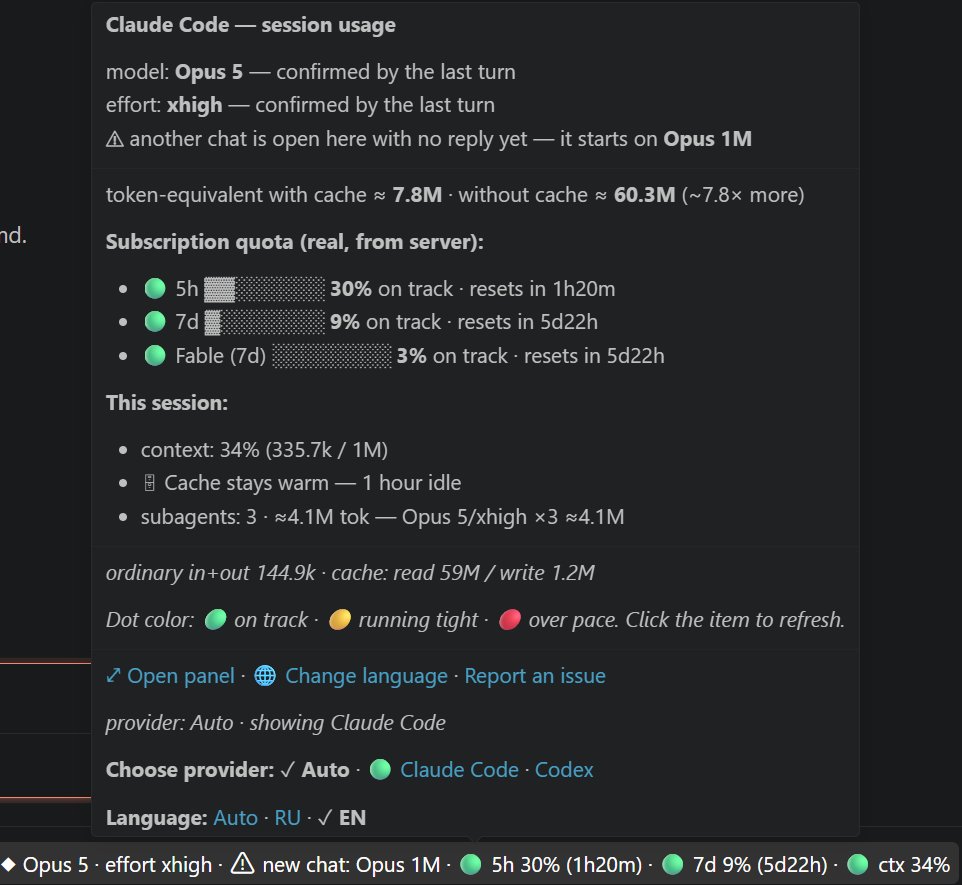
The session is confirmed on Opus 5 at xhigh effort, while the chat just opened
next to it is set to start on Opus 1M — named before a single token is spent
on it.
effort is the reasoning level (low / medium / high / xhigh): the one the
last turn ran at, or — in a chat that has not answered — the one it is set to
start on, marked (planned) just like the model. It is spelled out rather than
abbreviated to eff on purpose: eff already means effective tokens here, and
both can appear in the same line.
The point is to catch "wrong model" before you type, instead of discovering it
after a costly turn. Two guarantees. Provenance is always visible: ◆
confirmed, ◇ expected, or the explicit A → B form while a switch is being
flagged — the previous session's model is never shown as if it were current.
Subagent models never appear in this segment: a Sonnet helper spawned by an
Opus lead does not change the line, because subagent turns live in separate
transcripts and are excluded from it — their tokens are still counted in the
session totals (see Delegated work).
Like the context dot, the model segment never recolours the whole item: identity
is information, not a quota with consequences.
For Codex, ◆ GPT-5.6 Sol · effort high comes from the current local rollout's
turn_context. It is the lead turn's actual configuration, costs no extra
request or token, and never substitutes a spawned subagent's model.
ctx 47% is how full the model's context window is right now (current input ÷
the model's window limit) — a quick read of how big a next step you can take. Its
dot is purely informational (🟢 under 40% · 🟡 40–60% · 🔴 60%+) and,
unlike the tariff, it never recolours the whole item: context is just
information, not a quota with consequences, so "how full" and "burn pace" stay
visually separate. If the window limit can't be fetched, the ctx segment is
simply hidden (the % is never guessed).
Those thresholds are deliberately early. With a 1M window, filling it is never
the goal: answer quality degrades progressively well before the limit, and a
fatter context also costs more quota per turn. 🟡 reads as "start looking for a
good place to finish — ideally before auto-compaction decides for you", 🔴 as
"wrap up and carry the rest into a fresh session".
When the quota channel is off/unavailable it falls back to the local
token-equivalent number: $(pulse) eff 4.7M.
Hover for the full breakdown (tooltip):
- token-equivalent (the headline) —
with cache ≈ 4.7M · without cache ≈ 32M (~6.8× more): a normalized estimate from real token counters, showing how
cache reuse changed the token load compared with re-reading everything fresh
(early in a session it can be the larger figure — a cache write is priced
above a fresh token, and at the default weights later reads on the same cache
narrow the gap).
- Details (muted) — the raw numbers behind it:
ordinary in+out · cache read / write.
- 5h / 7d real subscription quota: % used, colored bar, reset countdown,
and a plain-language verdict (
on track / running tight / over pace) —
the whole item turns yellow/red when the current burn pace risks
exceeding a window.
- per-model weekly windows (today
Fable (7d)) — a model that is capped at
a share of the weekly allowance runs out at its own pace, so it gets its own
row: 🔴 Fable (7d) ▓▓▓▓▓▓▓░ 91% over pace · resets in 2d18h. Tooltip and
panel only — the collapsed line stays 5h/7d. Rows appear by themselves for any
model the server scopes (no hardcoded model list), and carry their age when
the reading is not live.
- context — how full the model's window is now, as a full line
context: 47% (468k / 1M). For Claude Code the limit is read once per model
from the Anthropic Models API
(max_input_tokens, cached 24h); hidden entirely if the limit can't be
fetched (never guessed).
- cache — how long this session's prompt cache stays warm between one
request and the next, auto-detected from the transcript, e.g.
🗄 Cache stays warm — 1 hour idle.
- subagents — one line naming where delegated tokens went:
subagents: 8 · ≈2.3M tok — Opus 5/xhigh ×4 ≈1.5M · Sonnet 5/xhigh ×4 ≈861.8k.
The hover is grouped into blocks — identity, the numbers, technical detail,
actions — separated by a rule, and the panel uses a short left-aligned rule above
each section. In the hover's footer the current provider and language are
marked ✓ and bold, the alternatives stay blue links, and a 🟢 means "this
source has data right now" — a different thing from "this one is selected".
The "with cache" figure is cache-weighted (cheap reads, costly writes), so it
stays comparable across sessions:
work + 0.1·cache_read + 2.0·write(1h) + 1.25·write(5m). A cache write is
priced by how long that cache is kept — a 1-hour write really does cost 2×
a fresh input token, a 5-minute write 1.25× — and the tier is read from the
transcript, never assumed. Writes whose tier the transcript does not state use
the cacheWriteWeight setting (1.25). It is a token-equivalent, not a billing
price. When the tariff line is unavailable, this same number is the bar's eff
fallback.
Delegated work — where your tokens actually went
Subagents are spawned and given their models by the agent that created them —
the Lead, or another agent when nesting goes deeper. Open the panel for a
Delegated work (subagents) section:
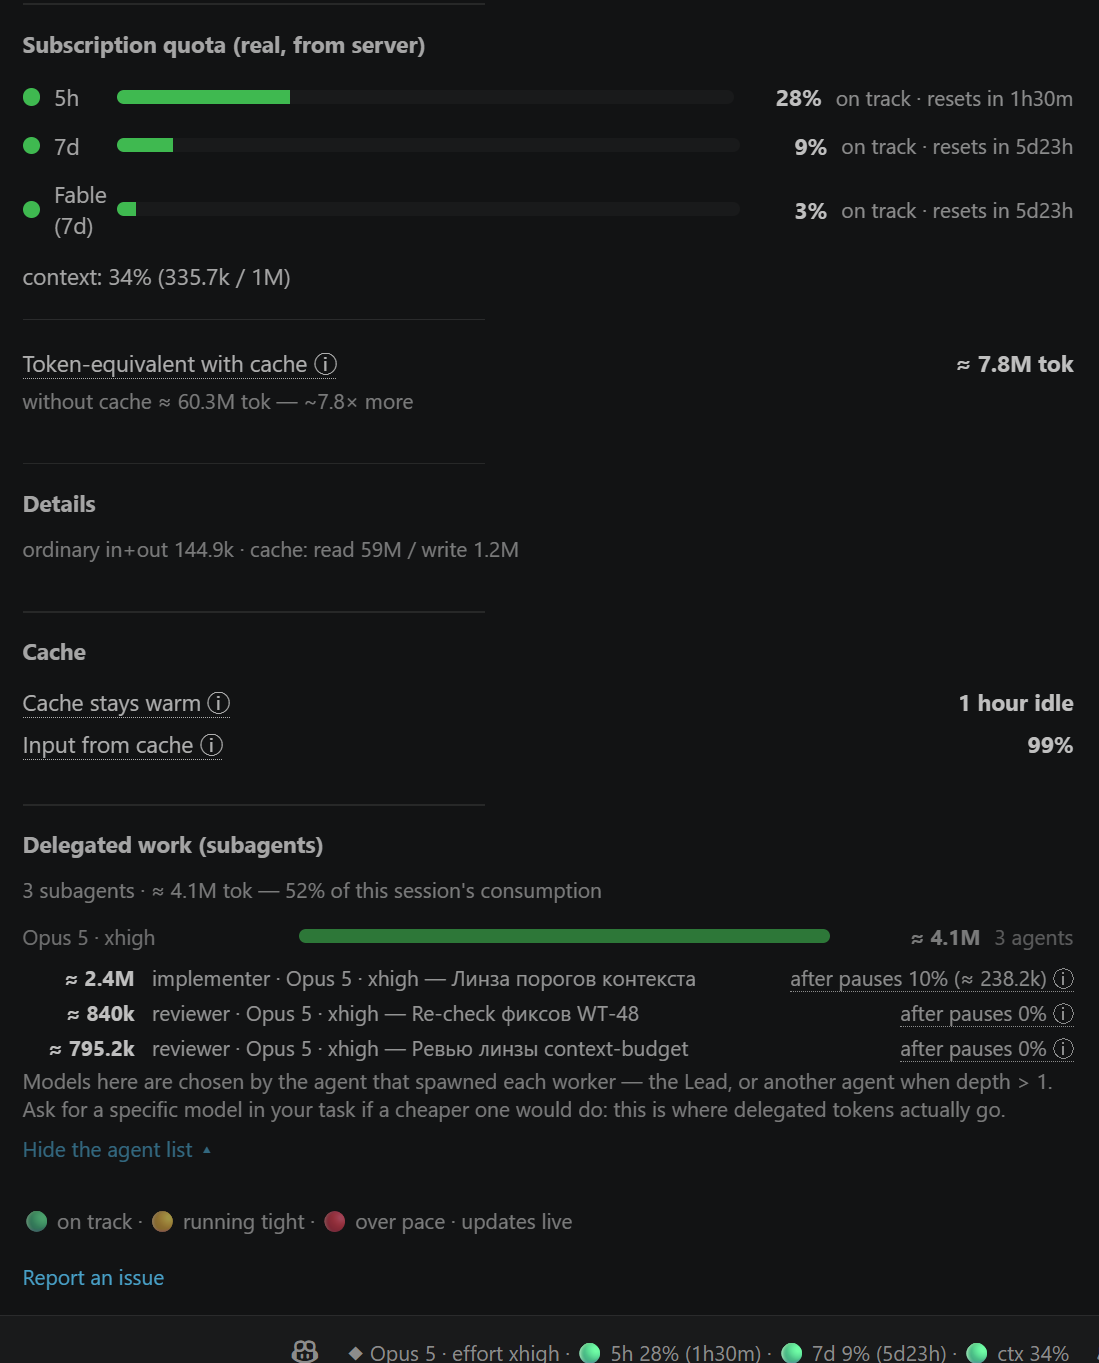
Spend grouped by model+effort first (the answer to "which models did it hand my
work to, and what did that cost"), and behind “Show each agent ▾” the
individual agents most expensive first with their type, model, effort,
token-equivalent and task description — ordering by recency could hide the
biggest spender below the cut. The list stays folded until you ask for it (your
choice is remembered), so a session with dozens of agents cannot push the rest
of the page out of sight. Grouping keys on the raw model id, so two different
deployments never merge into one row. Long lists are capped at 12 with the
remainder stated — never a silent cut. Same numbers, one line, in the hover
tooltip.
Every agent row ends with what waiting cost that agent: after pauses 31% (≈ 800k)
— the share of its own spend that went on loading its context again after a
pause, and the tokens behind that share. The percentage says how bad, the tokens
say whether it is worth acting on: 31% of a small agent is a rounding error, 31%
of a large one is worth looking into — and what to do about it depends on what
the pause was, which this figure does not claim to know. 0% is a real answer — no waiting cost was measured for that
agent: every pause it took was judged, and none of them priced to anything (an
agent that never paused at all, a single turn, is a truthful 0% too). The row
shows — when a pause could not be judged and nothing else priced to
anything — the stream states no cache lifetime to measure that pause against, or
a turn cannot be placed in time — and also when the agent has no measurable spend
at all: an empty log, a log of placeholders, a read that failed. A share of
nothing is not a zero. A dash is never a zero either: "we cannot tell" and "it
never waited" are different answers. If none of the listed agents can
be measured, the column is left out altogether rather than filling the list with
dashes. Where part of a log could be measured and part could not, the figure is
marked ≥ — a floor, truncated rather than rounded, so it never claims more than
was measured. On the 507 agent logs measured here (26 August 2026), 99% carried a
number and 1% showed the dash. A figure above zero means one of that agent's
pauses outlasted its cache. It does not say what filled the pause: the agent
may have been left open while another one worked, or its own command may have
run long — a test suite, a build. On the same 507 logs, 46% of the
tokens counted this way came from pauses whose longest silence ran from the
agent's own Bash call to its result, so naming one cause would be naming the
wrong one about half the time.
Agents spawned by another agent rather than by the Lead are marked depth N
(real and common — nesting reaches depth 5 in practice), so the breakdown says
who actually chose to spend the tokens.
This is not cosmetic: those tokens count against your quota, and nothing else
shows where they went. If a research errand does not need an expensive model,
name the model you want in the task itself.
What waiting costs. An agent's cache goes cold when its next turn comes
later than the cache lives — usually 5 minutes for a subagent, an hour for the
main session, though each stream's own lifetime is read from its transcript
rather than assumed. What filled that pause makes no difference to the clock,
and the measurement cannot see it either. After a long enough pause the agent loads
its whole context again and pays for that as a new cache write. Across the 507
agent logs measured here that is 48% of everything subagents write to cache
— and 54% once each agent's unavoidable first load is set aside — so
the section adds one line when it is worth your attention: "of that, ≈ 6M (15%
of what the agents spent) went on reloading context after pauses — an agent's
cache usually stays warm for 5 minutes".
It appears only above a threshold (at least 1M tokens and 3% of the
session), it is never coloured, and the status bar gains nothing — this is
information, not a quota with consequences. The detection looks at a pair,
never a spike on its own: a gap longer than that stream's own TTL, immediately
followed by a write. A gap in a stream that has not stated a cache lifetime yet
has nothing to be measured against, so that gap is left out of this line — never
assumed to be a reload, never assumed not to be one.
Provider: Auto / Claude Code / Codex
The status bar shows one provider at a time. Use the hover menu to switch:
Choose provider: Auto · Claude Code · Codex
Language: Auto · RU · EN
- Auto watches recent workspace activity from both providers. A finished
Claude transcript no longer holds the bar while Codex is running; when both
are genuinely live, the bar asks you to choose instead of guessing which chat
has focus. While both are idle, the most recently active provider stays shown.
- Claude Code reads the current workspace's Claude transcript and quota
channel.
- Codex talks to the local Codex app-server and reads local Codex token
history. It is intended for users who already have Codex working in the same
editor/workspace.
The currently working provider is marked with a green dot in the hover menu.
Cache insight (panel)
Open the panel (“⤢ Open panel”) for a small Cache section — two plain
lines, each with a hover footnote (ⓘ) that explains it in full, so you never have
to look anything up:
- Cache stays warm —
1 hour idle / 5 minutes idle. Auto-detected from
the session, never assumed. It tells you how long your prompt cache survives
between one request and the next — the clock runs on the gap, not on whether
you are at the keyboard, so a six-minute test run cools a five-minute cache
while you type all the way through it. On a subscription within its plan limit
it's 1 hour; an API key, paid usage past your plan limit, or (usually) a
subagent run at 5 minutes (short pauses rebuild the cache and cost more).
Check it once to know how long a pause you can afford — you don't need to
watch it.
- Input from cache — e.g.
95%. The share of your prompt served from cache
(cheap) instead of re-read fresh; higher means the cache is being reused well.
It's normal to start low and climb as a session warms up — a descriptive read
of where this session's tokens went, not a score.
For Claude Code these are read straight from the per-turn
cache_creation.ephemeral_{1h,5m} fields in the local transcript, so they stay
correct even as Anthropic adjusts caching behaviour. Codex exposes cached input
tokens, so the extension can show Input from cache, and it states a
cache-write count too (cache_write_input_tokens) — Details shows the count
Codex itself reports, not the part of it the token-equivalent could price. (Like
every figure here it is shown compactly: a stated 4,583 prints as 4.6k.) What
Codex does not expose is a cache tier, so that line is shown as not
available instead of guessed.
Glossary — what you see / Что вы видите
| In the bar/tooltip |
English |
По-русски |
| 🟢 |
on track — at this pace you'll comfortably fit the window |
в норме — при таком темпе уложитесь в окно |
| 🟡 |
running tight — getting close to the limit before reset |
близко к лимиту — мало запаса до сброса |
| 🔴 |
over pace — burning faster than the window allows; may run out before reset |
выше нормы — тратите быстрее лимита, можете упереться до сброса |
5h / 7d |
your two rolling subscription windows (5-hour and 7-day) |
два окна подписки (за 5 часов и за 7 дней) |
with cache / с кэшем |
token-equivalent with cache, calculated from real local counters and the extension's cache weights |
токен-эквивалент с кэшем, рассчитанный из реальных локальных счётчиков и весов кэша расширения |
without cache / без кэша |
the same session if cached input had been read fresh — a comparison number, not billing |
та же сессия, если бы ввод из кэша читался заново — число для сравнения, не биллинг |
work / работа |
raw input + output tokens (shown under Details) |
сырые токены ввода + вывода (в блоке «Детали») |
cache / кэш |
reused context — cheap reads, one-time writes |
переиспользованный контекст — дешёвое чтение, разовая запись |
ctx / конт / context / контекст |
how full the model's context window is now (input ÷ window limit) — tells you how big a next task can be; its dot is informational (🟢<40% · 🟡40–60% · 🔴60%+) and never tints the whole bar |
насколько заполнено контекстное окно модели сейчас (ввод ÷ лимит окна) — подсказывает, насколько большую задачу можно дать дальше; кружок информационный (🟢<40% · 🟡40–60% · 🔴60%+) и не красит весь бар |
| cache stays warm / кэш держится |
how long your prompt cache survives between one request and the next (1 hour or 5 minutes) — available for Claude Code; Codex does not expose this yet |
сколько кэш живёт между запросами (1 час или 5 минут) — доступно для Claude Code; Codex пока это не отдаёт |
| reloaded after pauses / повторная загрузка после пауз |
tokens spent loading a context again because its cache went cold during a wait — descriptive, never a grade |
токены, ушедшие на повторную загрузку контекста, чей кэш остыл за время паузы — описание, не оценка |
| input from cache / ввод из кэша |
share of the prompt served from cache (cheap) vs re-read fresh — higher = better reuse; descriptive, not a score |
доля промпта из кэша (дёшево) против повторного чтения — выше = лучше переиспользование; описание, не оценка |
| resets in / сброс через |
time until that window's usage resets to 0% |
время до обнуления окна |
Language / Язык
By default the plugin follows the editor's display language (English for an
English editor, Russian for a Russian one). To force a language, any of:
- Hover the status-bar item → click “🌐 Change language / Сменить язык” at
the bottom of the tooltip;
- Command Palette (
Ctrl/Cmd+Shift+P) → “Claude/Codex Statusbar: Switch
language”;
- Settings → search
ccStatusbar.language → auto / en / ru.
По умолчанию язык берётся из языка редактора. Сменить вручную: наведи курсор на
строку состояния и нажми «🌐 Сменить язык» внизу подсказки, либо палитра команд →
«Claude/Codex Statusbar: Switch language», либо Настройки → ccStatusbar.language.
How it gets data
Claude Code
Tokens / token-equivalent / cache — parsed from the local transcript
~/.claude/projects/<slug>/<session>.jsonl (+ its subagents/). No network,
zero token cost, independent of Anthropic auth.
Real quota — 5h, 7d, and the per-model weekly windows — read from four
independent sources, merged so the freshest valid reading wins (and once
any of them has ever succeeded the line is never blank again):
- The account's usage payload — zero token cost, every window at once.
GET /api/oauth/usage, the route Claude Code itself calls for its /usage
view, using your existing local OAuth token. A plain read: no message is
generated, so it costs nothing, and it is the only channel that
carries the per-model weekly windows (Fable). Polled on a fixed cadence —
once per quota.minPollSeconds (default 300s), whether or not you are
typing: it costs nothing, and the numbers you most need to watch are the
ones a long autonomous run is spending while you are away from the keyboard.
Open editor windows share one poll through
~/.claude/.cc-statusbar-usage-<account>.json (plus a short-lived claim
file beside it), so N windows make one request per interval, not N. The
name carries a fingerprint of your credentialsPath, so two windows on
different accounts never read each other's numbers. Undocumented route →
isolated in src/quota.ts + src/usage.ts; on any failure the sources
below take over unchanged.
- Passive local bridge — zero network, zero token cost. The companion
statusline.py (ships in this repo, optional — see
Optional: the local quota bridge)
mirrors the rate_limits that Claude Code already hands to
its statusLine hook into ~/.claude/.cc-statusbar-quota.json; the
extension just reads that file. This is the same real server data Claude
Code shows in its own usage view, obtained without any request of our own
— so it keeps working on links too weak for a network call to complete.
Terminal sessions only: the VS Code / Cursor integration runs Claude
Code without a status line, so an IDE-only session never feeds this file
and the network poll below is what keeps the limits current there. Works on
Windows, macOS, and Linux (it rides the official statusLine contract,
not any OS-specific keychain or in-process traffic interception).
- Header poll — the safety net. A tiny throttled request whose
anthropic-ratelimit-unified-* response headers carry 5h/7d. Costs ~1
token per poll, so it is skipped entirely while source 1 is delivering
those two windows — and resumes by itself the moment that route fails or
stops carrying them. Because it spends tokens it keeps the activity
gate (only polls while the session has been active in the last
quota.minPollSeconds) and honours a Retry-After verbatim. Clicking the
item overrides both.
- Claude Code's own on-disk copy — zero network. The CLI persists the
same usage payload in
~/.claude.json (cachedUsageUtilization). Read as
a last resort: it covers the first tick after a reload and any moment our
own request cannot get through. It is refilled when the CLI happens to
fetch usage, not on a timer, so it can be hours old — which is why a
per-model row older than 15 min states its age and one older than 24h is
hidden rather than presented as current.
Why four? Deliberate redundancy and coverage. The payload gives every window
live and free; the bridge gives a passive reading wherever the statusLine hook
runs; the header poll guarantees 5h/7d even if the payload route ever changes;
the on-disk copy covers cold starts and dead links. Together they stay
accurate on flaky links, in the terminal, and in the editor — across all three
OSes. Quota can be turned off entirely (ccStatusbar.quota.enabled: false) —
then only the free local metrics show.
Context limit — read once per model from the Anthropic Models API
(max_input_tokens, cached 24h). If it cannot be fetched, the % is hidden
instead of guessed.
Model — two local sources, no extra request:
- Confirmed (
◆) — the model field of the last assistant turn in the
main transcript. Subagent turns are excluded twice over (they live in
<session>/subagents/agent-*.jsonl and carry isSidechain), so a helper
model can never be shown as the one you are talking to. Placeholder turns
(<synthetic>) are ignored.
- Planned (
◇) — ANTHROPIC_MODEL, else the model key in Claude Code's
own settings (.claude/settings.local.json → .claude/settings.json →
~/.claude/settings.json, narrowest wins; an explicit "default" clears a
broader pin instead of deferring to it). Claude Code writes that key itself
when you pick a model in its VS Code picker, or via /model saved as the
default for new sessions. Used only for a chat that has never answered —
identified through Claude Code's live-session registry
(~/.claude/sessions/*.json, written when a chat opens, before any prompt):
a registered session with no transcript file has never replied. Nothing is
guessed: with no pinned model the line says default model instead of
inventing one.
The display name comes from the same Models API response already fetched for
the context limit (display_name); offline it is derived from the model id for
Anthropic's own id shapes, so the model shows instantly with no network at all.
Ids from other deployments (Bedrock ARNs, Vertex/Foundry names, private
aliases) are kept as they are, trimmed to their identifying tail — a
shortener guessing at them would produce a confident wrong name.
Effort — same two sources: the effort field of that same turn
(confirmed), or effortLevel / ultracode in Claude Code's settings
(planned). Nothing is shown when neither exists.
Subagents — each <session>/subagents/agent-*.jsonl plus its sibling
agent-*.meta.json (agent type, task description, spawn depth and parent).
Model, effort and tokens come from the agent's own turns. Parsed once and cached
by mtime+size of BOTH files, so a session with dozens of agents costs nothing on
the redraw tick, and a description written after the log still shows up.
Codex
- 5h/7d quota — read from the local Codex app-server
(
account/rateLimits/read) using the Codex/OpenAI auth that Codex already
uses.
- Current Codex thread — matched to the open workspace by
cwd through
thread/list / thread/loaded/list.
- Context and cached input — read from Codex token counters in local Codex
history (
~/.codex/sessions/...jsonl, token_count) and from app-server
token-usage notifications when available.
- Priced once, where OpenAI says it belongs — the cache-write counter
(
cache_write_input_tokens) is a breakdown of the input count, not an extra
beside it. OpenAI documents the split as
ordinary = input − cached − cache_write, so the extension prices each of the
three buckets once: ordinary input at 1×, cached reads at your read weight,
writes at your write weight. Details shows the count Codex itself reports,
not the part of it that could be priced.
- Not guessed — Codex exposes no cache tier and no money price, so a write
can only be priced by the unstated-tier setting, and the tier line is shown as
unavailable rather than invented. The extension labels the top number as
token-equivalent, not billing.
Privacy / security
No telemetry, no extension-owned server, and no analytics.
- For Claude Code, your OAuth token (
~/.claude/.credentials.json) is used
only to call Anthropic's own API for quota/context metadata. Local transcript
parsing stays on your machine.
- For Codex, the extension talks to the local Codex app-server/CLI using the
Codex/OpenAI login that Codex already has. Local Codex session files are read
only for token counters.
The code is small and MIT-licensed — read src/quota.ts (the two network
requests), src/usage.ts (usage-payload shapes + the on-disk copy),
src/localQuota.ts (passive statusLine bridge), src/transcript.ts, and
src/codexAppServer.ts to verify.
Install
From the Marketplace (recommended): search “Claude/Codex Usage”
in the Extensions view, or run code --install-extension solux-dev.cc-statusbar.
Updates arrive automatically.
Build locally (for development):
npm install
npm run compile
npm run package        # produces cc-statusbar-<version>.vsix
code --install-extension cc-statusbar-<version>.vsix
Reload VS Code. The item appears on the right of the status bar.
Optional: the local quota bridge (terminal sessions)
You do not need this. Quota already works out of the box over the network.
This adds a zero-request path that keeps working on links too weak for a
network call to complete — useful on phone tethering or a flaky connection.
Claude Code hands its statusLine hook the real 5h/7d limits on stdin, read
from the headers of its own ongoing traffic. The extension cannot see that
stdin, so statusline.py mirrors those limits into
~/.claude/.cc-statusbar-quota.json, which the extension reads locally.
Copy statusline.py to ~/.claude/statusline.py.
Point Claude Code's statusLine at it in ~/.claude/settings.json:
{
  "statusLine": {
    "type": "command",
    "command": "python ~/.claude/statusline.py"
  }
}
Start a terminal claude session and send one message. The file appears
after the first reply, and the extension picks it up on its next tick.
Requires Python 3.8+, no third-party packages, works on Windows, macOS and
Linux. The script also prints a compact status line of its own (model, context
fill, both quota windows). Already have a statusLine script? Keep it — copy
just dump_quota_bridge() and its call at the end of main() into yours; the
bridge is independent of whatever your script prints.
Terminal sessions only. The VS Code / Cursor integration runs Claude Code
without a status line, so an IDE-only session never triggers the script; there
the network sources keep the limits current.
Settings (ccStatusbar.*)
| Key |
Default |
Meaning |
provider |
auto |
Usage source: auto / claude / codex; also switchable from the hover menu |
language |
auto |
Plugin language: auto (follow editor) / en / ru |
enabled |
true |
Show the item |
refreshSeconds |
10 |
Redraw interval |
alignment |
right |
Status-bar side |
cacheReadWeight |
0.1 |
weight for cache read in the cache-weighted cost |
cacheWriteWeight |
1.25 |
weight for a cache write whose TTL tier the transcript does not state; a stated tier is priced at the real tariff (1-hour ×2.0, 5-minute ×1.25) |
quota.enabled |
true |
Fetch real quota — 5h/7d + per-model weekly (free in the steady state) |
quota.minPollSeconds |
300 |
Min seconds between quota calls |
credentialsPath |
"" |
Override credentials file location |
codex.commandPath |
"" |
Optional Codex CLI path; empty = auto-detect OpenAI/ChatGPT VS Code extension, npm global install, or PATH |
context.enabled |
true |
Show how full the model's context window is now (Models API, cached 24h) |
model.enabled |
true |
Show which model and effort level the session runs on at the start of the line (◆ confirmed / ◇ planned), and flag a switch until the next reply |
subagents.enabled |
true |
Show the delegated-work breakdown (tooltip line + panel section). Session totals include subagents either way |
Reliability — what can temporarily break (important)
The plugin has two parts with different reliability:
- Local metrics (
work / token-equivalent / cache / savings) are read from
the local transcript files. They always work and depend on nothing
external.
- The real 5h/7d quota comes from the four independent sources listed
above: the account usage payload, the passive statusLine bridge, the header
poll, and Claude Code's own on-disk copy. Three of them are undocumented
Anthropic surfaces that can change without notice — but they fail
independently and the freshest valid reading wins, so one breaking is
invisible to you. Only when all four fail does the tariff stop being live,
and even then the plugin does not break: local metrics keep working, the bar
says
$(cloud-offline) quota offline, and the hover shows the last known
reading with its age — an old number is never presented as current. The
quota code is isolated in src/quota.ts, src/usage.ts and
src/localQuota.ts, so a fix is a small, contained patch.
- The per-model weekly rows (e.g.
Fable (7d)) come from the usage payload
only — no other source carries them. If that route changes, those rows
disappear while 5h/7d stay live on the remaining sources.
- The context-window % depends on one external channel: the model's window
limit read from the Anthropic Models API with your local OAuth token (cached
24h). If that channel changes, only the context line hides (the % is never
guessed) — local metrics are unaffected. The fix is likewise isolated to
src/quota.ts.
- Codex support depends on the local Codex app-server and local Codex session
history. If app-server is unavailable, the Codex tariff can temporarily show as
unavailable; if token counters are not present yet, context/cache appear after
the next Codex response. What Codex does not expose — the cache tier — is
shown as unavailable rather than guessed. Its cache-write counter is shown as
stated and priced in the token-equivalent, at the write weight: OpenAI
documents it as a part of the input count, so it is counted once rather than
twice. A payload that states no write count at all is not read as zero — the
ⓘ then says which way the figure could move, and that is your write weight's
answer: above 1 it is a floor, below 1 a ceiling, at exactly 1 it cannot move.
A negative count is not a count at all and is treated as unstated, never as a
stated zero.
What the user does: nothing. When the channel changes, a fix is released and
— if installed from the Marketplace — arrives as an automatic update.
This is a best-effort tool, distributed under the MIT license "as is",
without warranty. Tariff problems are usually not the plugin's fault but a
change on Anthropic's side, and are resolved by an update.
Known behaviour (not bugs)
- Works in VS Code forks (Cursor, Windsurf, VSCodium, …) — it uses only core
VS Code APIs and local provider files/app-server APIs, which are
editor-independent.
- Same folder open in two editors at once: Claude Code stores transcripts
per folder, not per editor, and the plugin shows the most recently active
session for the open folder. So if you have the same folder open in, say, VS
Code and Cursor, both windows show whichever session you typed in last — the
context % can appear to "jump" between them. In normal use (one editor per
folder) this never happens.
- Context limit "n/a" right after install: the context-window limit is
fetched once from the Models API; until that first lookup succeeds the
ctx
line may briefly read (limit n/a). It resolves itself on the next successful
lookup — no action needed.
Found a wrong number? Say so
A figure that disagrees with reality is the most valuable bug report this
project can get — the whole point of the extension is that its numbers can be
trusted. There is a “Report an issue” link at the foot of the panel and in
the hover, or start here:
License
MIT.

