PHP Profiler Pro +Support for PHP (Xdebug) profiling files and inspecting them. Installation Launch VS Code Quick Open ( Ctrl+P), paste the following command, and press enter.Copied to clipboard |
PHP Profiler for Visual Studio Code
Open, view, and analyze Xdebug profile files in the cachegrind format. The extension also highlights hot paths in your source code based on profiling results. Discover more features in the sections below. OverviewPHP code profiling enables you to analyze the execution time and call count for every function in your codebase.
This extension allows you to inspect Xdebug profile files containing PHP code performance metrics. It works seamlessly in combination with PHP Tools for Visual Studio Code. Debug, profile, and analyze profiling results directly within Visual Studio Code. Quick Setup for PHP Profiling
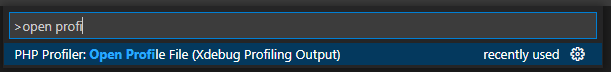
Opening Profiling ResultsOpen the file containing your profiling data. By default, profile files are named Using the Command Palette
Drag & Drop "cachegrind.out.*.gz" File Alternatively, if your profile file follows the
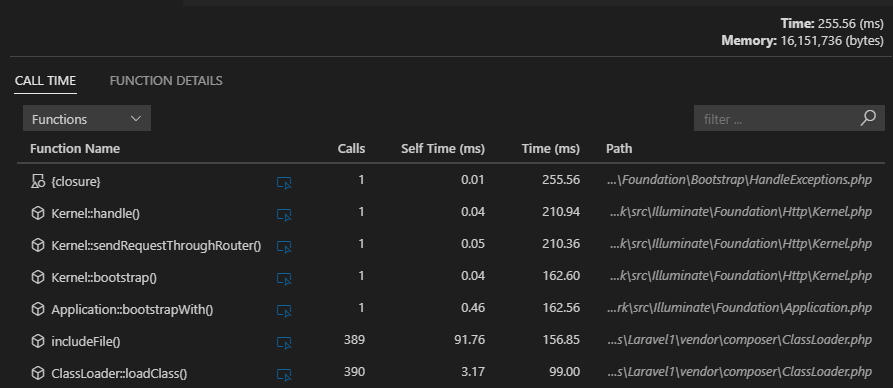
Inspecting Call TimesThe following view displays all functions with their call counts (Calls), time spent within the function body (Self Time), and total time including nested function calls (Time).
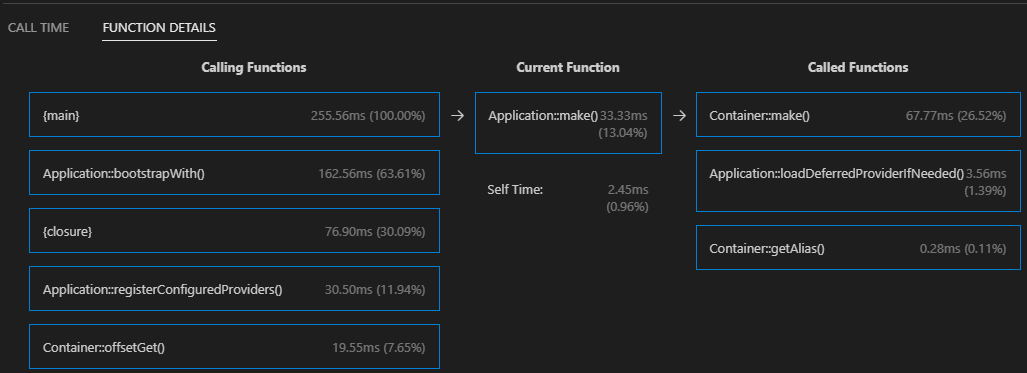
Inspecting Callers and CalleesThe Function Details view focuses on a single function, displaying all calling functions (callers) and all called functions (callees), along with their respective timing information.
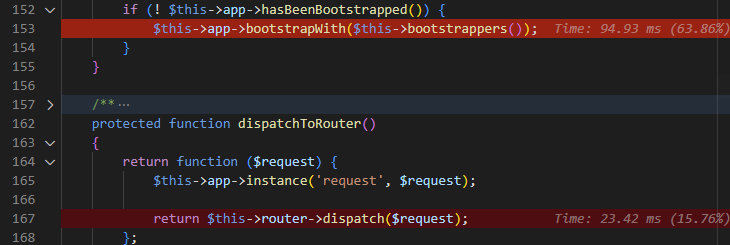
Highlighting Hot PathsThe loaded profiling result file is automatically analyzed, and hot paths are highlighted directly in your source code. You can toggle this highlighting on or off in the profiling result view.
See Also
Notes
|