Pointbreak
AI guesses. Pointbreak knows.


AI assistants can write code. Now they can debug it too.
See execution, not speculation. Pointbreak enables AI assistants to control your VS Code debugger through natural language. Set breakpoints, step through code, and inspect variables—all through AI.
What is Pointbreak?
Pointbreak is a bridge between AI assistants (like Claude Code, Cursor, Cline) and your IDE's native debugger. Your AI assistant can now:
- 🎯 Set breakpoints through natural language ("break on line 42")
- 🔍 Inspect variables while your code runs ("show me user_input")
- 🪜 Step through execution ("step into this function")
- 🐛 Find bugs by actually running and examining your code
Quick Start
Install this extension in VS Code or Cursor
Use an MCP-compatible AI assistant (Claude Code, Cursor, Cline, Zed)
Ask your AI to debug your code
"Set a breakpoint on main.rs line 42 and start debugging"
Watch as breakpoints appear and your debugger runs automatically
That's it. Your AI assistant now controls your debugger.
Example Usage
User: "Debug this test and tell me why user_input is empty"

AI: Setting breakpoint at line 15... Starting debugger...
    [Breakpoint appears in VS Code]
    [Debug session starts]
    [Code pauses at breakpoint]

    Found it! You're reading user_input before prompting the user.
    The input happens on line 18, but you're using it on line 15.
    Move the prompt above the read.
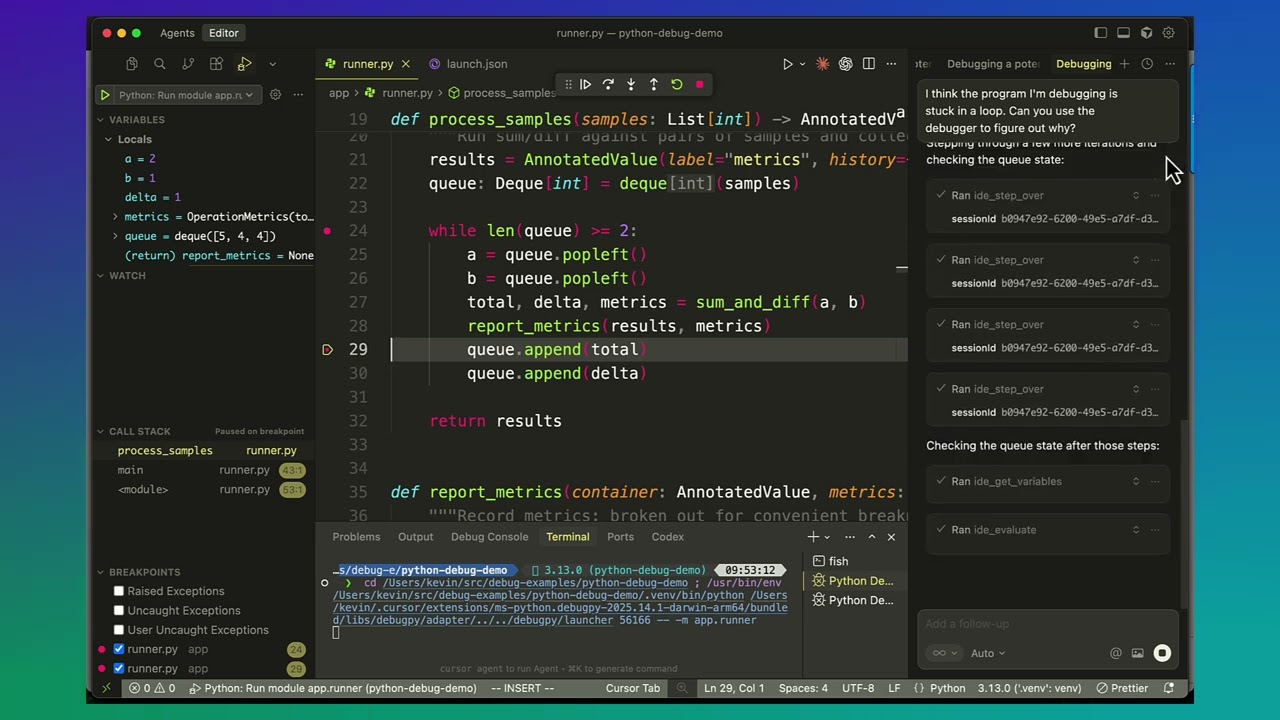
See It In Action
Watch Pointbreak debug a Python application:


Full demo video (60s):
Supported AI Assistants
Pointbreak works with any MCP-compatible AI assistant:
- Claude Code - Anthropic's official CLI for Claude
- Cursor - AI-first code editor
- Cline - VS Code extension for Claude
- Zed - Collaborative code editor
- Any MCP client - Supports the Model Context Protocol
Supported Languages
Pointbreak works with any language your IDE can debug:
- Rust, C, C++ (via CodeLLDB)
- Python (via debugpy)
- JavaScript, TypeScript (via Node Debug / VS Code JS Debug)
- Go (via Delve)
- And more - Any language with a Debug Adapter Protocol implementation
How It Works
Pointbreak bridges AI assistants to your IDE's native debugger:
┌─────────────┐      MCP          ┌──────────────┐      VS Code API      ┌─────────────┐
│     AI      │  ─── Protocol ──► │  Pointbreak  │  ─────────────────►   │   Native    │
│  Assistant  │                   │  Extension   │                       │  Debugger   │
└─────────────┘                   └──────────────┘                       └─────────────┘
Key insight: Instead of building a new debugger, Pointbreak uses your IDE's existing debugger. You get all your installed debug adapters, breakpoint UI, and variable inspection—but now controllable through AI.
Features
Turn guesses into proof, without breaking stride. Pointbreak gives AI assistants real execution data—variables, stack traces, breakpoints—so you get faster, more accurate debugging without context switching.
For Users
- ✅ Evidence-based debugging - AI analyzes actual runtime behavior, not educated guesses
- ✅ Natural language interface - No commands to memorize, just ask
- ✅ Real-time collaboration - Breakpoints sync between AI and VS Code UI
- ✅ Universal language support - Works with all languages your IDE debugs
- ✅ Zero code modification - No console.log debugging required!
For Developers
- 🔧 Full debugger control through MCP protocol
- 🔧 Set breakpoints, step through code, inspect variables
- 🔧 Evaluate expressions in paused execution context
- 🔧 Watch expressions that persist across debug sessions
- 🔧 Access stack traces, scopes, threads, and more
Getting Started with AI Assistants
Using Claude Code
If you're using Claude Code (recommended), the extension works automatically:
- Install this extension in VS Code
- Open your project in VS Code
- Start Claude Code in the integrated terminal
- Ask Claude to debug your code
Claude will automatically connect to Pointbreak and control your debugger.
Using Cursor
If you're using Cursor, Pointbreak is auto-registered as an MCP server:
- Install this extension in Cursor
- Use Cursor's AI to debug your code
- Breakpoints and debug sessions sync automatically
Using Other MCP Clients
For other MCP clients, configure them to use the Pointbreak MCP server:
{
  "mcpServers": {
    "pointbreak": {
      "command": "pointbreak",
      "args": ["mcp", "serve"]
    }
  }
}
The extension automatically spawns the MCP server when needed.
Configuration
The extension includes several optional configuration settings:
pointbreak.bridge.enabled
Enable or disable the Pointbreak debug bridge.
- Type:
boolean
- Default:
true
pointbreak.binaryPath
Custom path to the Pointbreak binary. Leave empty to use the bundled binary.
- Type:
string
- Default:
"" (uses bundled binary)
pointbreak.useGlobalCli
Prefer globally installed pointbreak CLI over bundled binary.
- Type:
boolean
- Default:
false
Advanced Settings
For rate limiting and connection management:
pointbreak.bridge.port - WebSocket server port (0 for auto)pointbreak.bridge.maxConnections - Max simultaneous connections (default: 32)pointbreak.bridge.requestsPerSecond - Request rate limit per session (default: 60)pointbreak.bridge.maxRequestBodyMB - Max request body size in MB (default: 10)
Most users won't need to change these settings.
Commands
Access via Command Palette (Cmd+Shift+P / Ctrl+Shift+P):
- Shows which Pointbreak binary is being used
- Displays version information
- Useful for troubleshooting
Troubleshooting
AI assistant can't find Pointbreak
Solution: Make sure this extension is installed and enabled. Check the Output panel (View → Output → "Pointbreak MCP Server") for logs.
Breakpoints not appearing in IDE
Solution: The AI may need to explicitly set breakpoints before starting the debug session. Try asking: "Set a breakpoint at line X before starting the debugger."
Debug session won't start
Solution:
- Ensure you have the appropriate debug adapter installed (e.g., CodeLLDB for Rust)
- Check that your launch configuration is correct
- Try starting debugging manually first to verify it works
AI suggests adding console.log instead of using debugger
Solution: This extension includes anti-print-debugging guidance. If the AI still suggests prints, be explicit: "Use the debugger to investigate" or "Set a breakpoint and step through."
Privacy & Security
Pointbreak runs entirely locally on your machine:
- No code is sent to external servers
- No telemetry or analytics
- All debugging happens through your local IDE
- MCP communication is local-only (via terminal or WebSocket on localhost)
Contributing
Pointbreak is proprietary software. We welcome community input through:
- 🐛 Bug reports - Help identify and fix issues
- 💡 Feature requests - Share your ideas for improvements
- 📝 Documentation improvements - Suggest clearer explanations
- 💬 Discussions - Share your use cases and experiences
Please visit the main repository to file issues or start discussions.
License
Proprietary License - see LICENSE for details.
Copyright (c) 2025 Kevin Swiber. All rights reserved.
Note: This extension is free to use, but the source code is proprietary and not open source.
Made with ❤️ for developers who want AI that can actually debug their code.
