GraphifyStats


Monitor your Graphify knowledge graph stats right
inside the VS Code status bar. See node count, edge count, community info,
god nodes, graph health, and when Graphify was last triggered by your AI
coding assistant — all without leaving the editor.
Works with every AI coding agent that runs Graphify: Claude Code, Codex,
GitHub Copilot, Cursor, Gemini CLI, OpenCode, Windsurf, Cline, Continue
(DeepSeek, Qwen, and other open models), and more.
✨ What's new in 2.0
- One command, every agent — "GraphifyStats: Add Agent Instructions to
Workspace" writes ready-to-use Graphify rules for all major coding agents:
AGENTS.md, CLAUDE.md + a Claude Code skill, Copilot instructions, Cursor,
Windsurf, Cline, and Continue rules, and GEMINI.md. Your own notes in those
files stay untouched, and one re-run refreshes everything.
- Watch your agent work, live — a spinner appears in the status bar while
graphify update . runs, so a 2-minute rebuild is never a silent black box.
- Activity log on hover — the tooltip shows the last 3 graph refreshes and
the last 5 agent commands, including which agent ran what.
- Multi-root workspaces — GraphifyStats finds the folder that holds your
graph and follows your active editor.
- Remote-ready — instant change detection in Remote SSH, WSL, Dev
Containers, and Codespaces.
- Sharper feedback — node/edge deltas and the green glow after every graph
update, with timestamps that age in real time.
Version 2.0 is fully backward compatible — existing setups keep working unchanged.

Features
- Live graph stats in the status bar — node/edge counts with delta tracking
- LLM activity signaling — your LLM touches a file; the status bar glows green
- Health scoring — Excellent / Good / Fair / Poor based on ambiguous edge ratio
- Density labels — Sparse / Typical / Dense alongside raw density
- Confidence-weighted god nodes — EXTRACTED edges weighted higher than INFERRED/AMBIGUOUS
- Live "running" spinner — agents that write the optional activity-event JSON
get a spinner while
graphify update runs, instead of a silent 2-minute wait
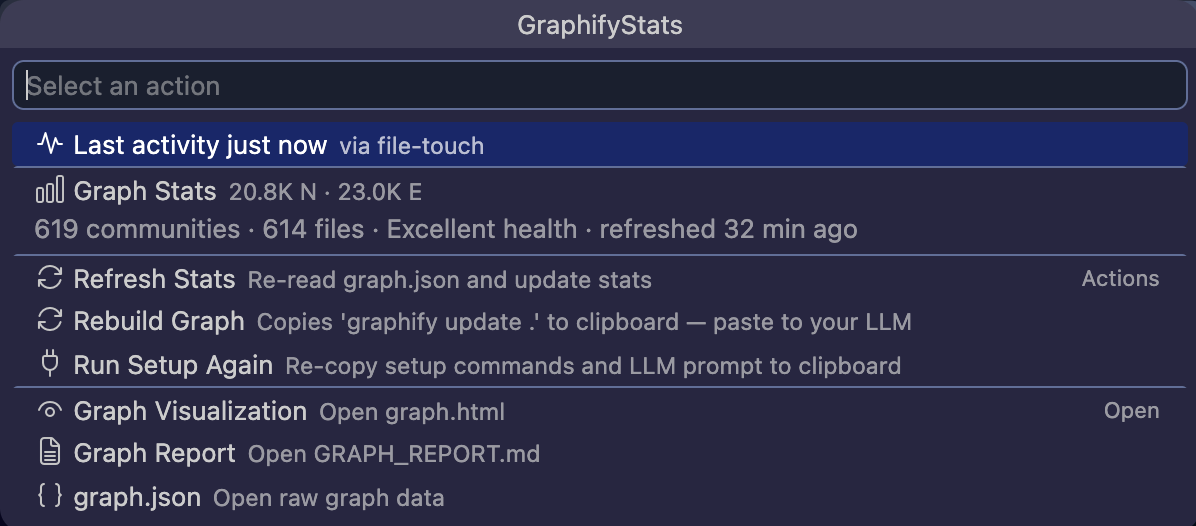
- Compact hover tooltip — hover for communities, file count, god nodes, health,
the last 3 graph refreshes, and the last 5 agent uses
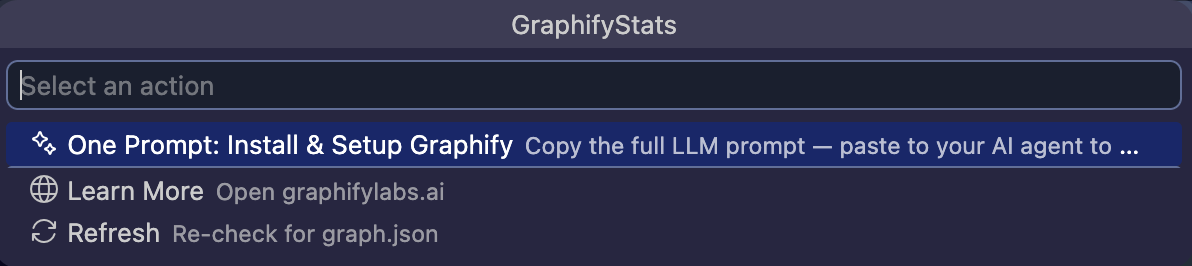
- QuickPick command palette — click the status bar to
refresh stats, rebuild graph, run setup again, or open visualization
- Graph.json change detection — VS Code
FileSystemWatcher (works in remote,
WSL, and virtual workspaces) with fs.watch fallback, onDidSaveTextDocument
for in-editor saves, and polling as backstop
- Multi-root aware — monitors the workspace folder that actually contains a
graph, following your active editor
- Zero runtime dependencies — built entirely on the VS Code Extension API
and Node.js built-in modules
Works with every coding agent
There is no single "skill" format that every VS Code AI agent reads — each tool
discovers workspace instructions differently. GraphifyStats solves this with one
canonical instruction file (shipped with the extension) and thin per-agent
adapters generated from it.
Run "GraphifyStats: Add Agent Instructions to Workspace" from the command
palette (or QuickPick → Add Agent Instructions) and pick your agents:
| File |
Read by |
AGENTS.md |
Codex, OpenCode, Copilot, Cursor, Amp, Jules, and others |
CLAUDE.md |
Claude Code (loaded every session) |
.claude/skills/graphify/SKILL.md |
Claude Code skill (loaded on demand) |
.github/copilot-instructions.md |
GitHub Copilot Chat & coding agent |
.cursor/rules/graphify.mdc |
Cursor |
GEMINI.md |
Gemini CLI / Gemini Code Assist |
.windsurf/rules/graphify.md |
Windsurf |
.clinerules/graphify.md |
Cline / Roo Code (DeepSeek, Qwen, …) |
.continue/rules/graphify.md |
Continue (DeepSeek and other open models) |
The generated content sits between graphify-stats:instructions markers, so
your own notes in those files are preserved and re-running the command after an
extension update refreshes only the managed block.
The activity protocol itself is tool-neutral: any agent that can run shell
commands touches graphify-out/.graphify-activity before each Graphify
command, and agents with VS Code command access can call
graphify-stats.indicateActivity instead. No vendor APIs involved.
Usage
The status bar shows: $(graph) Graphify: 1.2K N (+12) · 890 E · 5m · 2m
- Green glow = graph was recently updated or your LLM just used Graphify
- Delta brackets (+12 / -3) = node/edge changes after
graphify update (auto-hide after 30s)
- Warning color = graph is stale (>1h) or has high ambiguity (>30%)
- Error color = graph is very stale (>6h)
- Trigger time = how long ago your LLM last used Graphify (e.g.
2m)
- Click for QuickPick actions (Refresh, Rebuild, Run Setup Again, View Graph, etc.)
How it works
- Extension detects
graphify-out/graph.json via workspaceContains activation event
- Watches
graphify-out/ in every workspace folder with VS Code's FileSystemWatcher
(falling back to fs.watch locally), plus a 5s poll as backstop
- A marker file at
~/.graphify-stats/configured signals that activity monitoring is set up
- The LLM touches
graphify-out/.graphify-activity before each graphify command
- Extension detects the touch and turns the status bar green
- Optionally, the LLM overwrites
graphify-out/.graphify-activity.json with a v1 event
({"v":1,"status":"start"|"done"|"error","command":...,"agent":...,"startedAt":...,"completedAt":...})
— the status bar then shows a live spinner while the command runs, and the tooltip
records which agent ran what
onDidSaveTextDocument triggers immediate re-read when graph.json is saved in-editor
Troubleshooting
Activity not triggering?
- Verify
~/.graphify-stats/configured exists (created during setup)
- Verify
graphify-out/.graphify-activity exists in your workspace
- Check the extension's output channel: View → Output → graphify-stats
- Re-run setup via QuickPick → Run Setup Again
Parse errors?
graph.json may be malformed or being written mid-read. The extension retries automatically.- If the file is >50 MB, only a summary is shown (by design).
"Polling stalled" warning?
- The extension suspends polling after consecutive failures. Reopen the workspace or click Refresh.
Setup notification won't reappear?
- The notification shows once per VS Code installation. Use QuickPick → Run Setup Again to access it anytime.
Commands
The extension contributes these commands (usable via Cmd+Shift+P or keybindings):
| Command |
Description |
graphify-stats.click |
Open the QuickPick command palette |
graphify-stats.indicateActivity |
Signal Graphify activity (for LLMs with VS Code command access). Accepts { command: "graphify query" } to record which command was used. |
graphify-stats.getState |
Return current state as JSON (configured, activityActive, nodeCount, edgeCount, etc.) |
graphify-stats.installAgentInstructions |
Write or refresh Graphify rules for your coding agents (AGENTS.md, CLAUDE.md, Copilot, Cursor, Gemini, Windsurf, Cline, Continue) |
Requirements
- VS Code 1.85+
- Graphify installed
- A
graphify-out/graph.json file in your workspace
Configuration
| Setting |
Default |
Description |
graphify-stats.pollInterval |
5 |
Seconds between stat refreshes |
graphify-stats.activityIndicator.enabled |
true |
Enable green glow on activity |
graphify-stats.activityIndicator.durationSeconds |
30 |
How long green glow stays |
Privacy
This extension reads only local files in your workspace (graphify-out/).
No network calls, no telemetry, no third-party services.
License
MIT
| |
