Claude Trace: Cost, Sessions & Agent Workflows for Claude CodeCost dashboard, multi-session terminal cockpit, visual agent workflows, and a skills and agents library for Claude Code. Track spend, run many sessions at once, orchestrate agents on your subscription, and manage every skill and agent in one place. Nothing leaves your machine. Installation Launch VS Code Quick Open ( Ctrl+P), paste the following command, and press enter.Copied to clipboard |

Claude Trace
A cost dashboard, a multi-session terminal cockpit, a visual agent workflow builder, and a home for your skills and agents. All for Claude Code, inside VS Code, reading the session logs Claude Code already writes to your disk. Nothing leaves your machine.
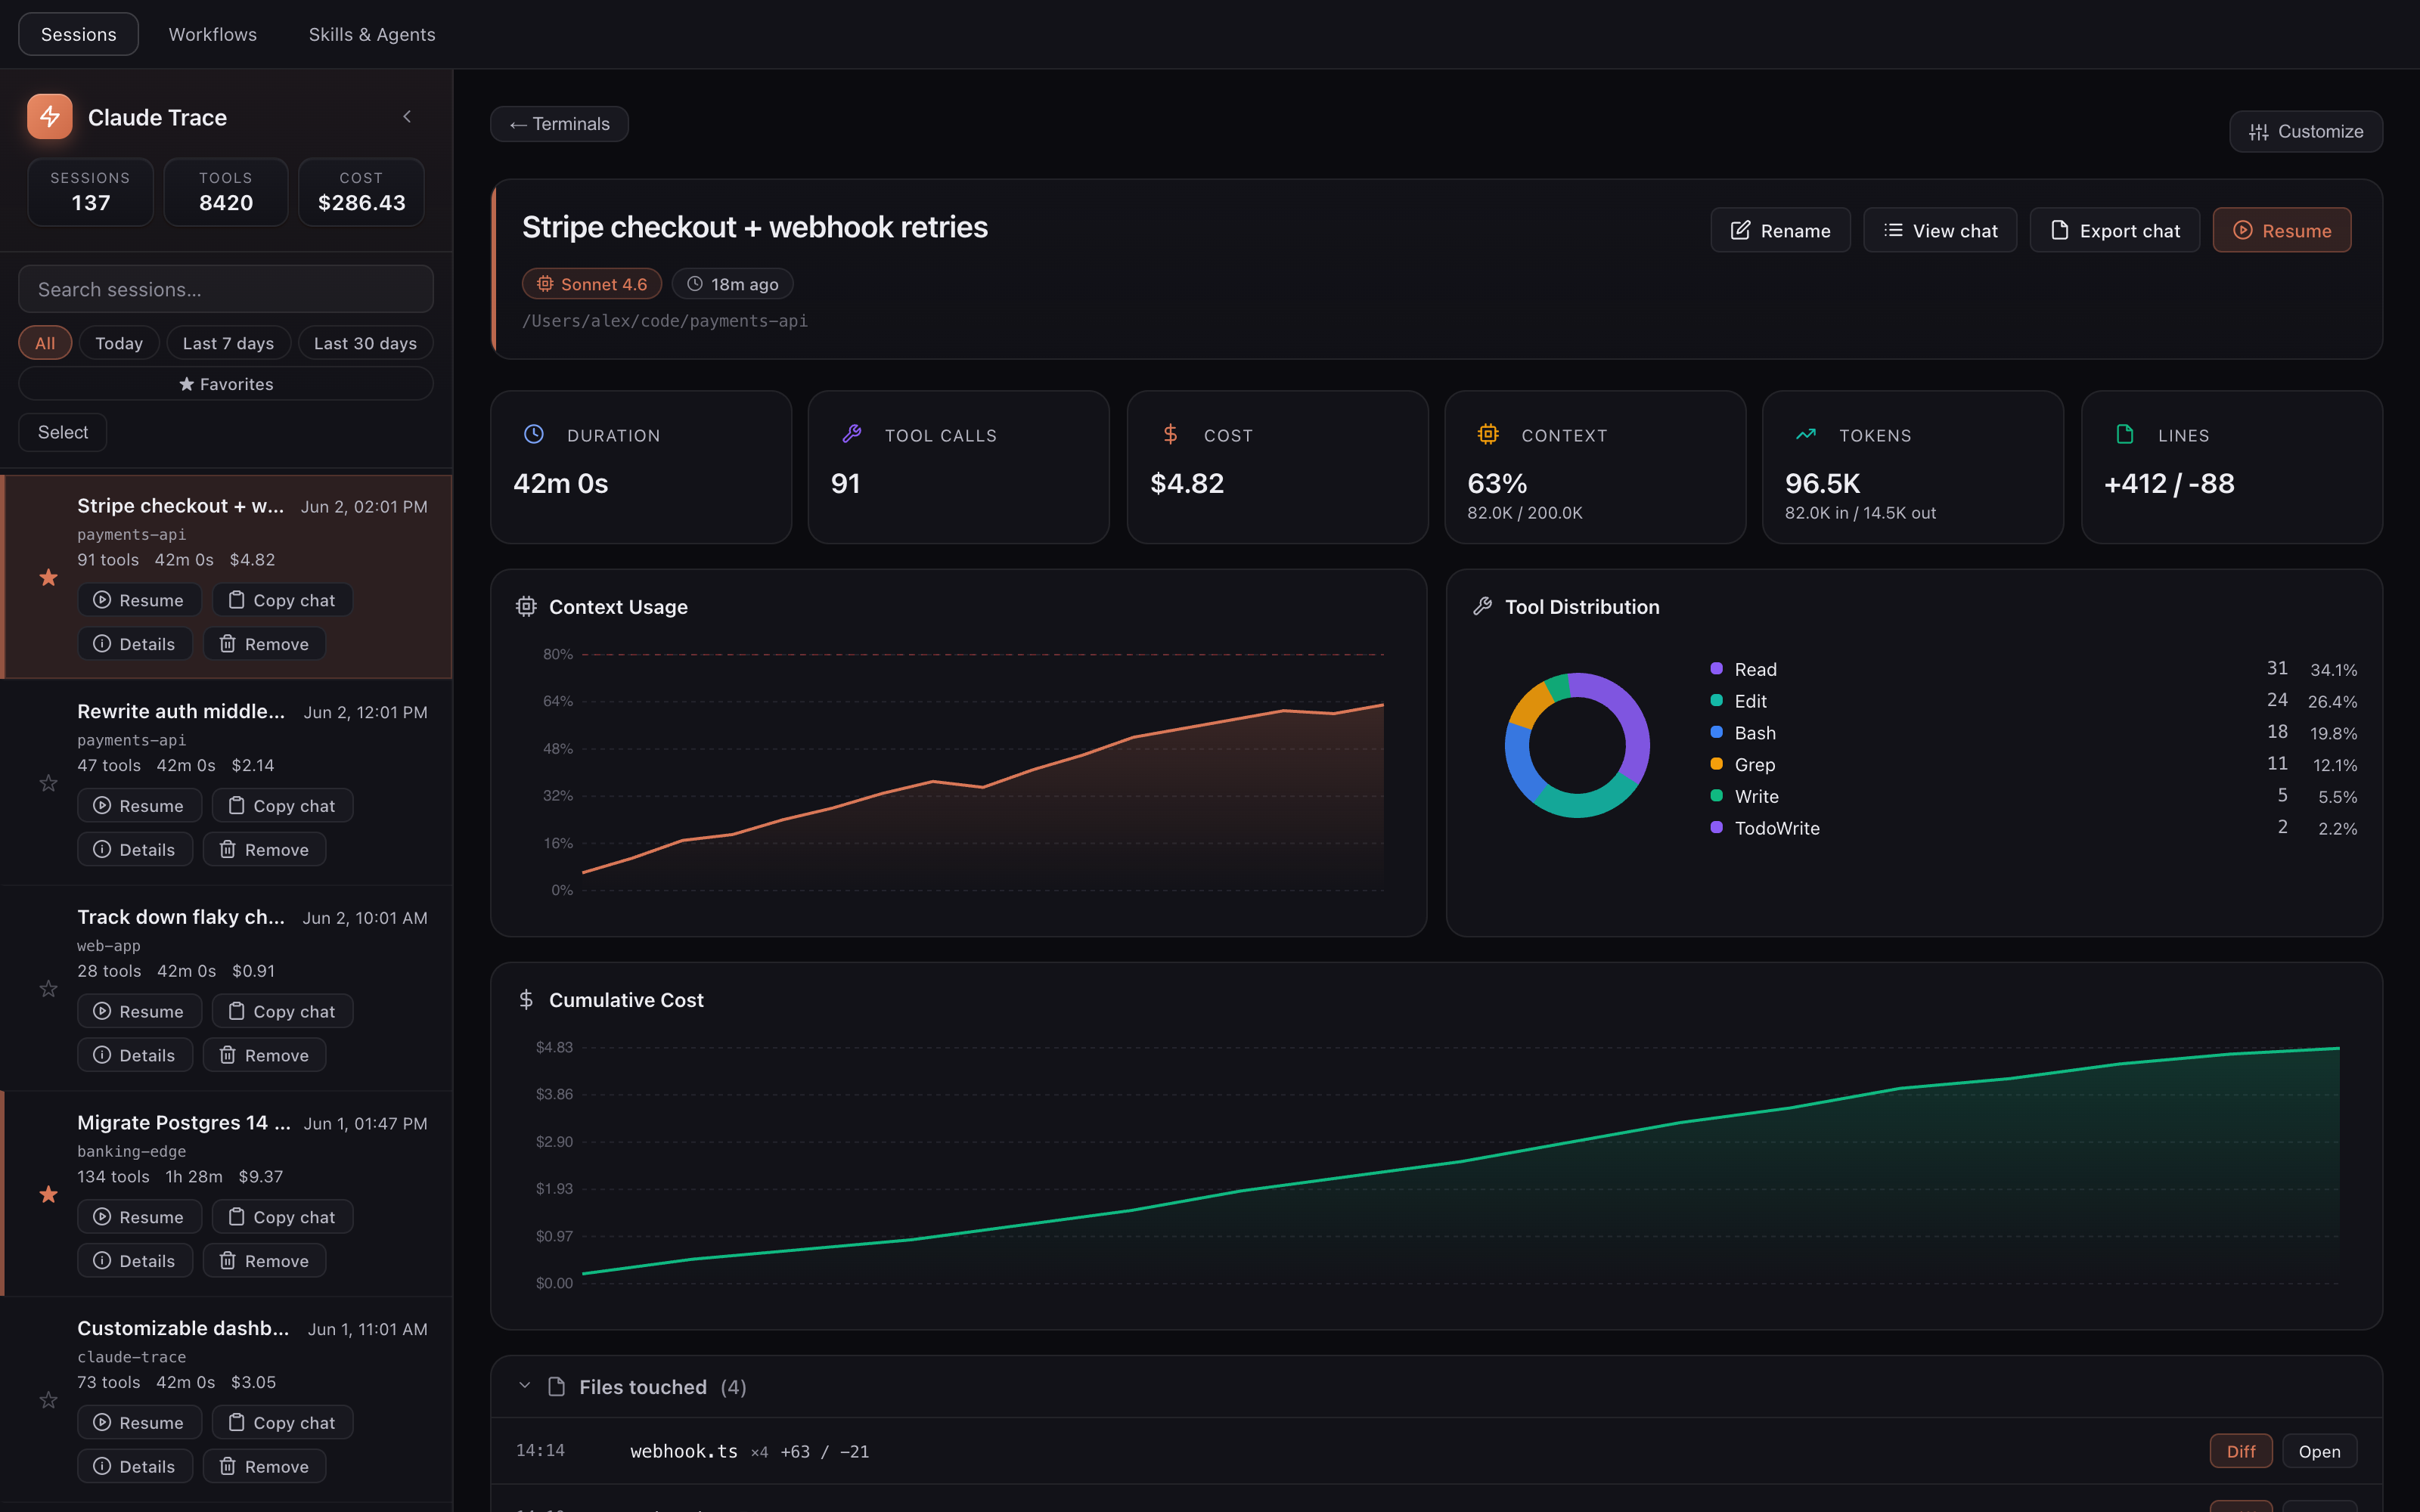
The problemClaude Code is a black box about three things. You don't see what a session costs until the bill arrives, and Anthropic's usage page can lag by days. Someone left a session running overnight recently and woke up to a $6,000 charge with no live counter to warn them. When you keep four sessions open for four branches, they all look the same and you lose track of which one is doing what. And there is no built in way to chain agents together so one's output feeds the next. Claude Trace fixes all three from one panel. Press No config, no hooks, no API keys. See what every session costsThe status bar shows what you spent today. It turns amber at 80 percent of your daily budget and red when you cross it. Set a per session or per day cap and it actually fires. Open any session and you get the full picture: cost over time, context window usage with a warning line at 80 percent, a breakdown of every tool call, and the files Claude touched. The diffs survive after the terminal closes, the context compacts, or the laptop reboots, so you can review what changed whenever you get to it. Cross project search, date filters, pinned favorites, and custom names turn Cost is computed locally from the token counts in the transcript, at current Anthropic rates, including the 5 minute and 1 hour cache write tiers. Run a cockpit of Claude sessions
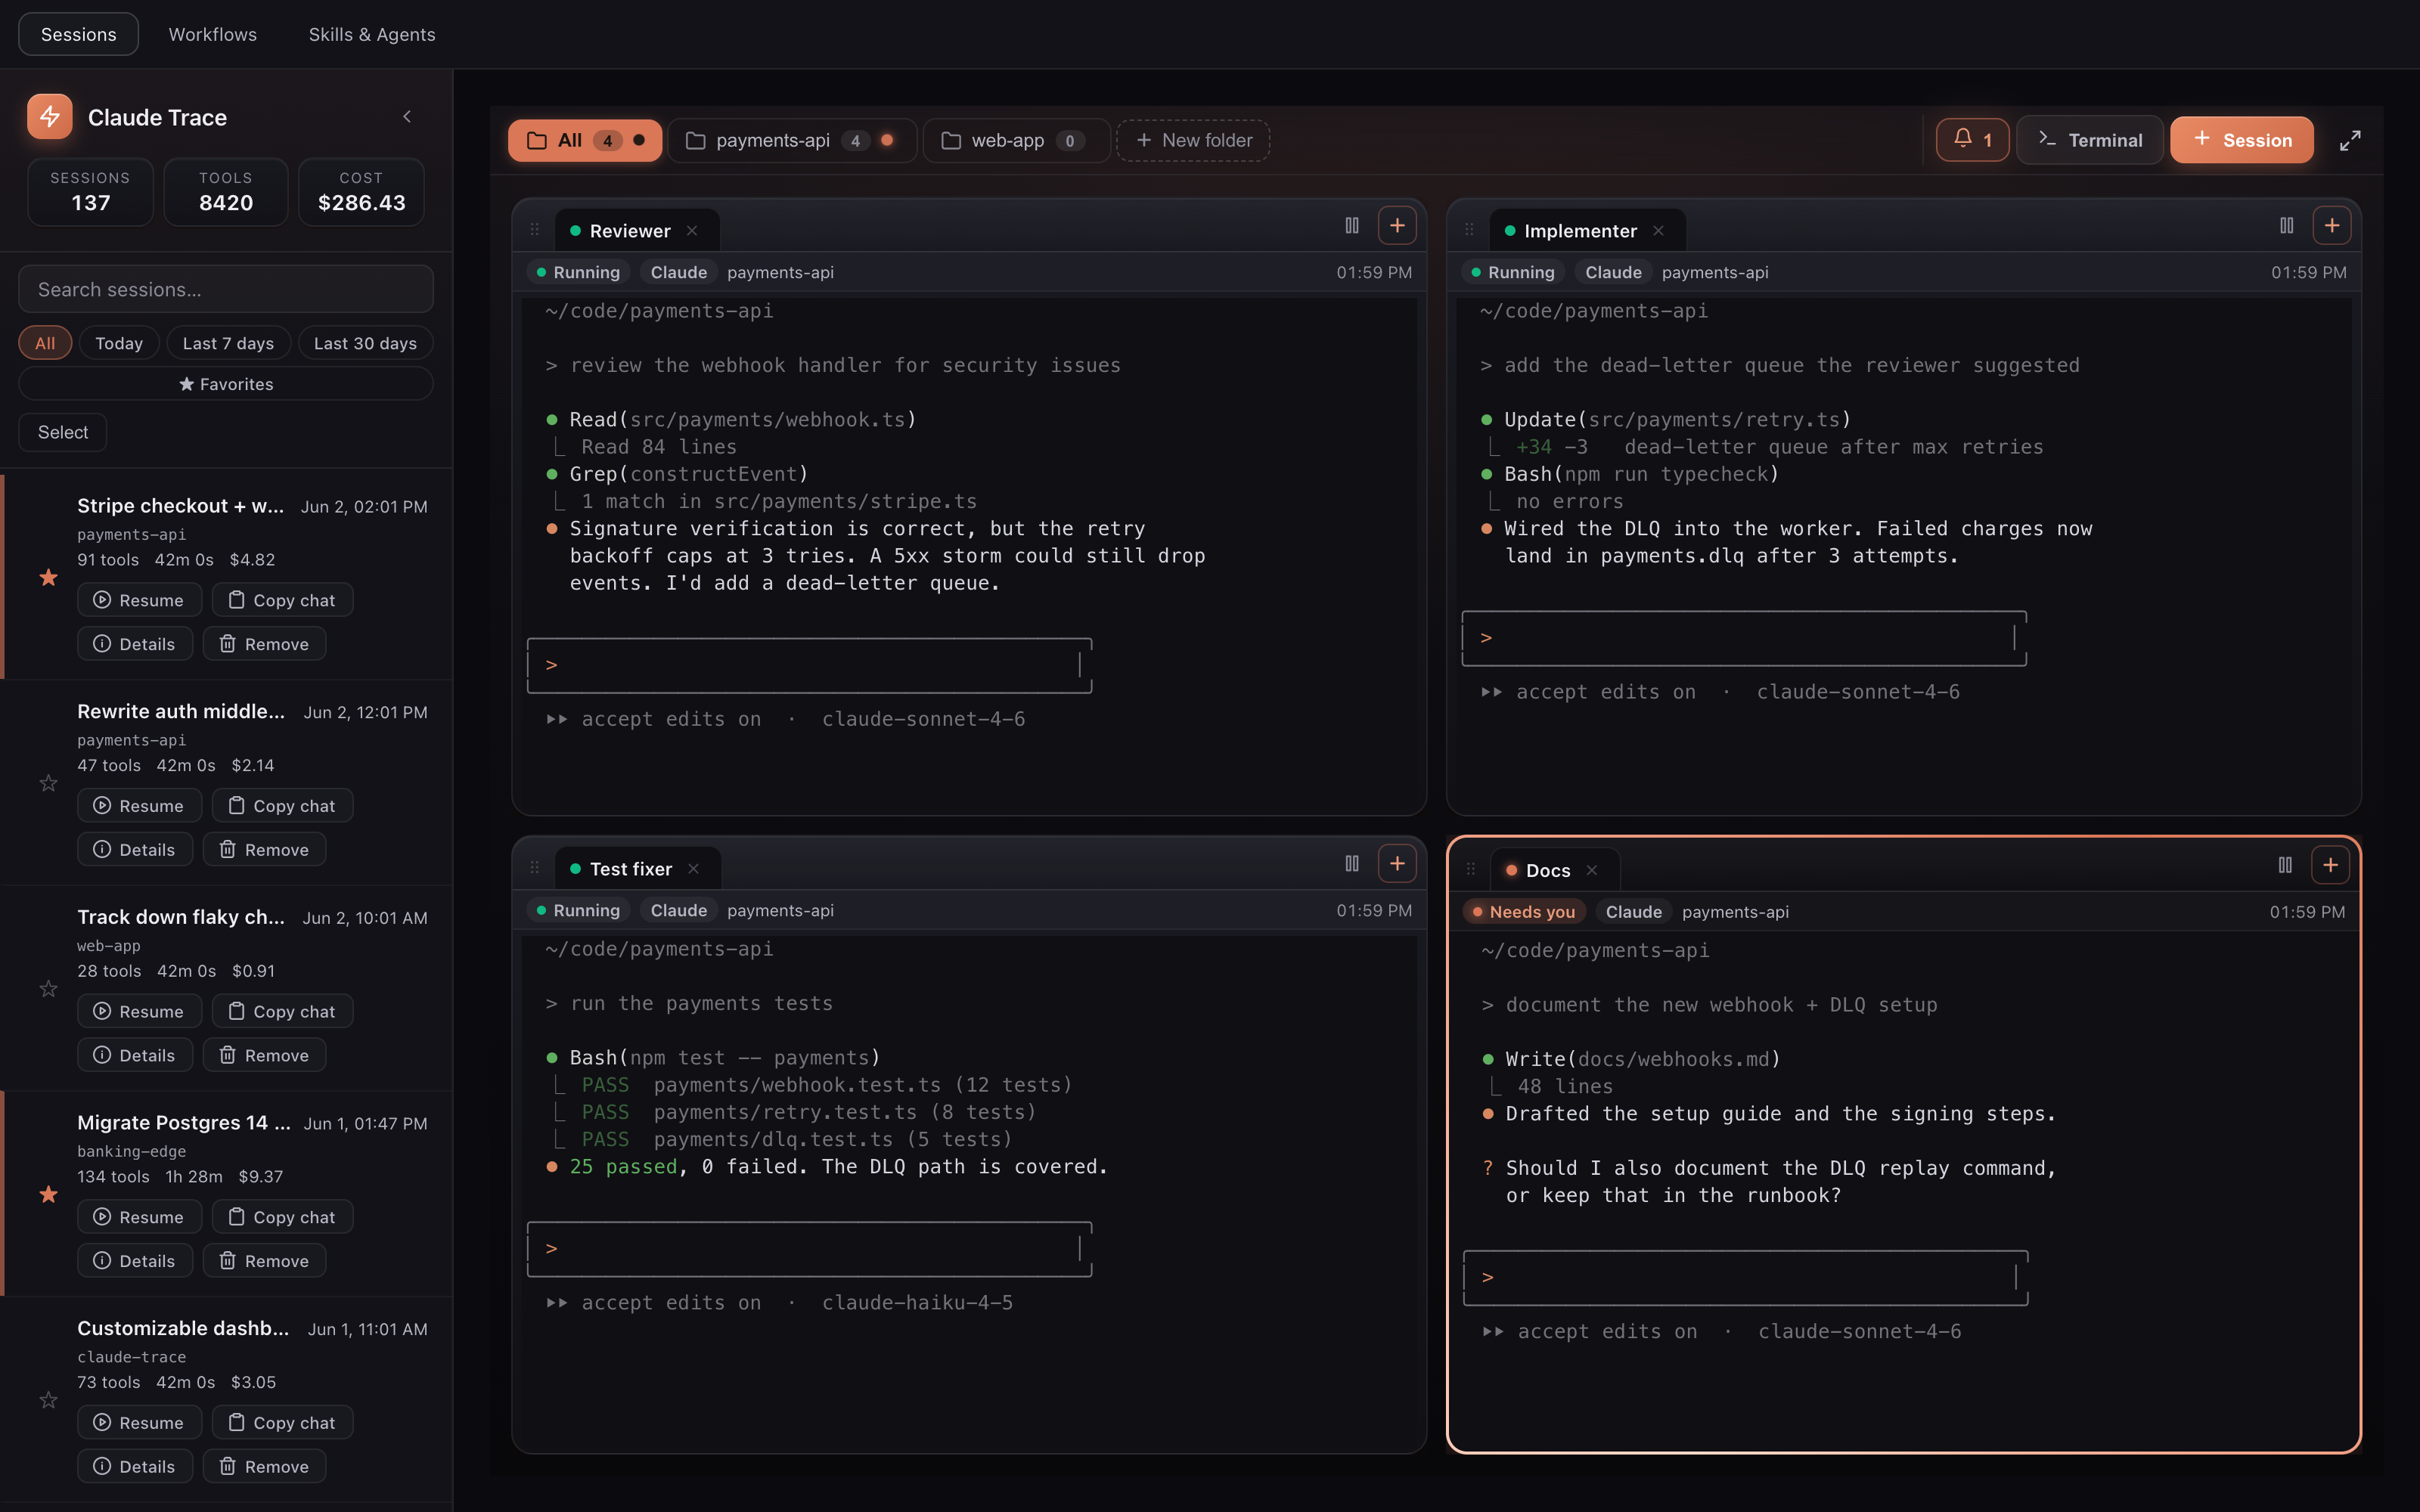
Launch many Claude Code sessions as tiled terminals in one view, like tmux but native to the editor. Group them into folders by project. A dot lights up on a session, and on its folder, the moment it finishes a turn or asks for your input, so you always know which window needs you without staring at all of them. The sessions run in detached tmux, so they keep working when you quit VS Code and they are still there when you come back. Spin up a batch from a saved profile, pick the model and permission mode per session, and drop an image straight onto a terminal. Build workflows that chain agents
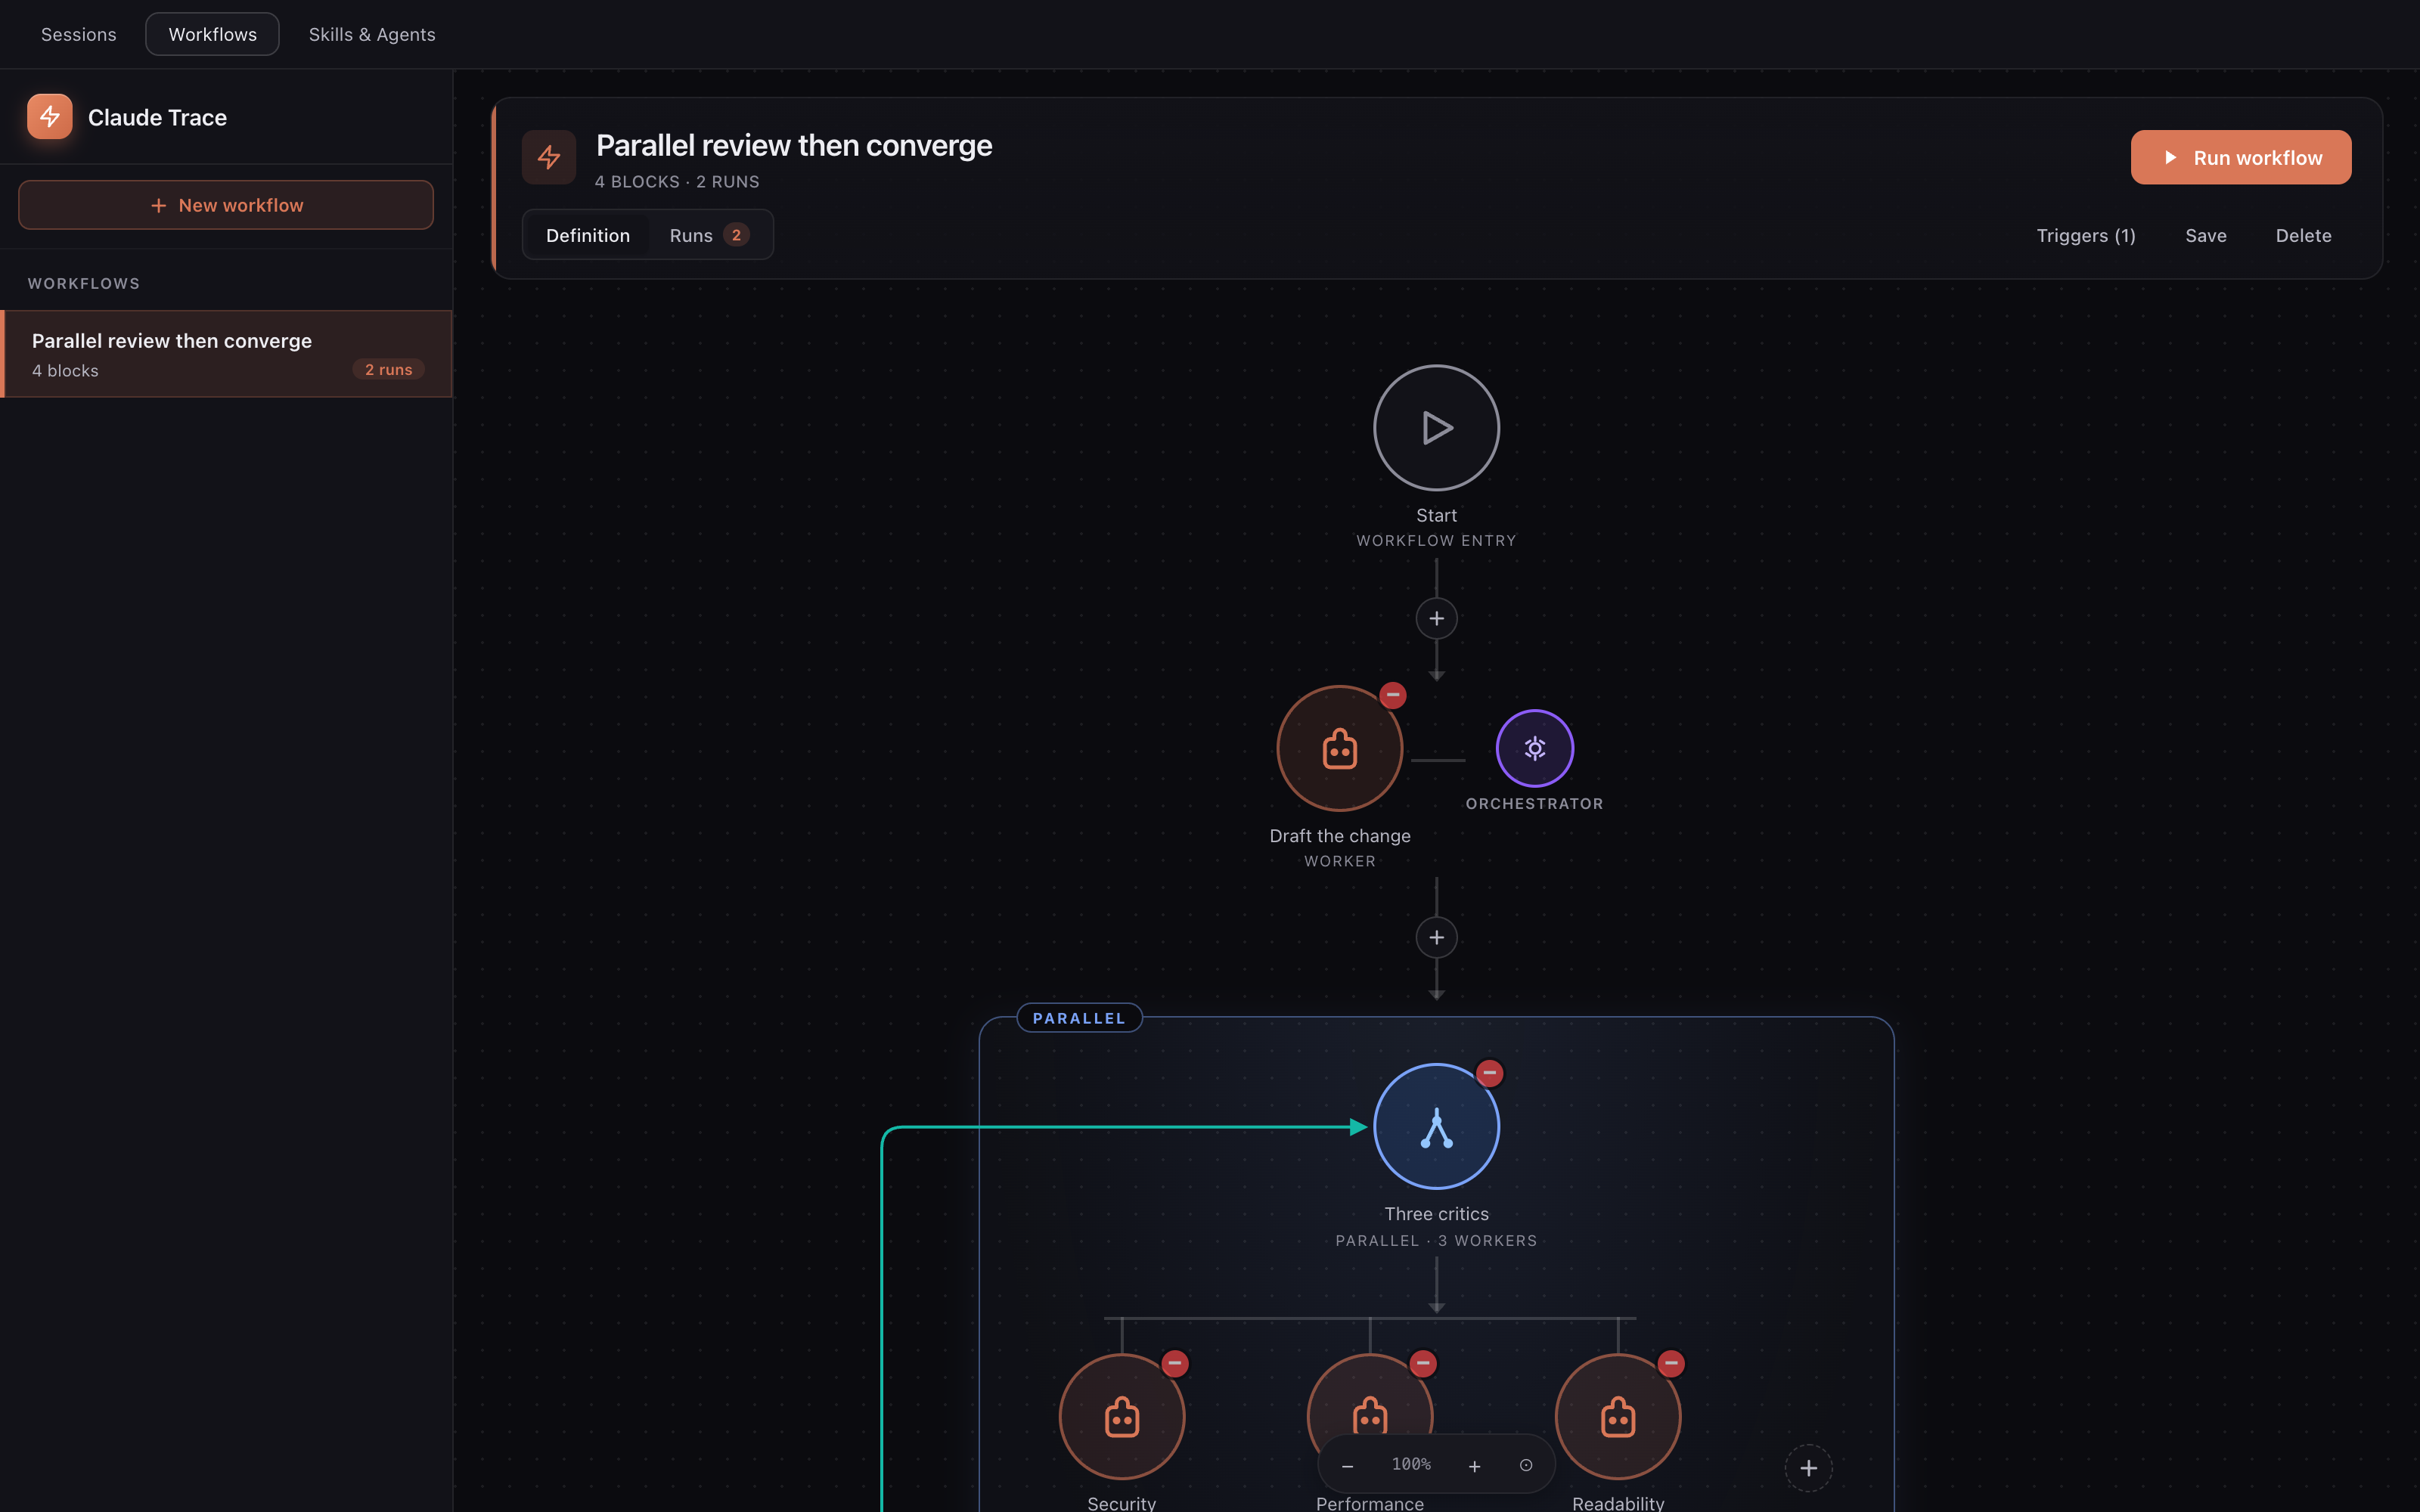
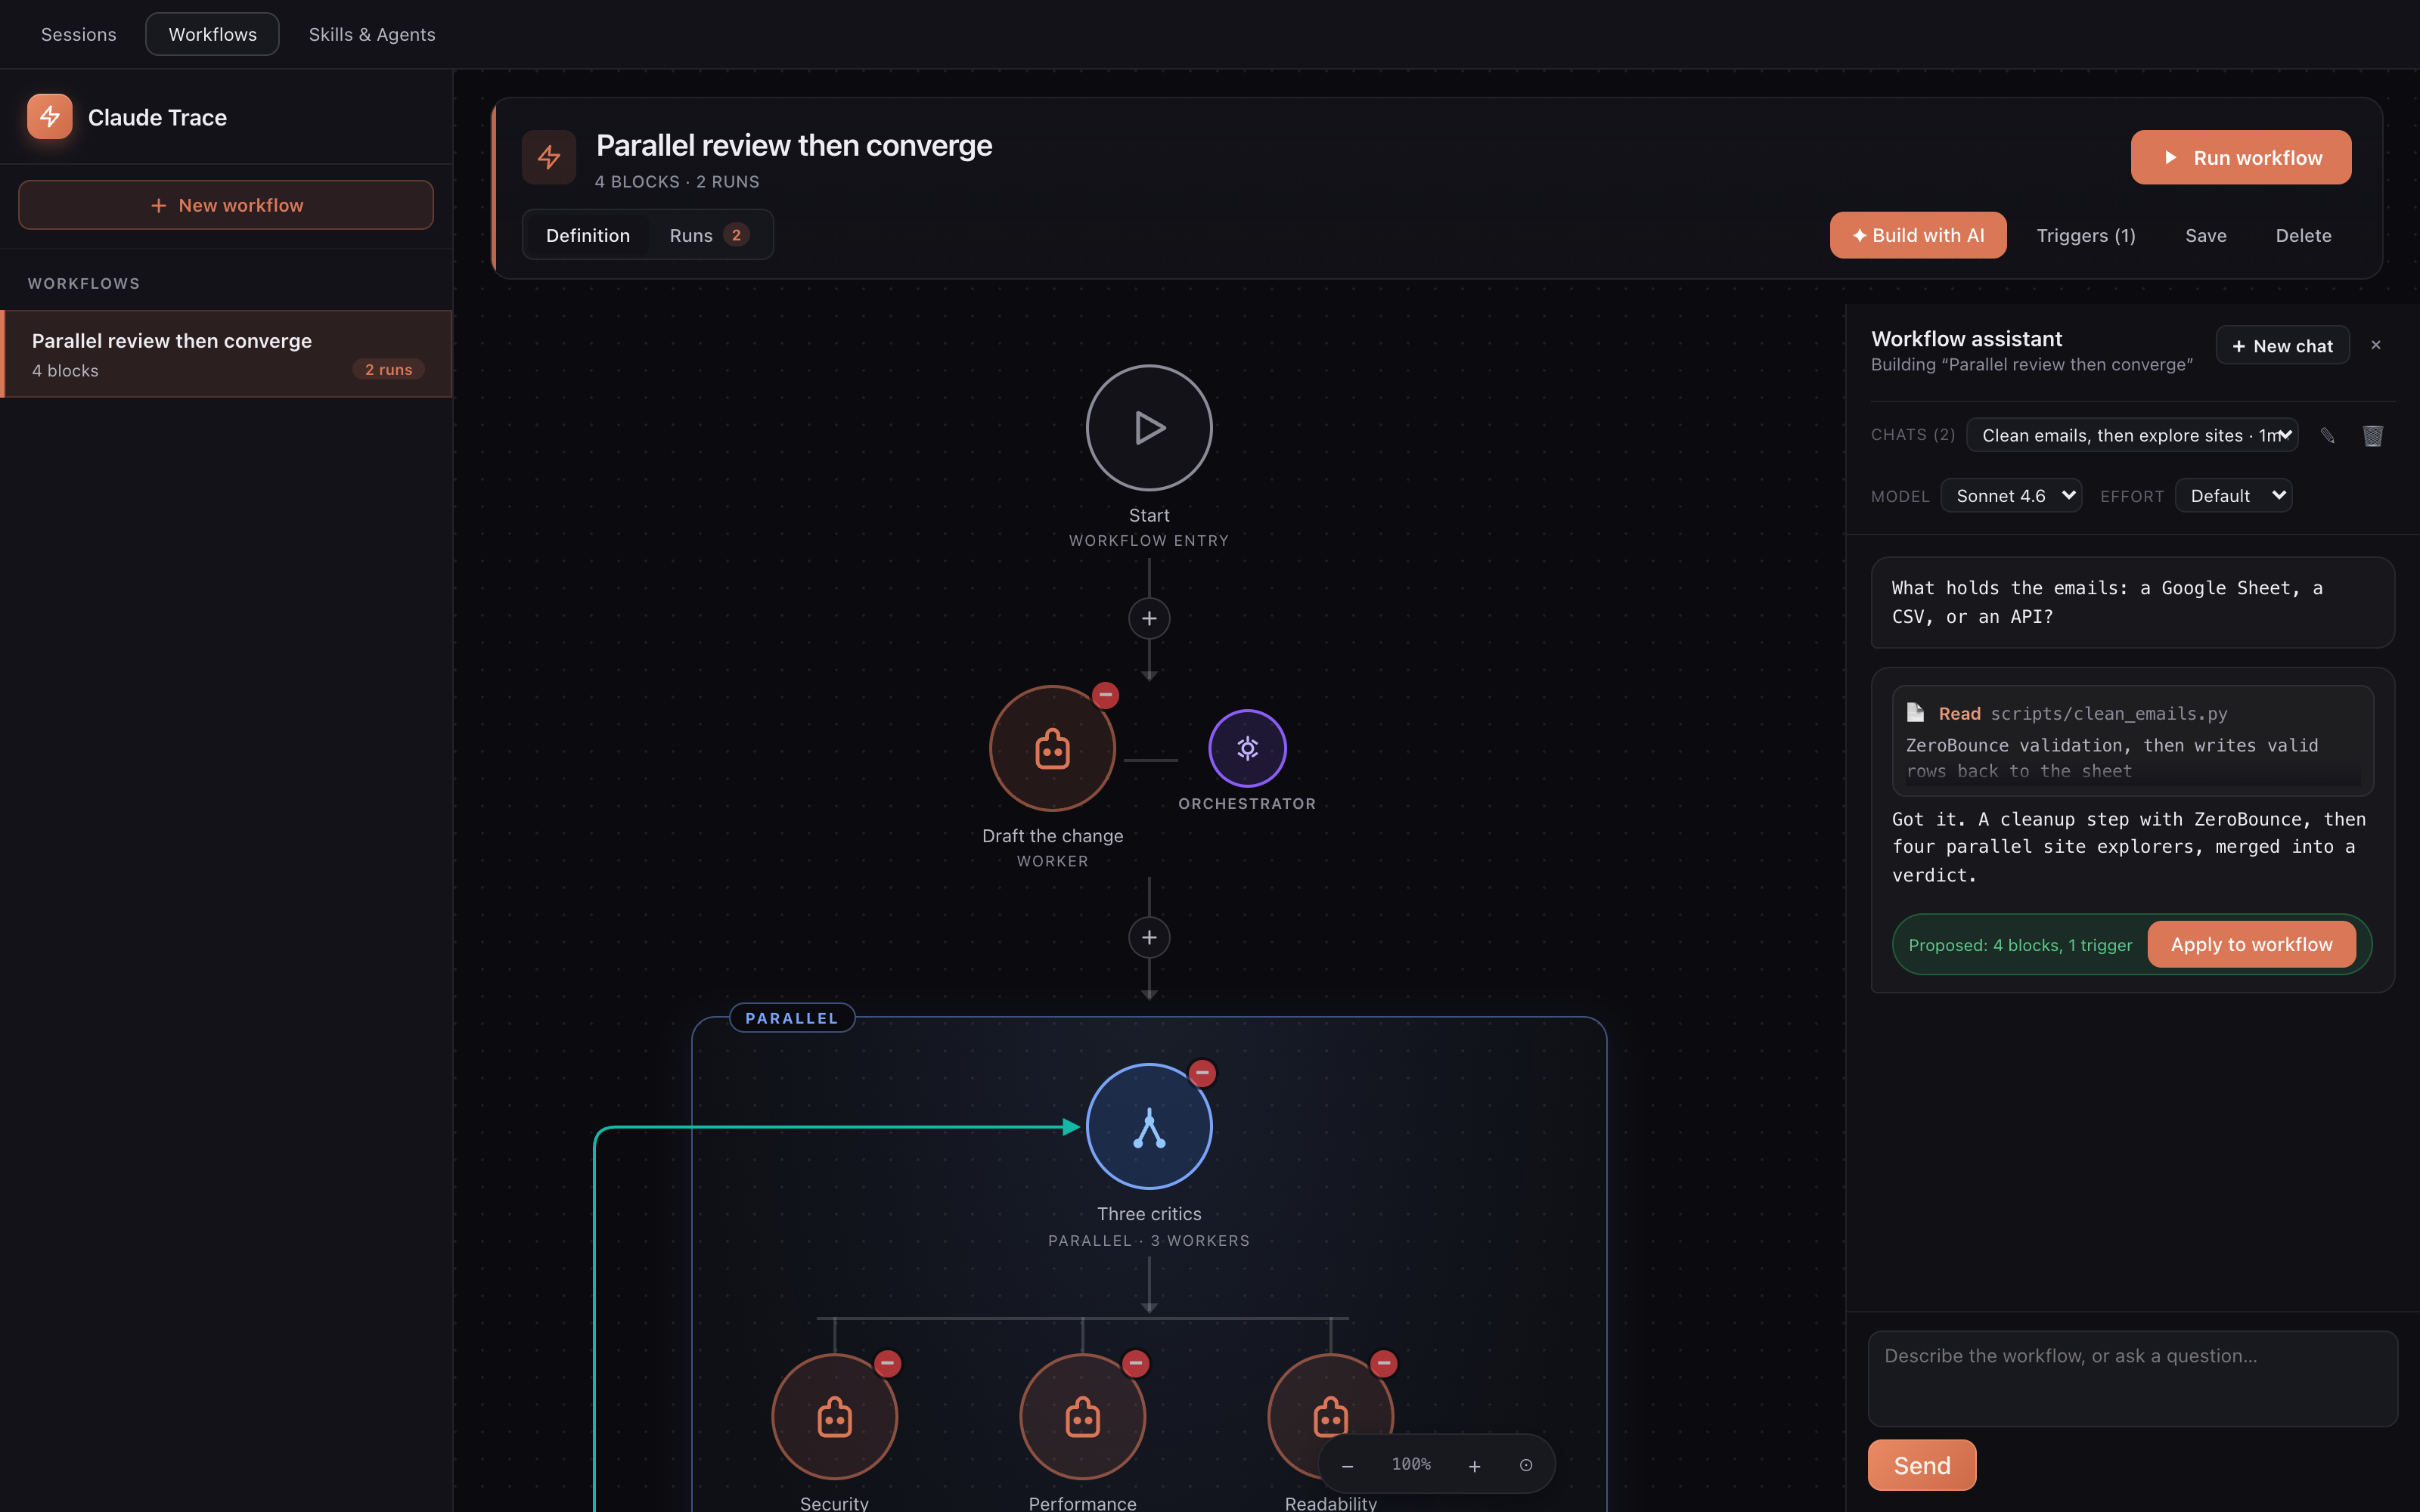
Wire several Claude sessions into a pipeline on a canvas. Run workers in sequence so each one picks up where the last left off. Fan out to parallel workers and merge their results. Loop a block until an evaluator decides the work is good enough. Add scripts, HTTP calls, file steps, and conditions between the agent steps. Kick a run off by hand, on a schedule, or with a webhook. Every step drives a real Claude Code session and passes its output to the next. The result is the kind of deterministic multi agent flow that subagents and agent teams don't give you, built visually instead of in code. Long runs fail in boring ways: a worker gets stuck, or an agent says done when it quietly skipped the work. So each worker pool has an orchestrator session that reads every worker's output and rules it passed or failed before the run moves on. Stopping a run kills every session it started, no zombies left behind, and a failed run reruns from the first step in one click with the answers you typed still in place. You don't have to draw every workflow by hand either. Press Build with AI, describe what you want or point it at the scripts you already have, and the assistant reads your repo, asks the questions it needs to get the design right, then proposes a complete workflow you drop onto the canvas in one click. Changed your mind? Undo puts the canvas back exactly as it was.
And it remembers. Every workflow keeps its own chats, named and resumable, so when you reopen one next week the whole design conversation is still there instead of gone the moment you closed the panel. Keep your skills and agents in one place
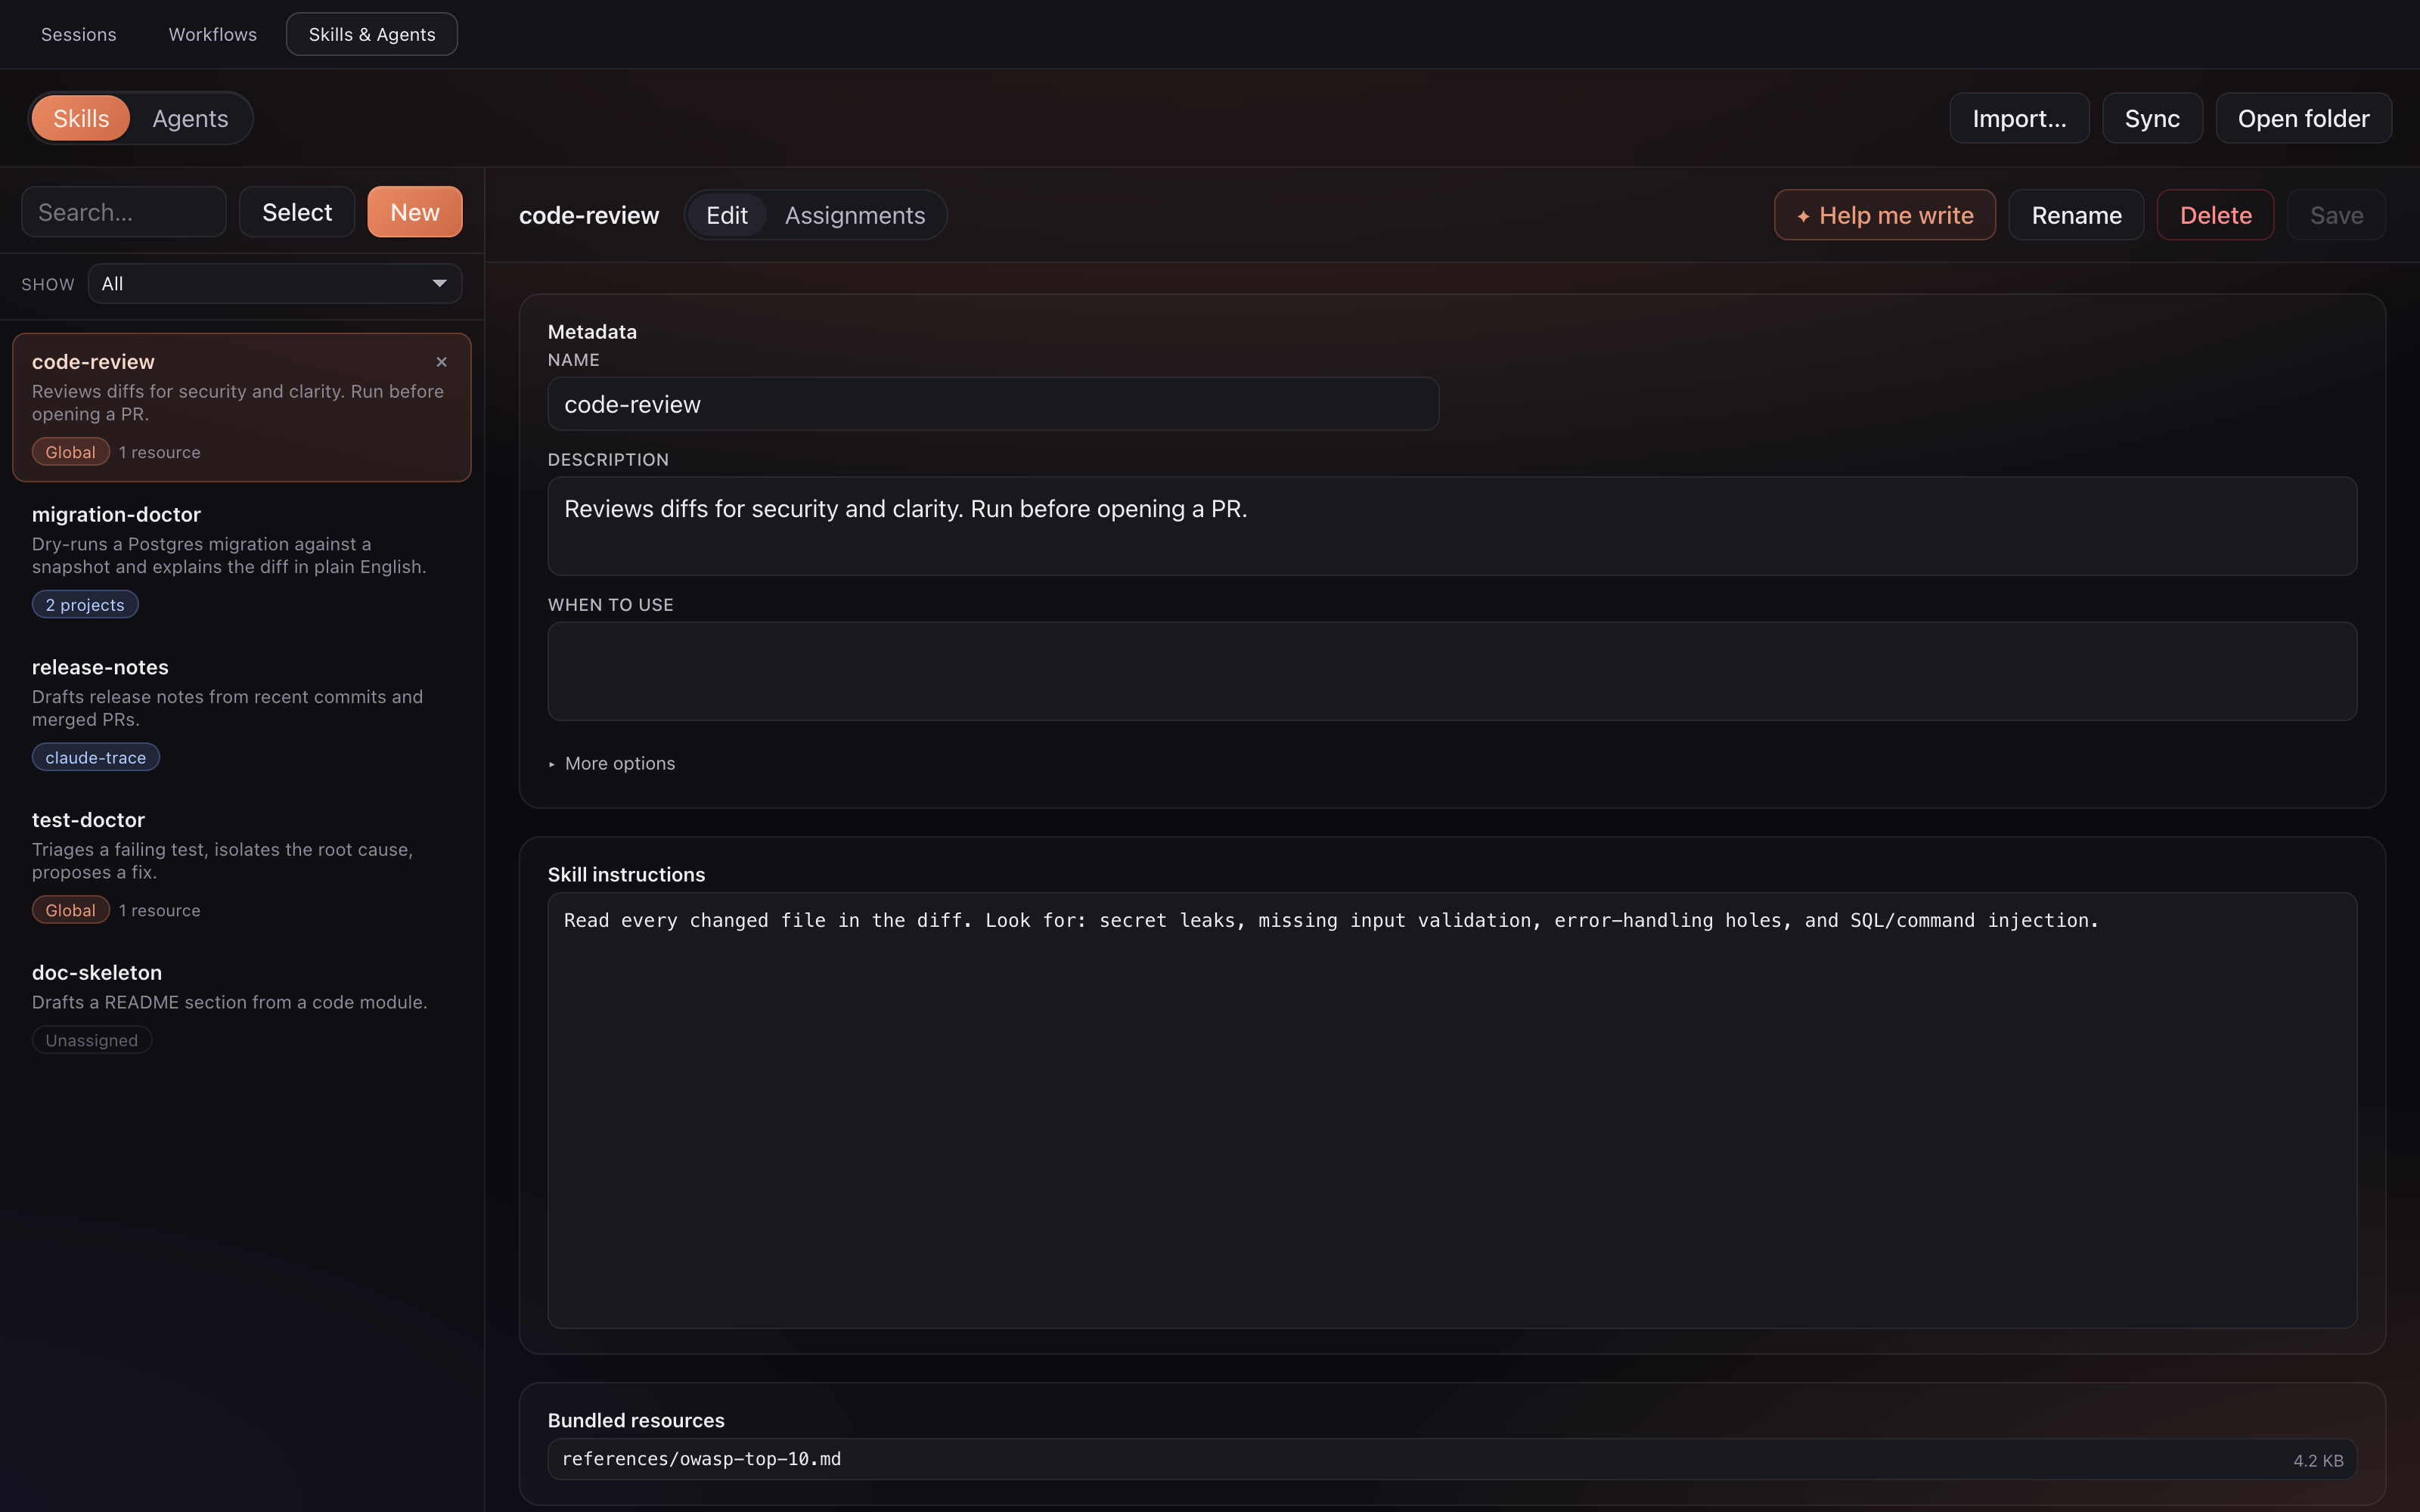
Skills and agents are the best part of Claude Code, and they sprawl. Some live in The library puts all of it on one screen. Every skill and every agent, with a real editor for the instructions, the description, the attached skills, and the bundled resources. No more digging through dotfiles to find the thing you wrote last month. Then you set the scope on each one, and Claude Trace writes the real files where they belong: global for Not sure how to word a skill? Press Help me write and a side panel drafts the body with you in a real Claude session, then drops it straight into the editor. Run agents on your subscription, not the API meterThis is the part worth reading twice. On June 15, 2026, Anthropic splits programmatic Claude Code into separate metered billing. The Agent SDK, Claude Trace runs its cockpit and its workflows through real interactive terminal sessions. So the orchestration you build here stays on your subscription instead of the metered API. If you were planning to coordinate agents through the SDK or headless mode, this is a direct way to keep doing that work without the new meter running. Make the dashboard yours
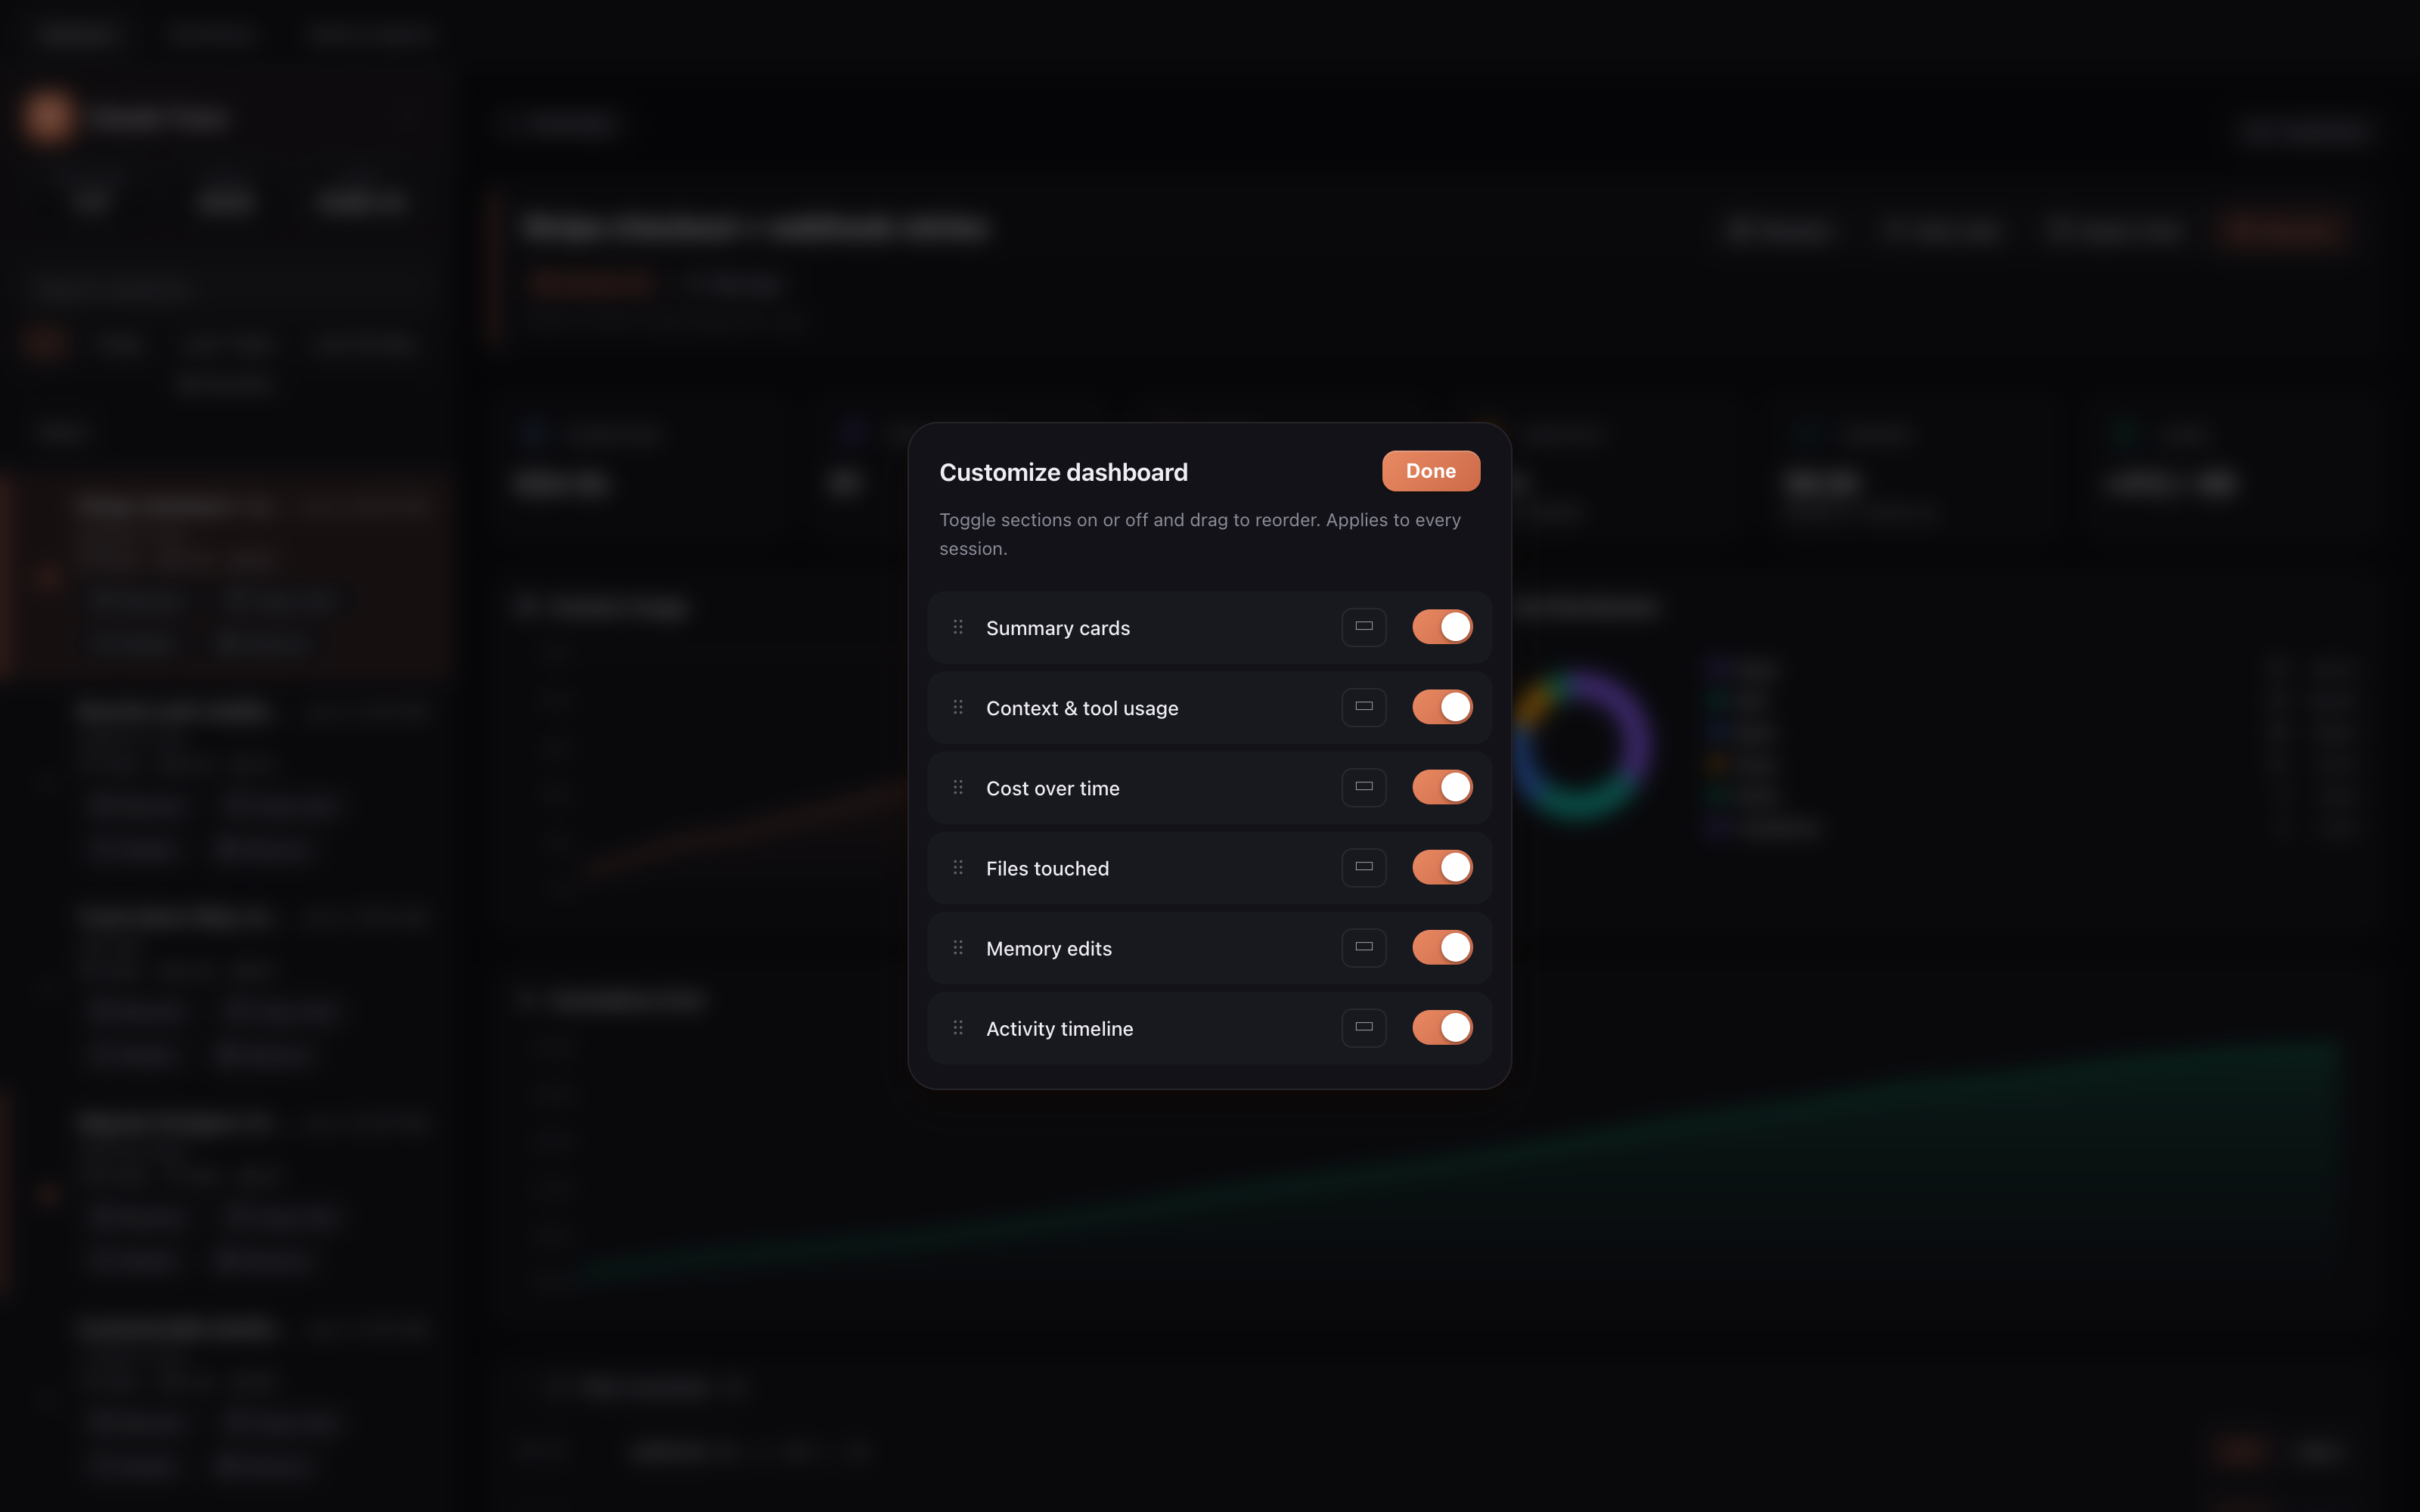
Hit Customize and toggle any section on or off: summary cards, context and tool usage, cost over time, files touched, memory edits, the activity timeline. Set a section to half or full width and drag to reorder. The layout you pick applies to every session. How it worksClaude Code writes a complete JSONL transcript for every session under Claude Trace watches that directory and reads only the new bytes when a file grows, then pushes the delta to the panel. Updates batch through Your data stays yoursThere are no network requests, no telemetry, and no opt out flag because there is nothing to opt out of. Everything is read from your local disk and rendered locally. About the cost numbersThe dollar figures are local estimates from the token counts in your transcripts at published Anthropic rates. They are accurate enough to catch a runaway session or compare projects, but treat your Anthropic billing page as the authority for what you actually owe. Settings
RequirementsVS Code 1.85 or newer, and Claude Code 1.x or newer. The cockpit and workflows use tmux for session persistence, which ships on macOS and Linux. The cost dashboard and the skills and agents library work everywhere. Building from sourcePress UninstallLicenseMIT. See LICENSE. |