PostgreSQL Workbench






Turn VS Code into a coherent PostgreSQL development environment: understand a
schema, query real data, test routines, inspect coverage, and debug PL/pgSQL
without switching tools.
Built for your development database: local PostgreSQL, Docker, or self-hosted.
Open the documentation site
for focused guides to the Cockpit, SQL scratchpads, pgTAP coverage, the debugger,
the standalone DAP server, and the complete command and settings reference.
The complete Schemas-to-editor drag-and-drop contract is maintained in the
SQL authoring guide.
See the Workbench in action
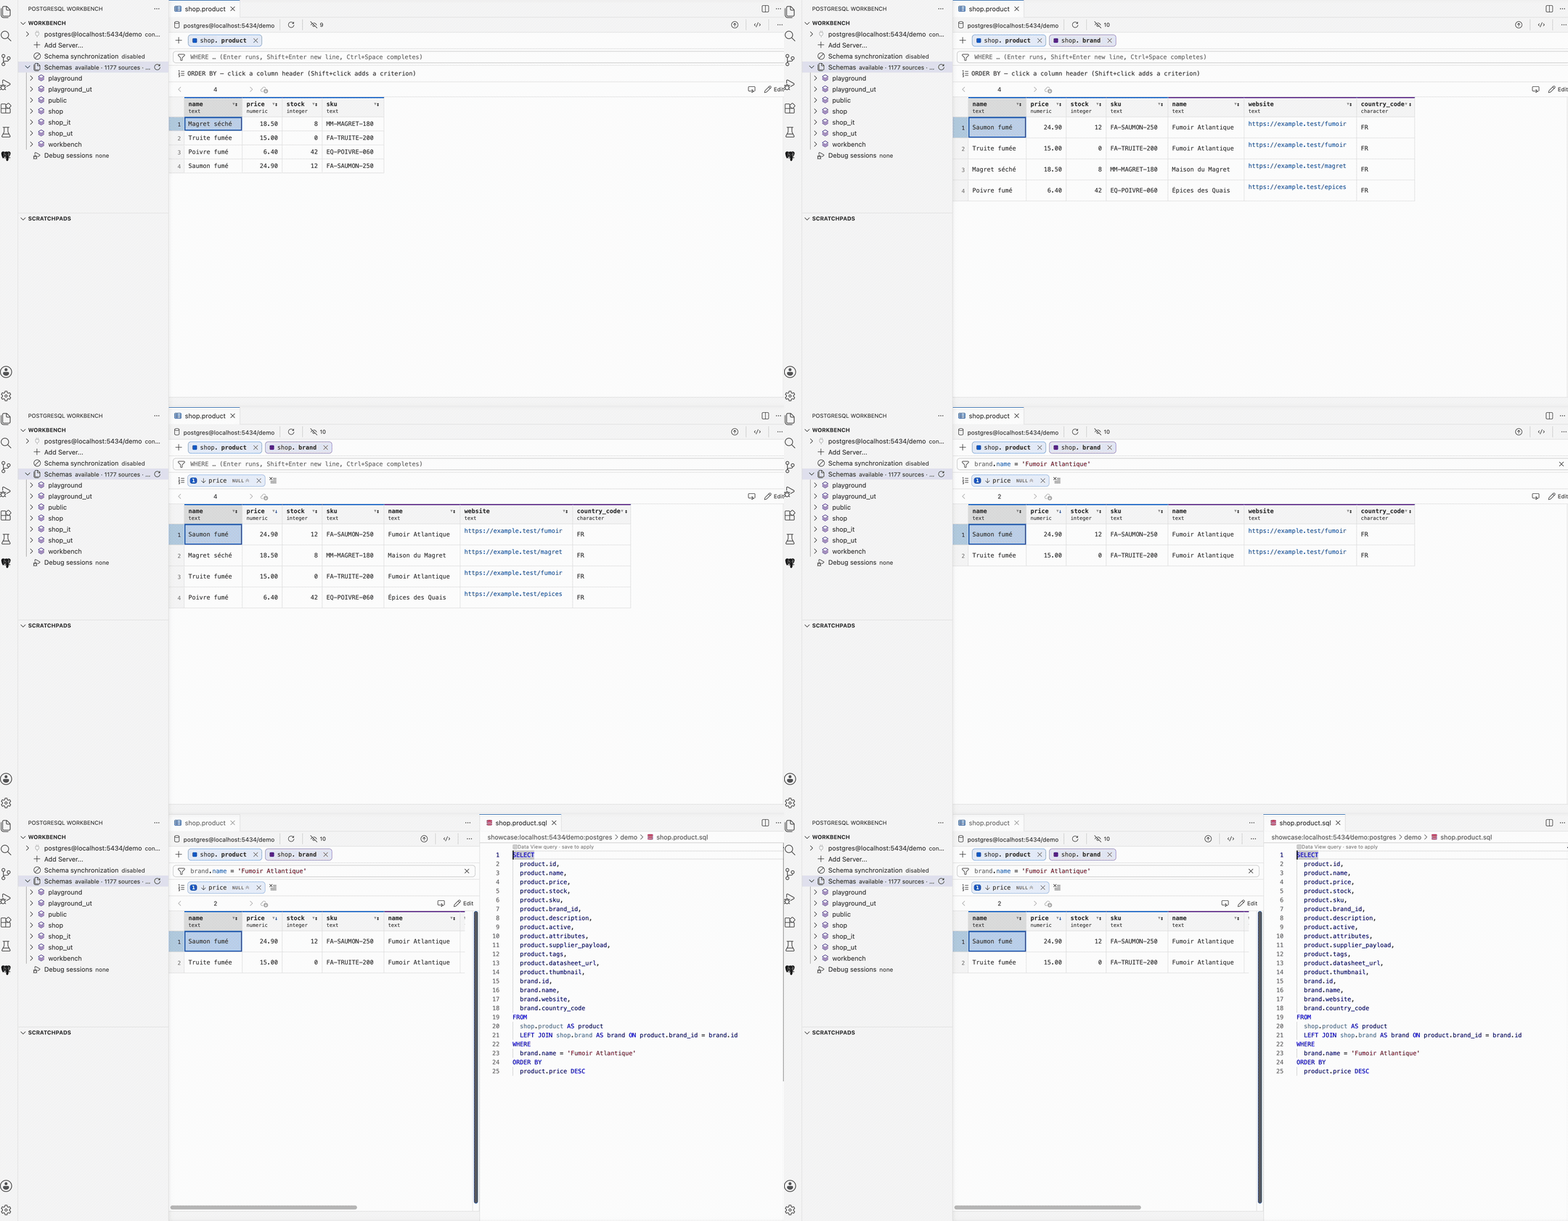
Read and correct table data without leaving the editor
Open any table, view, or query result in an editable grid that owns its query:
join a related table on the key the planner derives, filter on what a cell holds,
sort, and correct a value. Every change is held until you apply them together, in
one guarded transaction — and the query stays SQL you can open, read, and edit.
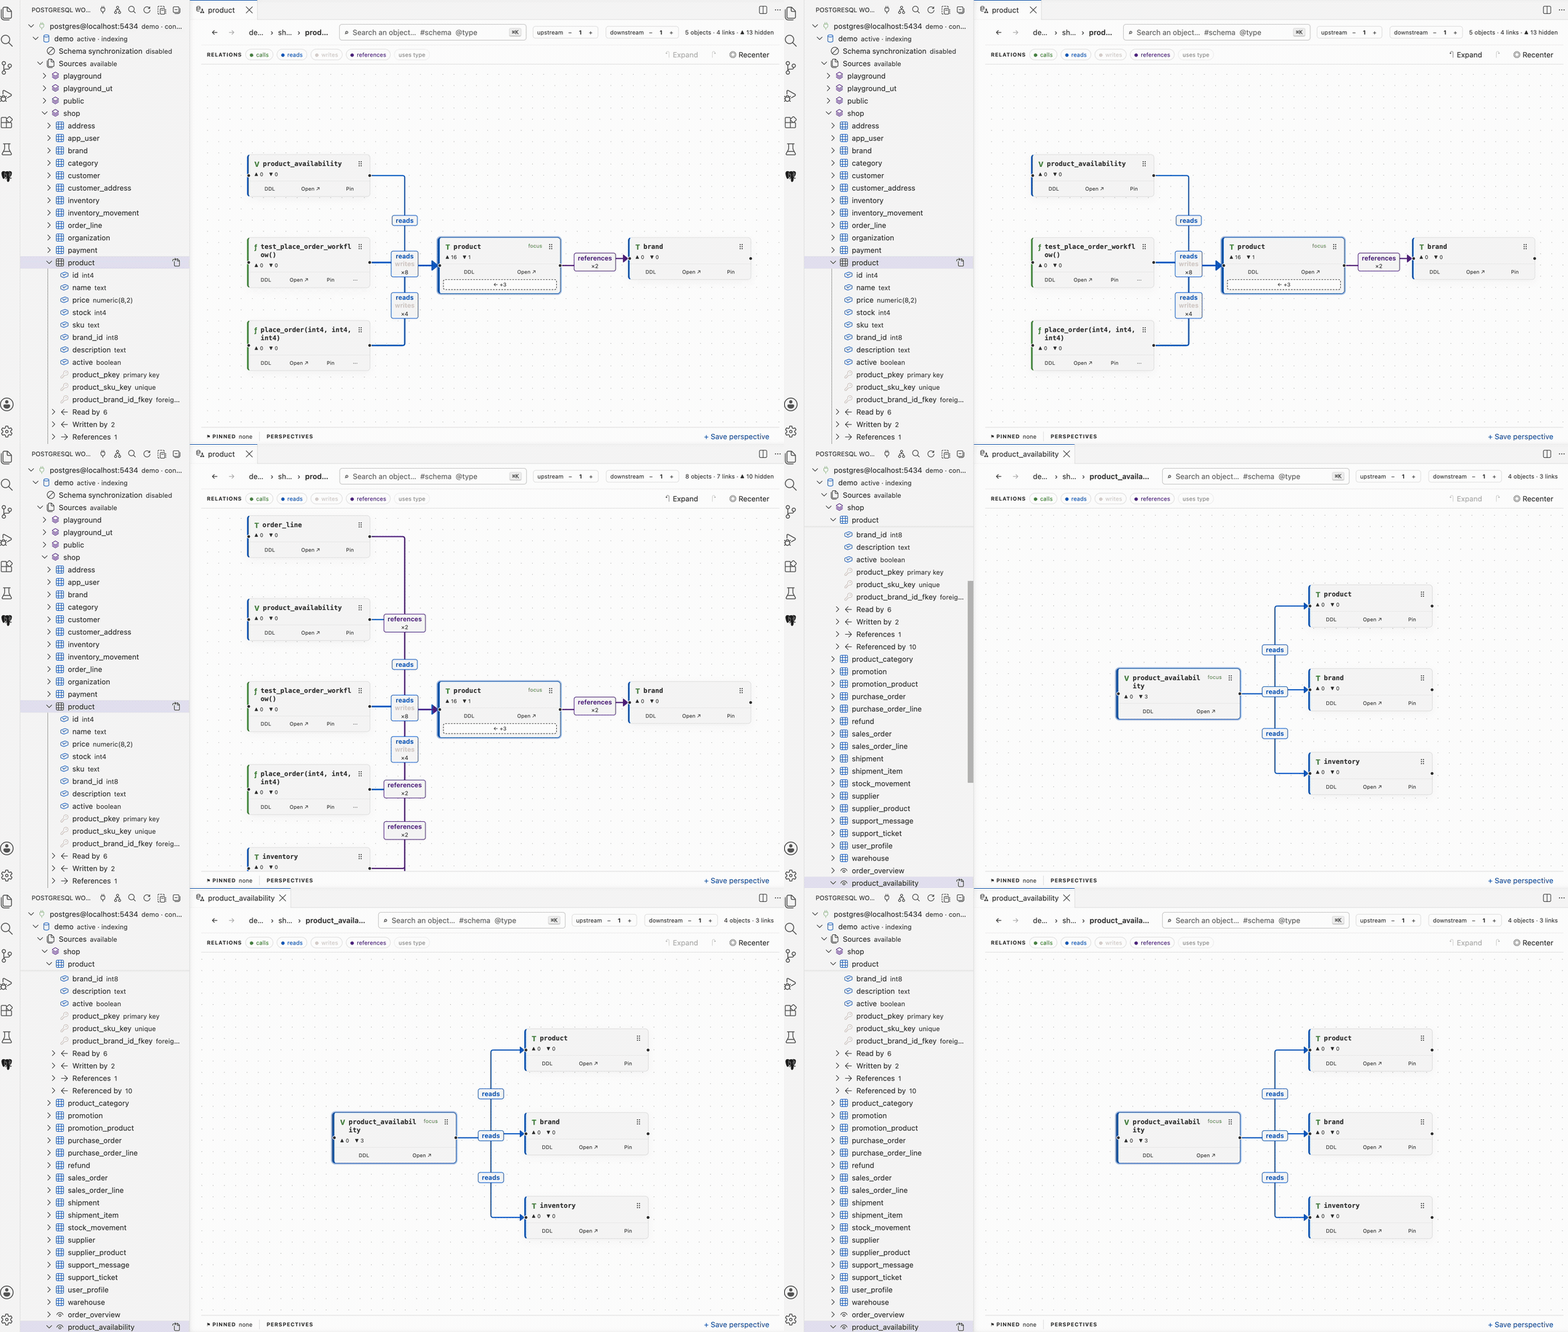
Understand the architecture before changing it
Focus a central table, expand upstream and downstream relationships, and move
through the live PostgreSQL graph without losing context.
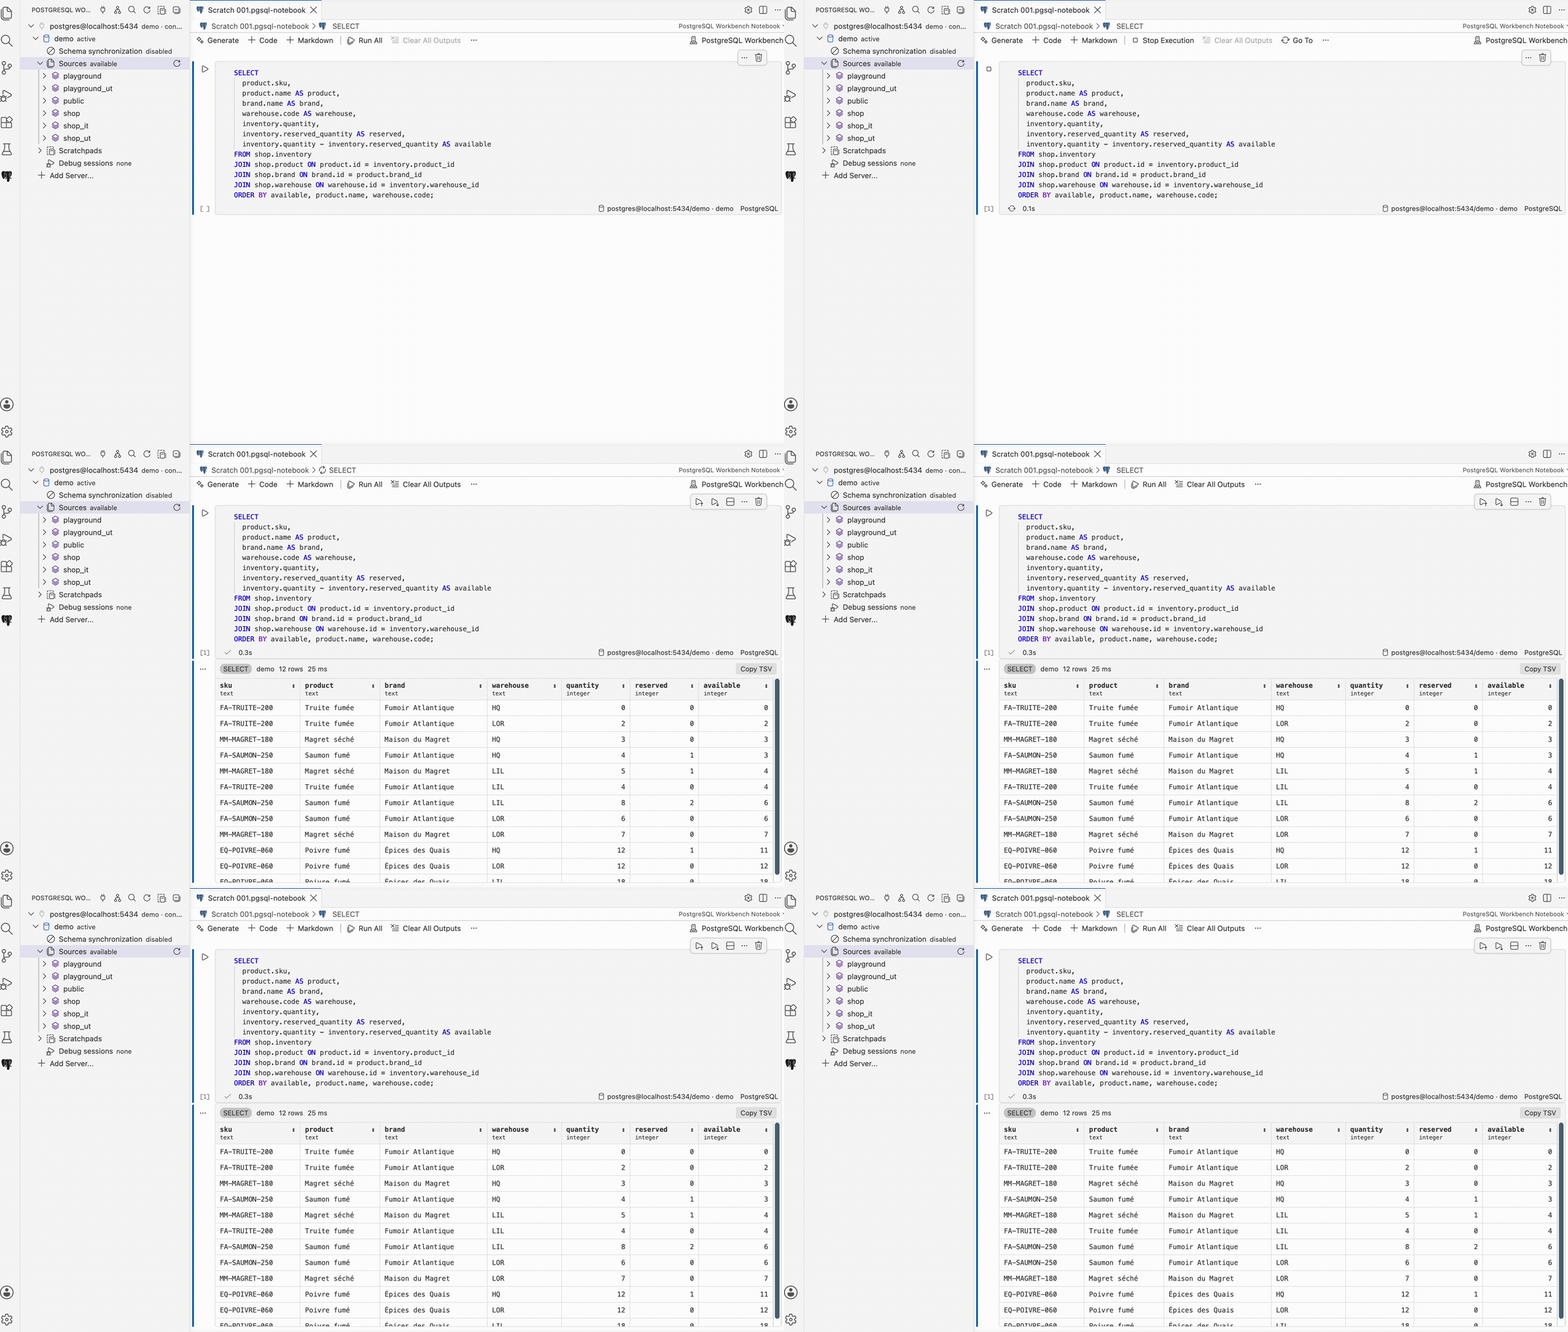
Query data in persistent SQL scratchpads
Keep notebooks bound to the right database, execute business queries, and work
with a bounded, sortable result grid designed for real PostgreSQL values.
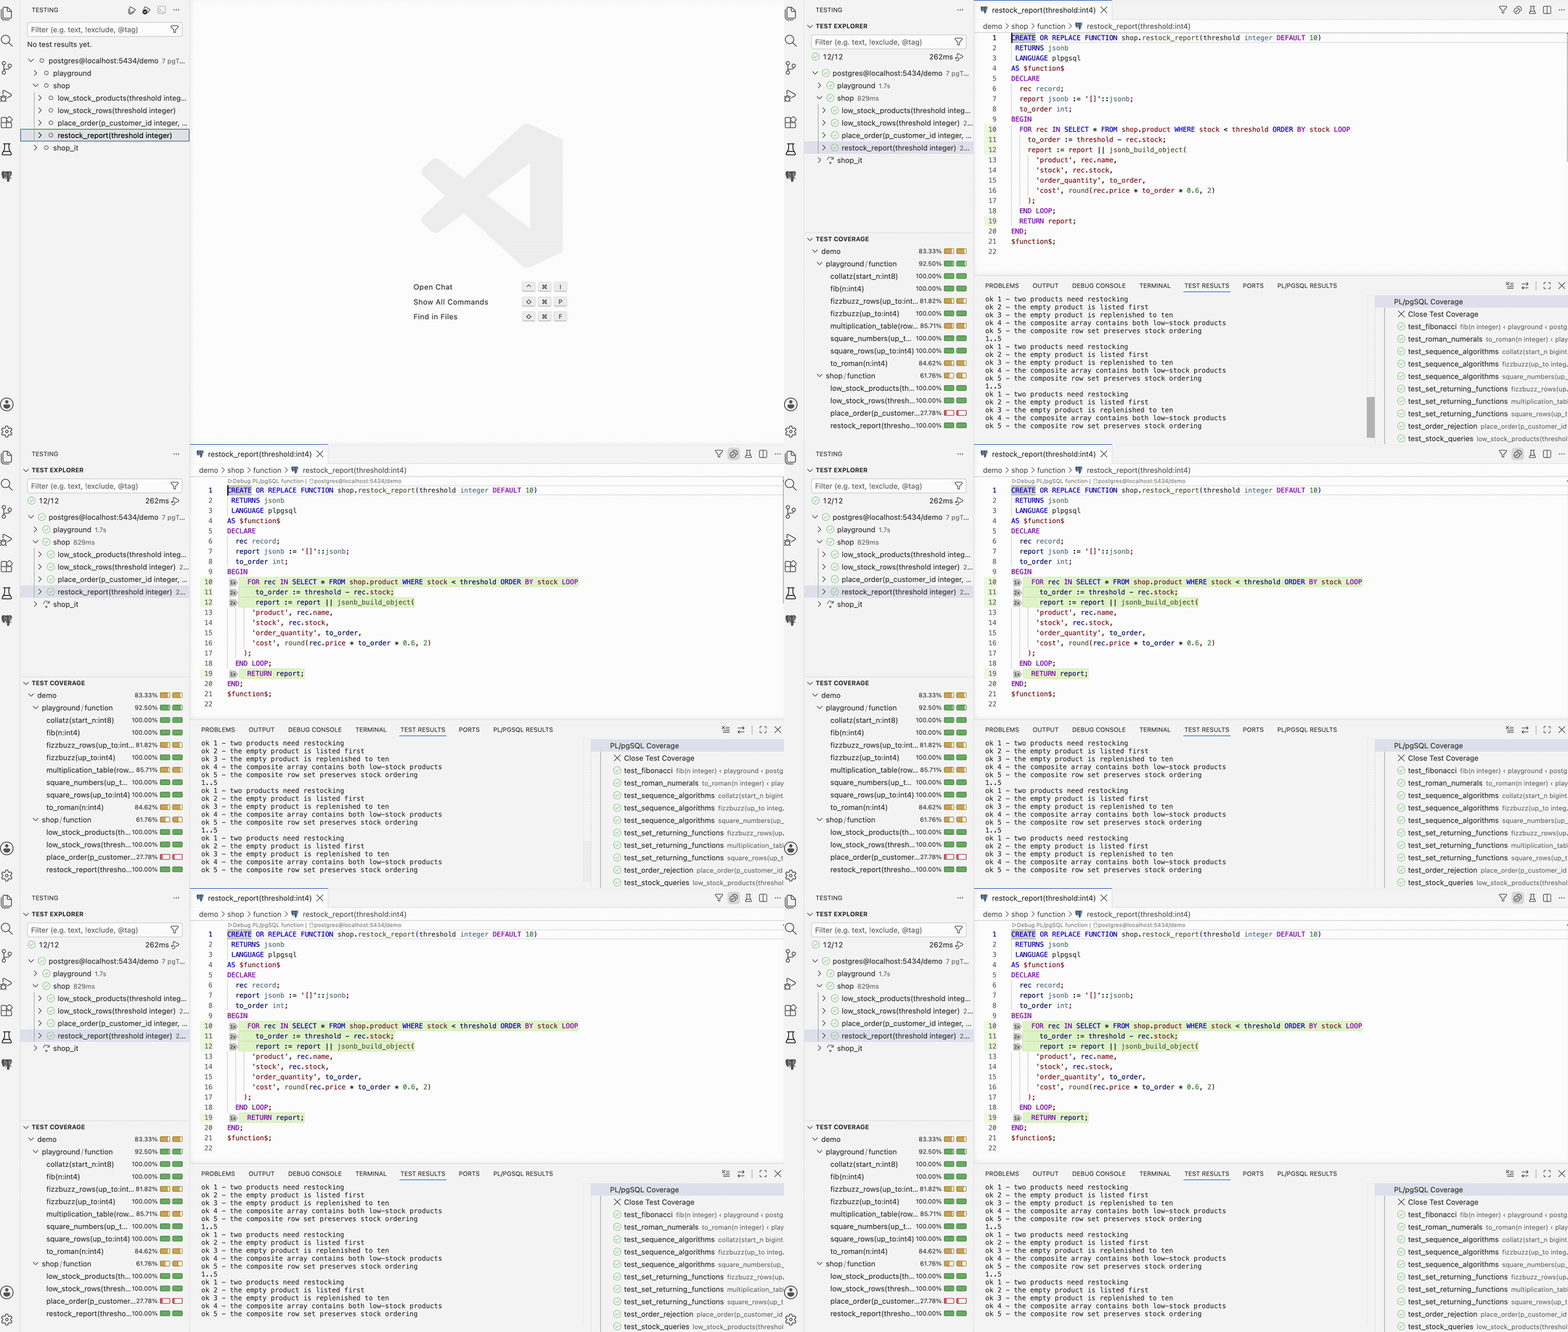
Run pgTAP tests and inspect native coverage
Discover database tests in VS Code's Test Explorer, run them with coverage, and
jump directly to statement and branch coverage in the routine source.
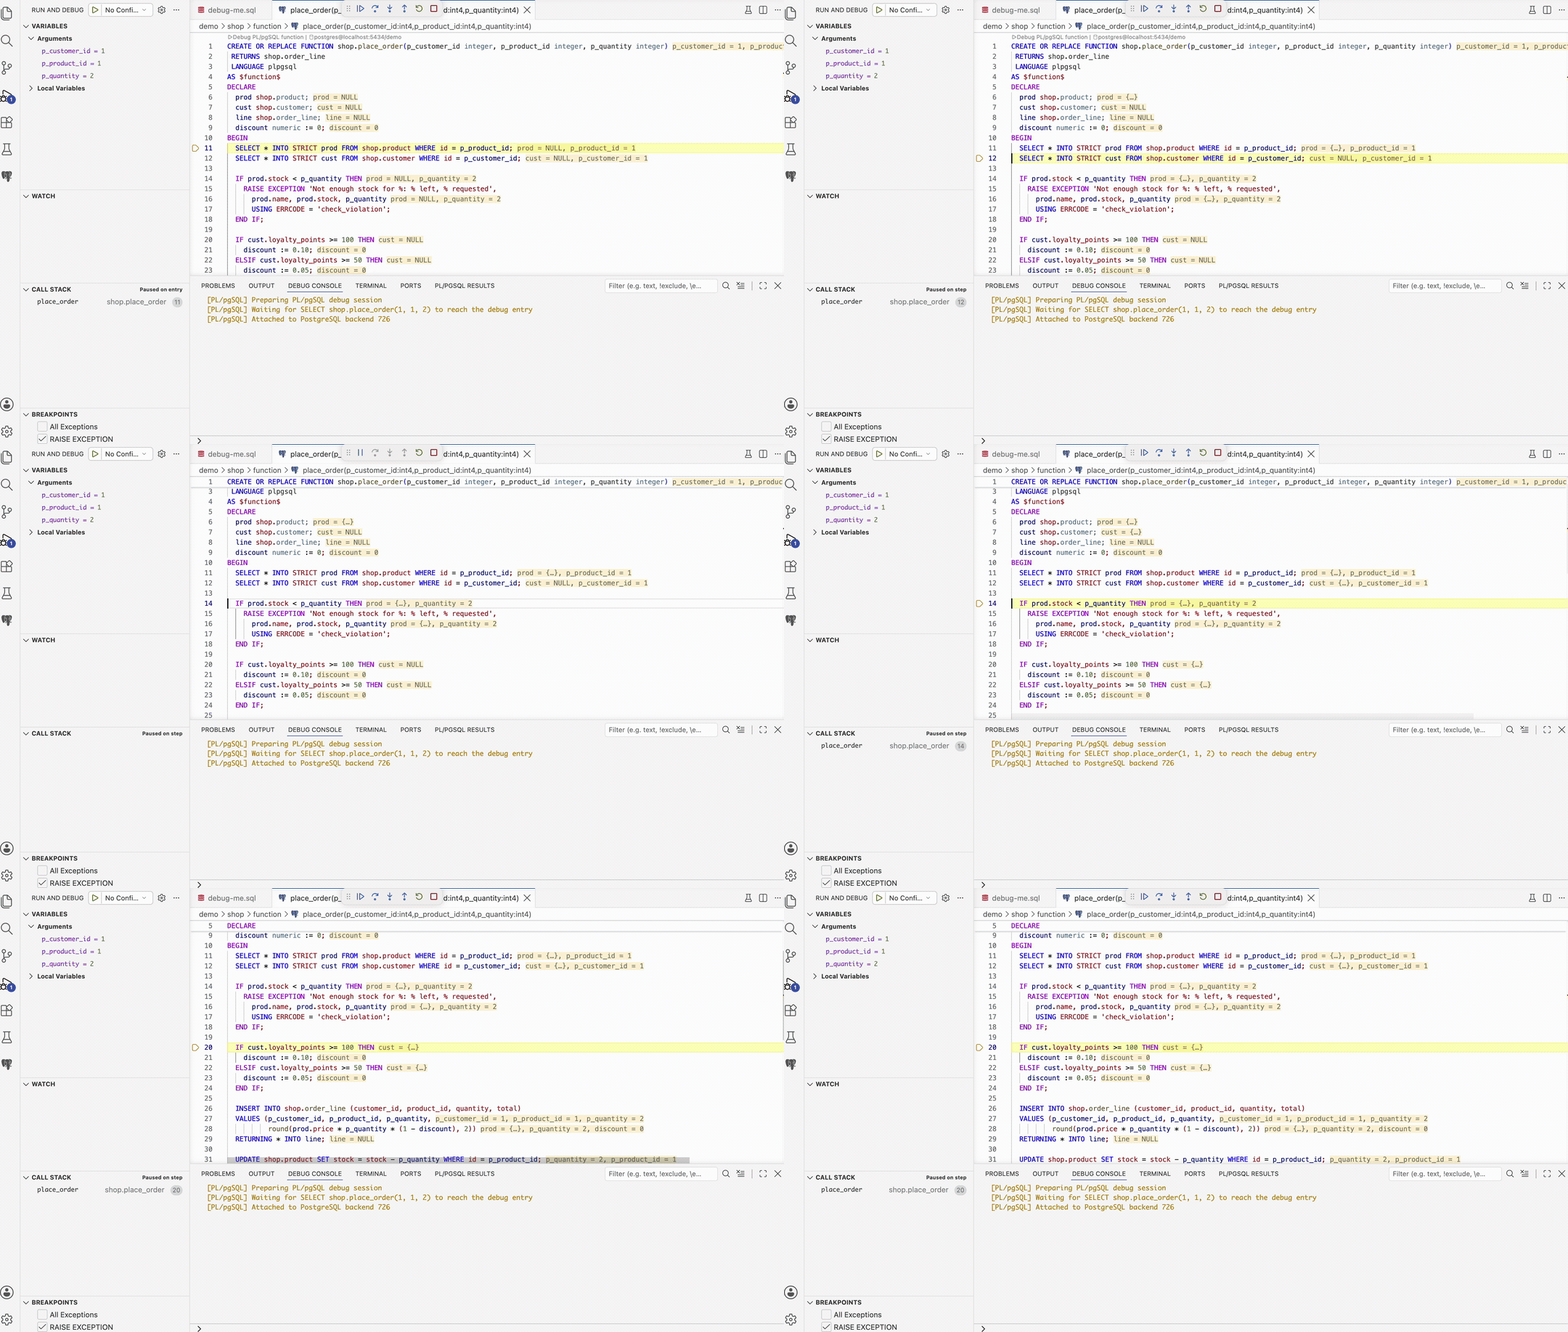
Debug PL/pgSQL with familiar VS Code controls
Stop inside a routine, step through production-shaped logic, inspect composite
variables, and keep PostgreSQL notices and query results close at hand.
Read and write table data
Open any table, view, or query result in a Data View: an editable grid that
owns its query. Add a column, join a related table on the key the planner chose,
filter with WHERE completions from the indexed catalog, sort, hide what you do
not need, and page through a relation too large to load at once.
Where the rows come from exactly one table whose identity is projected, the grid
writes back: edit cells, add rows, delete rows — with what the deletion drags
along said before it happens — then apply everything in one guarded transaction.
A row that changed since it was loaded stops the write instead of overwriting it.
Export the selection, the loaded rows, or the whole query as CSV, TSV, JSON, SQL
INSERT, or Markdown.
Open one from the database tree or from a statement in a SQL file. See the Data View
guide.
One database context, one connected workflow
- PostgreSQL Cockpit — explore indexed schemas, dependencies, callers, reads,
writes, references, pins, and saved perspectives.
- SQL notebooks — create persistent scratchpads, retain their database
binding, page through results, sort columns, inspect structured values, and
export bounded previews.
- Schema synchronization — opt in to PostgreSQL DDL notifications and update
the structural index incrementally when database objects change.
- pgTAP and coverage — discover and run database tests, then inspect native
statement and branch coverage in the editor.
- PL/pgSQL debugger — use breakpoints, step controls, inline values, the
Variables panel, Debug Console, and structured PostgreSQL values.
- Connection-aware navigation — open several PostgreSQL Connections at once
and keep Schemas, Cockpit, notebooks, results, tests, and debugging attached to
the exact Connection they belong to.
Start a debug-ready PostgreSQL from VS Code
The debugger requires the pldebugger
server extension. Run:
PostgreSQL Workbench: Start Local Debug Database (Docker)
Choose PostgreSQL 13–18 and a local port. The extension pulls the selected
Docker image,
starts it on 127.0.0.1, waits until PostgreSQL is ready, creates pldbgapi,
then saves and opens the Connection automatically. PostgreSQL 17 and port 5432
are the defaults. The local database, user, and password are all postgres.
[!WARNING]
These fixed credentials are only for a disposable development container bound
to 127.0.0.1. Never expose this container on 0.0.0.0, a LAN interface, or
a remote host. Use a unique strong password for any non-local deployment.
The images support amd64 and arm64. To run one manually instead:
docker run -d --name pg-debug -p 127.0.0.1:5432:5432 \
  -e POSTGRES_PASSWORD=postgres \
  galien0xffffff/postgres-debugger:17

docker exec pg-debug psql -U postgres -d postgres \
  -c 'CREATE EXTENSION IF NOT EXISTS pldbgapi'
Already have a PostgreSQL database? Run PostgreSQL Workbench: Check Connection Requirements — the
extension diagnoses what's missing and guides you through the setup, including
running CREATE EXTENSION pldbgapi for you when possible.
Managed PostgreSQL services generally do not expose pldebugger. Check your
provider's supported-extension list. If plugin_debugger and pldbgapi are
unavailable, debug against a local, Docker, or self-hosted development
database, then deploy.
Debugging features
- Step-by-step debugging — step over, step into, continue, across nested calls
- Breakpoints — validated against executable lines; conditional breakpoints and logpoints supported
- Rich variables panel — records, composites, arrays, and JSONB expand into structured trees when the server exposes them
- Anonymous record inspection — expands
record values populated by SELECT INTO and FOR ... SELECT; explicit SQL casts preserve precise field types
- Set variable — change a variable's value mid-session from the Variables panel
- Inline values — variable values displayed in the editor while stepping
- Debug Console —
RAISE NOTICE/WARNING output, plus SQL evaluation in the REPL
- Data View — editable grid on tables, views, and query results: compose the query and its joins, filter and sort, edit and add rows, apply in one guarded transaction, and export to CSV/TSV/JSON/SQL/Markdown
- SQL results panel — bounded result grid with JSON/composite inspection, history, copy, and CSV/JSON preview export
- CodeLens — associate a free SQL document with one PostgreSQL connection,
run every Statement directly, and debug only the
CALL / SELECT routine
entries that Workbench can resolve safely; routine definitions offer
Debug deployed routine
- Routine comparison — compare a local PL/pgSQL definition with the exact overloaded routine in the active indexed PostgreSQL snapshot
- Function explorer — browse Connections → schemas → functions in the sidebar, debug from a right-click
- Zero launch.json needed — registered Connections appear in "Run and Debug"; launched sessions are saved to
launch.json for one-key replay with F5
- Connection manager — paste a connection string, import from SQLTools/pgsql extensions, passwords stored in VS Code secrets
- Session recovery — inspect and terminate stale or blocked DAP sessions from the open Connection in the Functions view
- Semantic highlighting — rich PL/pgSQL coloring including dollar quoting
- pgTAP Test Explorer and coverage — discover database tests, run selected suites, and inspect native statement/branch coverage in the editor
Quick Start
- Open any
.sql or .pgsql file. Each non-empty PostgreSQL Statement gets a Run SQL CodeLens.
- Click Choose Document Association once. A single saved connection is associated automatically on the first Run.
- Click Run SQL. PostgreSQL executes that Statement and reports its result or error without requiring it to be debuggable.
- For a resolved PL/pgSQL
CALL or function SELECT, click the additional Debug PL/pgSQL CodeLens; a CREATE OR REPLACE definition offers Debug deployed routine, which debugs the routine deployed in PostgreSQL, not the edited text.
- The debugger stops on entry — step with F10/F11, inspect variables, or set breakpoints in the source.
- Run and Debug results appear in the PostgreSQL Results panel.
Notes:
Debug call is intentionally shown only for standalone SQL calls that can be replayed safely.- One Document Association is shared by every Run and Debug action in the same free SQL file. Changing it never affects any other open Connection.
- Virtual source documents use the exact canonical Code Moniker symbol URI
(
code+moniker://...) and expose routine-definition debugging, not call-site replay.
Automatic Workbench schema synchronization
The Workbench index describes PostgreSQL structure, not table data. Automatic
synchronization is disabled by default and never reacts to INSERT, UPDATE,
or DELETE. Enable it globally or for the current workspace with
postgresql-workbench.workbench.schemaSync.enabled, or use Configure Schema
Synchronization on one Connection to store an explicit connection
override.
Enabling the option does not alter the database. Select Provision Schema
Synchronization separately and confirm the operation. Provisioning creates
two database-level PostgreSQL event triggers plus their notification functions
in the support schema configured by
postgresql-workbench.workbench.schemaSync.supportSchema (workbench by default).
PostgreSQL requires superuser privileges to create event triggers. The listener
uses a dedicated connection and the fixed plpgsql_workbench_ddl channel in
that database; payloads contain structural object identities but no credentials
or table data.
The operation is idempotent and refuses to replace unrelated functions or event
triggers with colliding names. Remove Schema Synchronization Provisioning
removes only the two Workbench event triggers and notification functions,
without CASCADE; the support schema itself is retained. If notifications may
have been missed, the index is marked desynchronized and a complete catalog
refresh is required before it is presented as fresh again.
Debug Configuration
Sessions launched from CodeLens or the sidebar are automatically saved to
.vscode/launch.json, so you can relaunch them with F5. You can also write
configurations by hand:
{
  "type": "postgresql-workbench",
  "request": "launch",
  "name": "Debug my_function",
  "connection": "localhost:5432/mydb:postgres",
  "sql": "SELECT my_function()",
  "stopOnEntry": true
}
connection is the Connection ID shown in the sidebar; if omitted, the active
Connection is used. Configurations never contain credentials — passwords stay
in VS Code secret storage. stopOnEntry defaults to true; set it to false
only for an intentional run-to-breakpoint launch. An optional attachTimeoutMs
(default 30000) bounds how long a still-running target may wait to reach the
debugged routine.
Result safety limits
Target rows are streamed through the adapter instead of being accumulated by
the PostgreSQL client. The call always runs to completion, while the UI retains
only a bounded preview:
- 200 rows by default, configurable with
postgresql-workbench.results.maxRows (20–1000)
- 64 KiB maximum per displayed cell
- 1 MiB maximum per structured result event
- 10 recent results and 5 MiB maximum retained by the extension
These are retention limits, not PostgreSQL wire-protocol limits: PostgreSQL and
node-postgres still receive each individual field before the adapter can
truncate its preview. To prevent avoidable copies, bytea, JSON, and JSONB stay
textual on the target connection, and binary buffers are sliced before hex
conversion. Do not use the debugger to fetch intentionally enormous individual
values.
The panel records running, completed, and failed calls in the same bounded
history. Result labels include the originating callsite when available. The
grid uses one keyboard tab stop: navigate cells with the arrow keys, inspect
with Enter or Space, and copy with Ctrl/Cmd+C. JSON values can be inspected in
formatted or raw form.
Truncation warnings distinguish row, cell, and payload limits. Copying or
exporting an incomplete preview requires confirmation. The Debug Console
receives only a portable scalar value or compact summary, never an unbounded
table. postgresql-workbench.results.autoReveal opens the panel without taking
keyboard focus when a call completes or fails. A running call updates history
silently so it cannot compete with debugger source navigation.
CSV and clipboard TSV exports neutralize spreadsheet formulas and represent
PostgreSQL NULL as \N, keeping it distinct from an empty string. JSON export
preserves native null values and includes truncation metadata.
pgTAP tests and PL/pgSQL coverage
Install pgTAP in the development database and organize
test functions using configurable schema.function glob patterns. The defaults
are *_ut.test_* and *_it.test_*. Matching functions must return
SETOF text; zero-argument functions can be run automatically. Open VS Code's
Testing view, expand the PostgreSQL connection, then use Run Tests or
Run Tests with Coverage.
Keep test entry points and their fixtures or helpers in dedicated test schemas.
When a pattern matches a test, its schema is treated as test infrastructure:
the dependency walker can traverse helper functions in that schema, but they
are not reported as application coverage.
Override discovery globally or in workspace settings when a project uses a
different convention:
{
  "postgresql-workbench.tests.patterns": [
    "tests.*",
    "quality.check_*"
  ]
}
Coverage is collected independently from the debugger. The extension:
- resolves direct and transitively called PL/pgSQL routines by PostgreSQL OID,
including overloads;
- instruments the selected routine set once and runs each selected pgTAP test
once in a dedicated transaction;
- publishes statement and branch counts through VS Code's native Test Coverage
view and editor gutter;
- always rolls back the transaction after success, failure, timeout, or
cancellation;
- rejects routines containing transaction control because they cannot be
isolated safely by this runner;
- detects deployed source changes before returning detailed coverage;
- bounds routine count, TAP output, duration, and cross-database parallelism.
The database role needs permission to execute the selected tests and
CREATE OR REPLACE the covered routines. Coverage briefly takes PostgreSQL
locks on those routines. Run it against a development or isolated test
database, not a production database.
Available settings:
postgresql-workbench.tests.patterns — pgTAP discovery globs matched against
schema.function; configurable globally or per workspace;postgresql-workbench.coverage.include and .exclude — glob patterns matched
against schema.name(identity arguments);postgresql-workbench.coverage.maxRoutines — maximum routines per request
(default 200);postgresql-workbench.coverage.maxOutputLines — TAP lines retained per test
(default 200);postgresql-workbench.coverage.maxOutputBytes — maximum TAP payload retained per
test (default 1 MiB);postgresql-workbench.coverage.maxParallelDatabases — independent databases run
concurrently (default 2);postgresql-workbench.coverage.timeoutMs — per-database suite timeout
(default 300000 ms).
Run PostgreSQL Workbench: Export Last Coverage to write the most recent native coverage
result as LCOV or versioned JSON. The export contains the exact canonical
code+moniker:// symbol URIs used by the editor, debugger, Test Explorer, and
coverage view, so overloaded routines remain unambiguous.
Current limitation: dependency discovery uses schema-qualified calls in the
pgTAP function AST. Dynamic SQL and unqualified calls cannot be mapped
reliably; explicitly selecting such an unmapped test reports an error, while a
larger suite selection skips it.
Requirements
- PostgreSQL 13+ with the pldebugger extension
shared_preload_libraries = 'plugin_debugger' in postgresql.conf (needs a restart)CREATE EXTENSION pldbgapi; in your database — the extension offers to run this for you
Coverage additionally requires CREATE EXTENSION pgtap;; it does not require
pldebugger, plugin_debugger, or pldbgapi.
pldebugger compatibility
The debugger works with the standard EnterpriseDB pldebugger packages
(postgresql-17-pldebugger on Debian/Ubuntu), distribution packages, and the
ng-galien fork.
- Standard/legacy builds: stepping, breakpoints, stack frames, and scalar
variables work. Some builds do not publish PL/pgSQL records, rows, or record
fields; those values are omitted cleanly without breaking the session.
- Enhanced fork / Docker image: additionally publishes composite and
anonymous record values as JSON, enabling structured expansion in VS Code.
The extension never requires the fork for basic debugging.
How It Works
This extension implements the Debug Adapter Protocol
(DAP) over PostgreSQL's pldbgapi debugging interface. Two database connections
are used: one controls the debugger, the other executes your SQL. Every session
uses a unique application_name and cleans up its own backends — concurrent
debug sessions (multiple windows or teammates on a shared dev server) don't
interfere with each other.
If a client crash still leaves a session behind, expand the open Connection
in Functions & Procedures, open Debug sessions, select the stale
session, and confirm Terminate. Recovery groups the listener and target as
one logical session and revalidates their reserved DAP application names before
terminating them; unrelated PostgreSQL connections are never selected.
Telemetry
This extension does not collect any telemetry data.
Support and security
- Problems and feature requests: GitHub Issues
- Setup diagnostics: run
PostgreSQL Workbench: Check Connection Requirements
- Security reports: see SECURITY.md
- Support policy and useful diagnostic information: see SUPPORT.md
License
MIT. Third-party components bundled in the extension are listed in
THIRD_PARTY_NOTICES.md.

