Monitor Pro


English | 简体中文 | 繁體中文 | 日本語
Monitor Pro is a real-time system resource monitoring tool that works directly in the VS Code status bar and a dedicated Webview panel. From the very beginning, the plugin was designed with cross-platform and remote development machine performance monitoring in mind, with full implementations on local systems, Remote SSH, and WSL.
A hybrid architecture delivers the best of both worlds: a native Go binary on Windows bypasses PowerShell/WMI overhead for over 10x faster data collection compared to systeminformation; macOS and Linux automatically fall back to the Node.js (systeminformation) data source, ensuring full platform compatibility.
[!WARNING]
Breaking Change 0.7.0
The status bar now defaults to only CPU, Memory Active, and Battery. Other metrics (Network, CPU Temperature, CPU Speed, Uptime, Disk I/O, Disk Space, OS Distro) must be manually enabled in VSCode settings under monitor-pro.metrics.*.
Rationale: with the new Resource Usage webview, most metrics are better visualized in their dedicated panel. Keeping the status bar lean avoids clutter for new users.
0.7.0 Major Update Overview
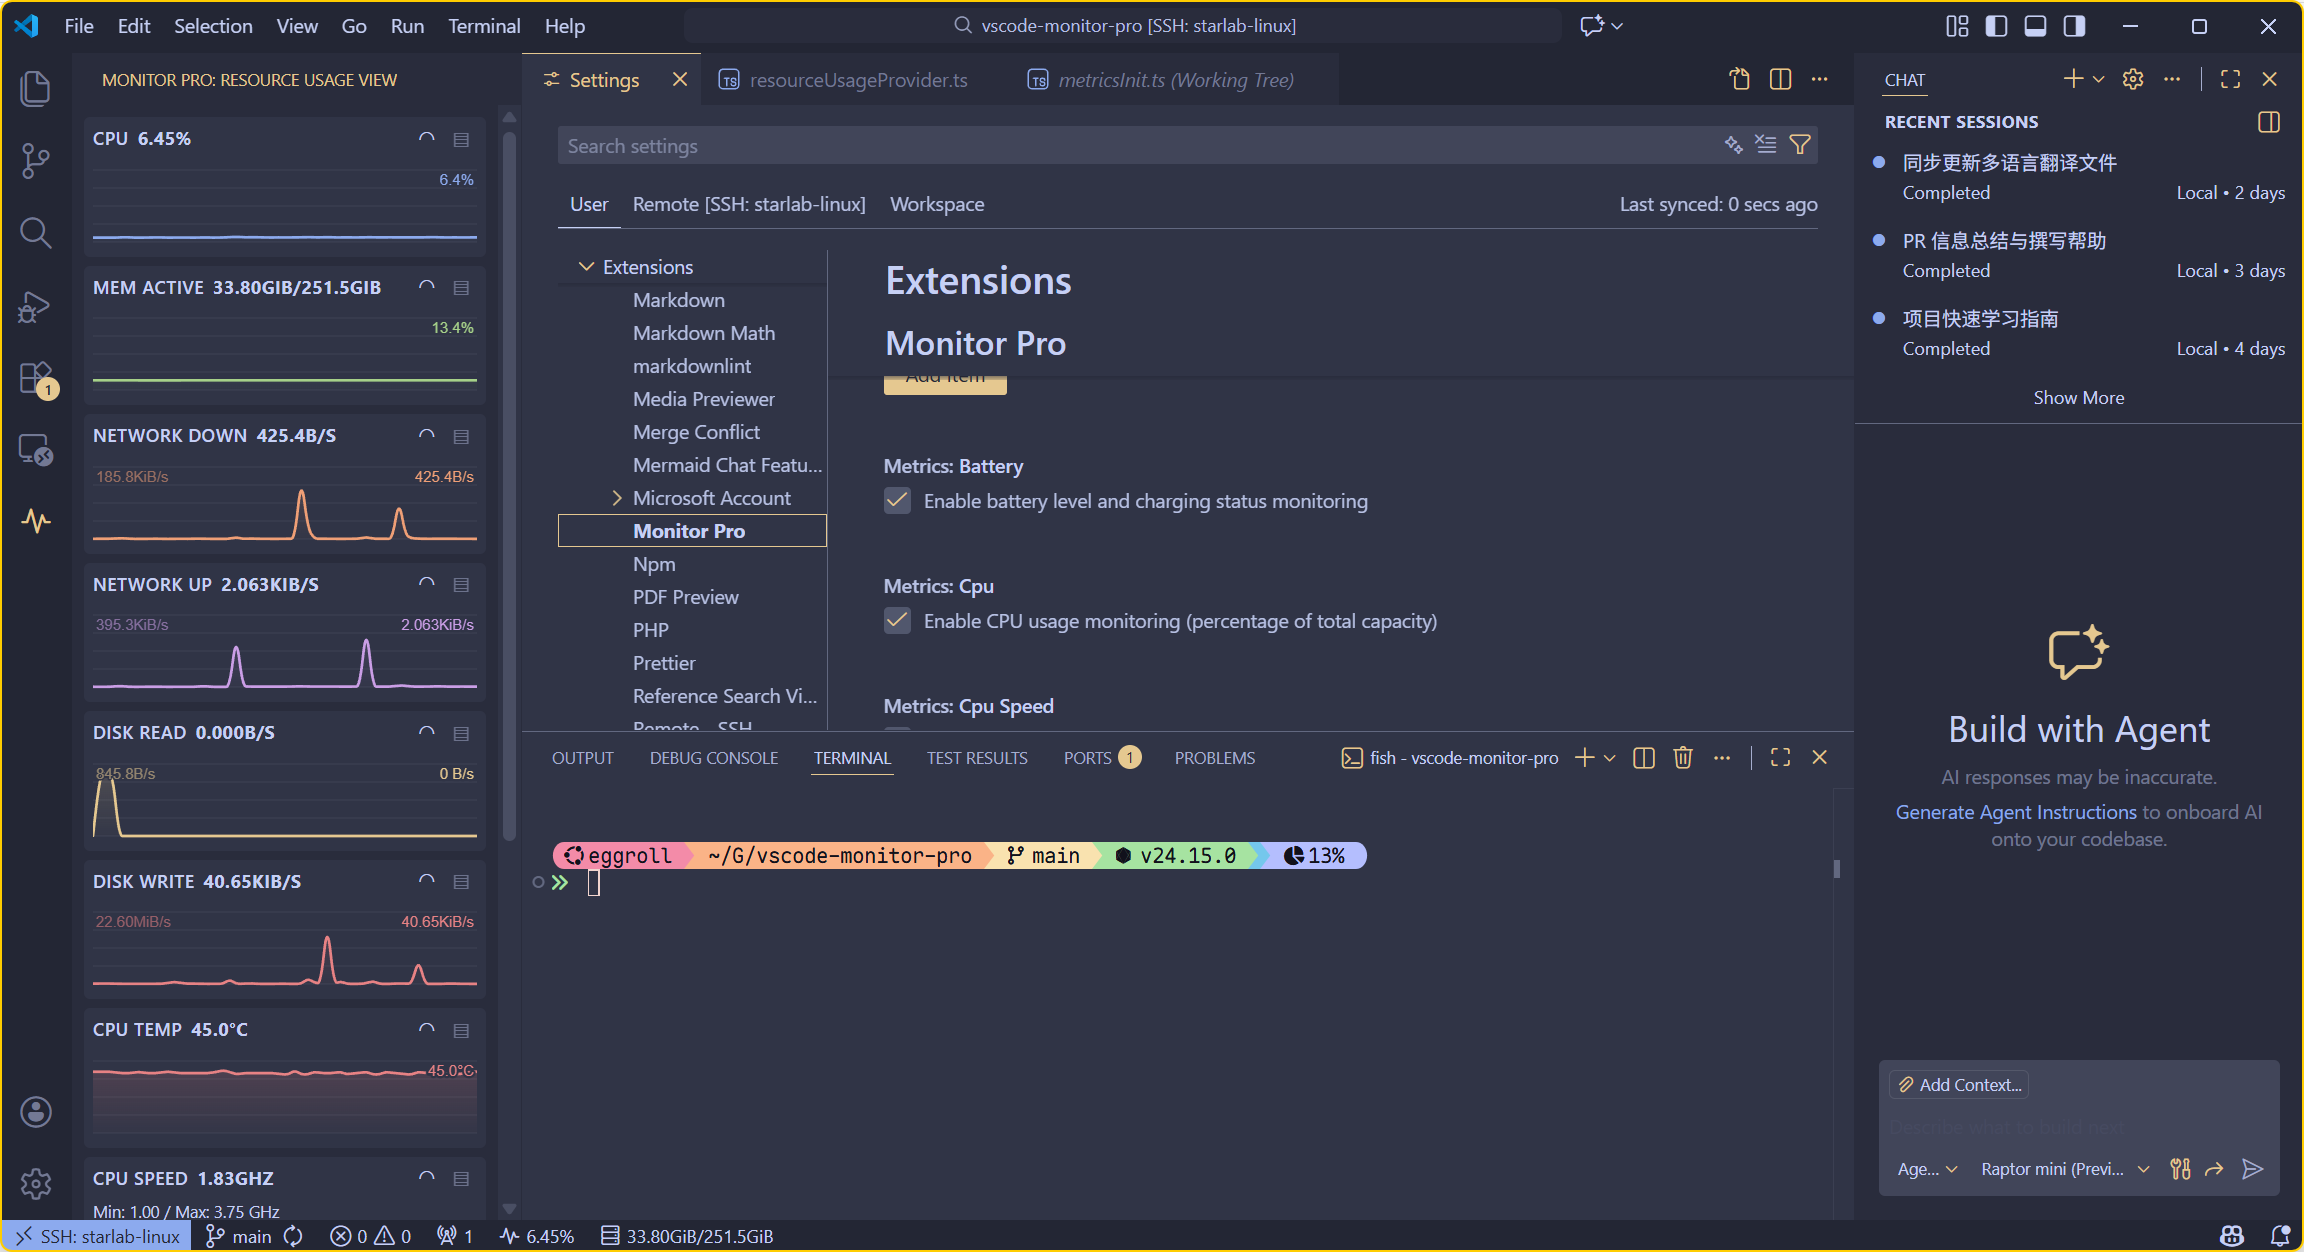
Side panel monitoring view:
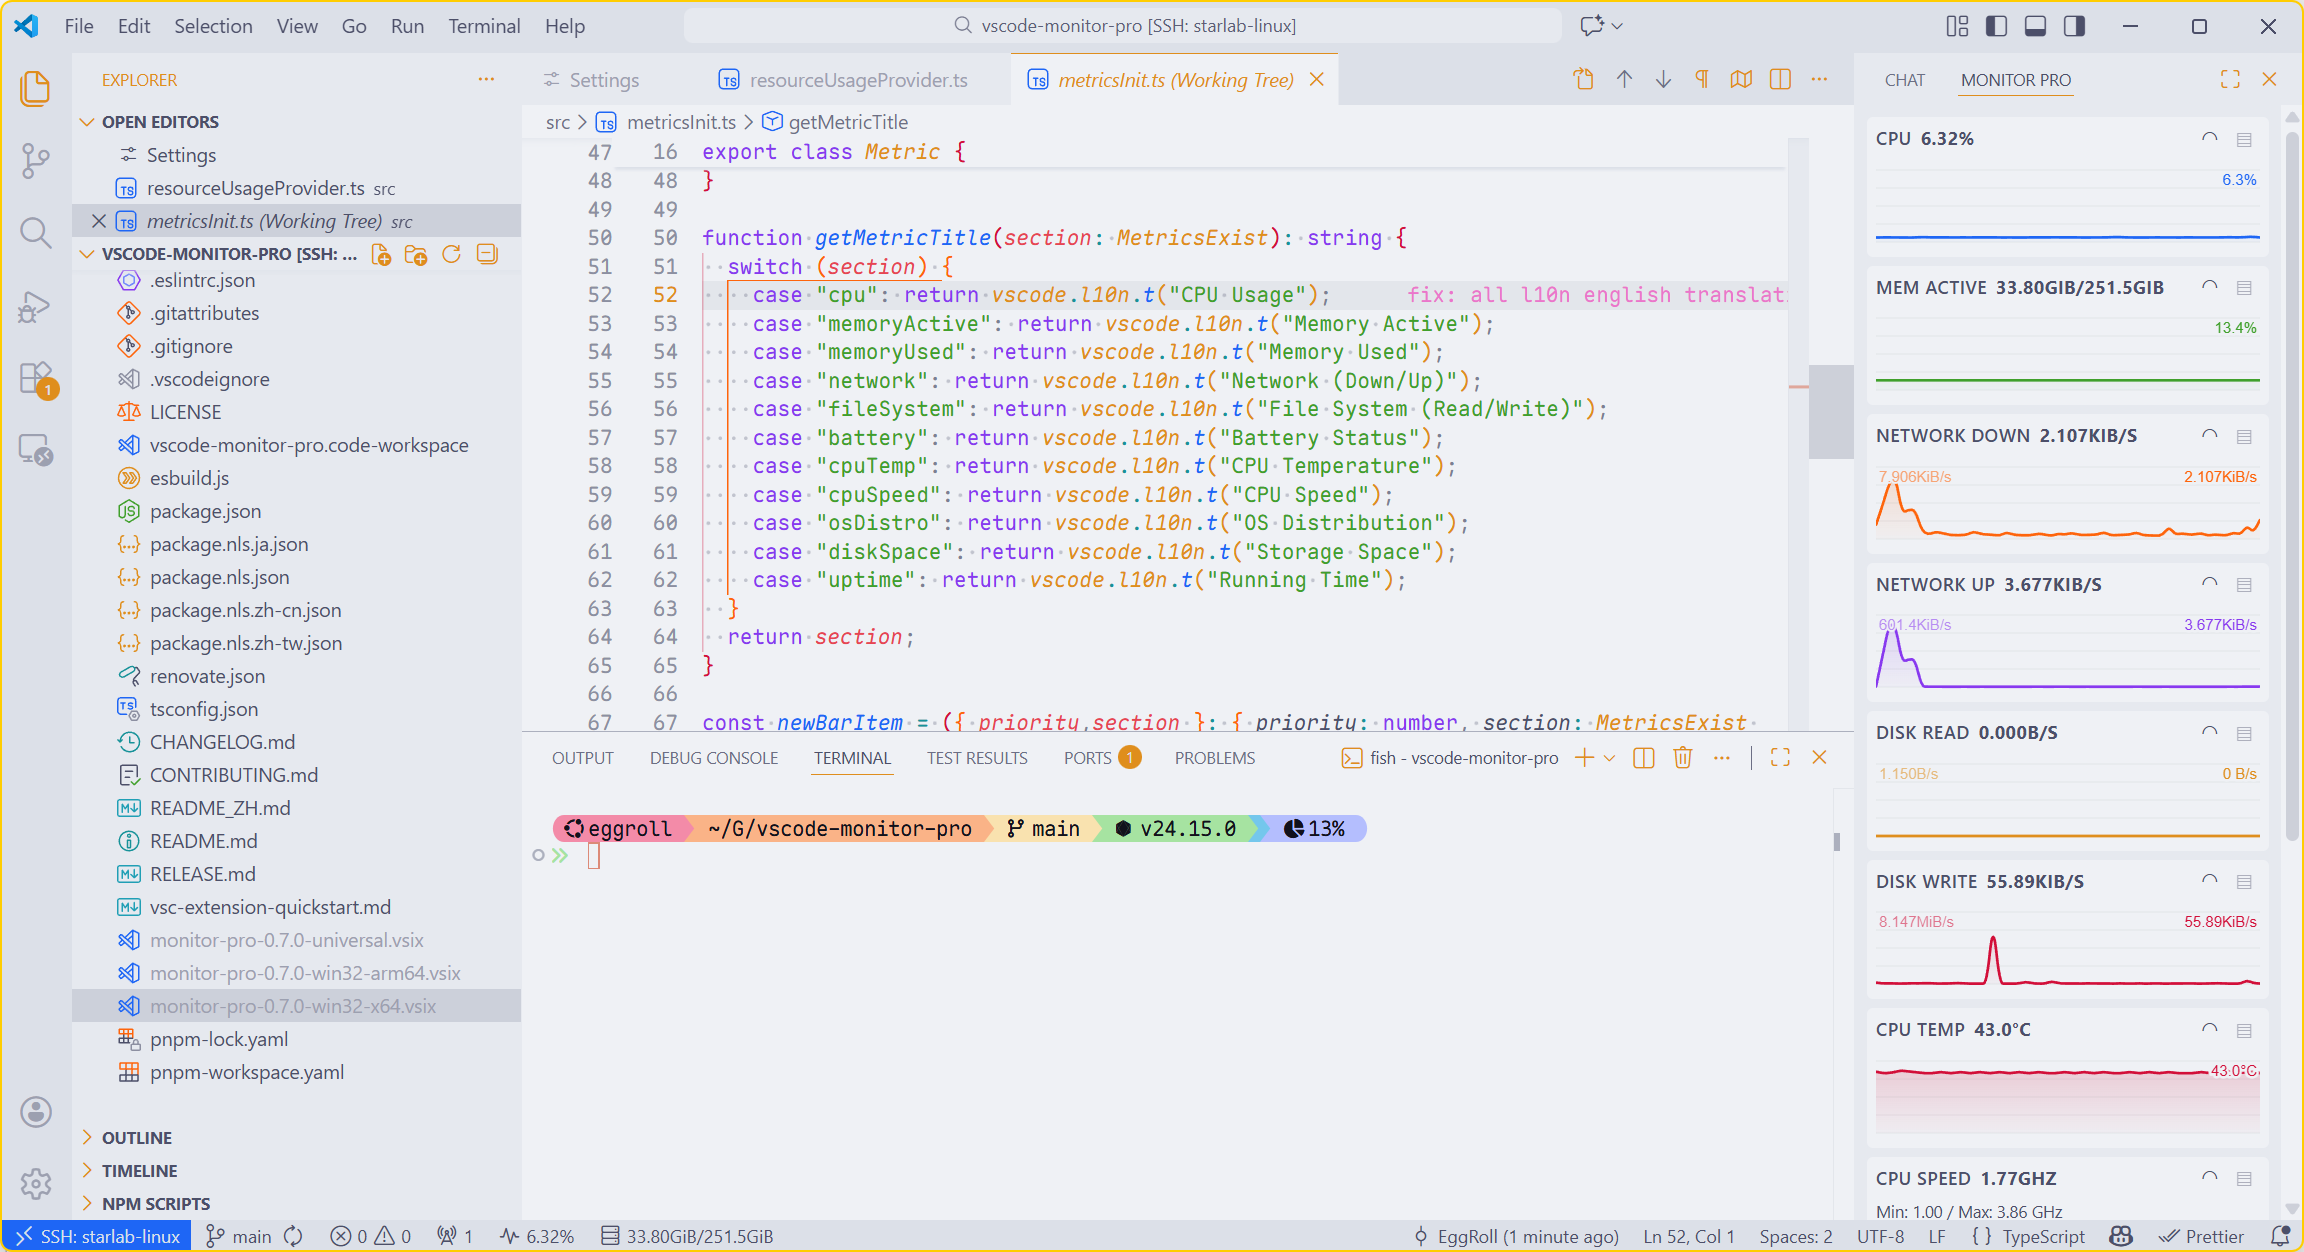
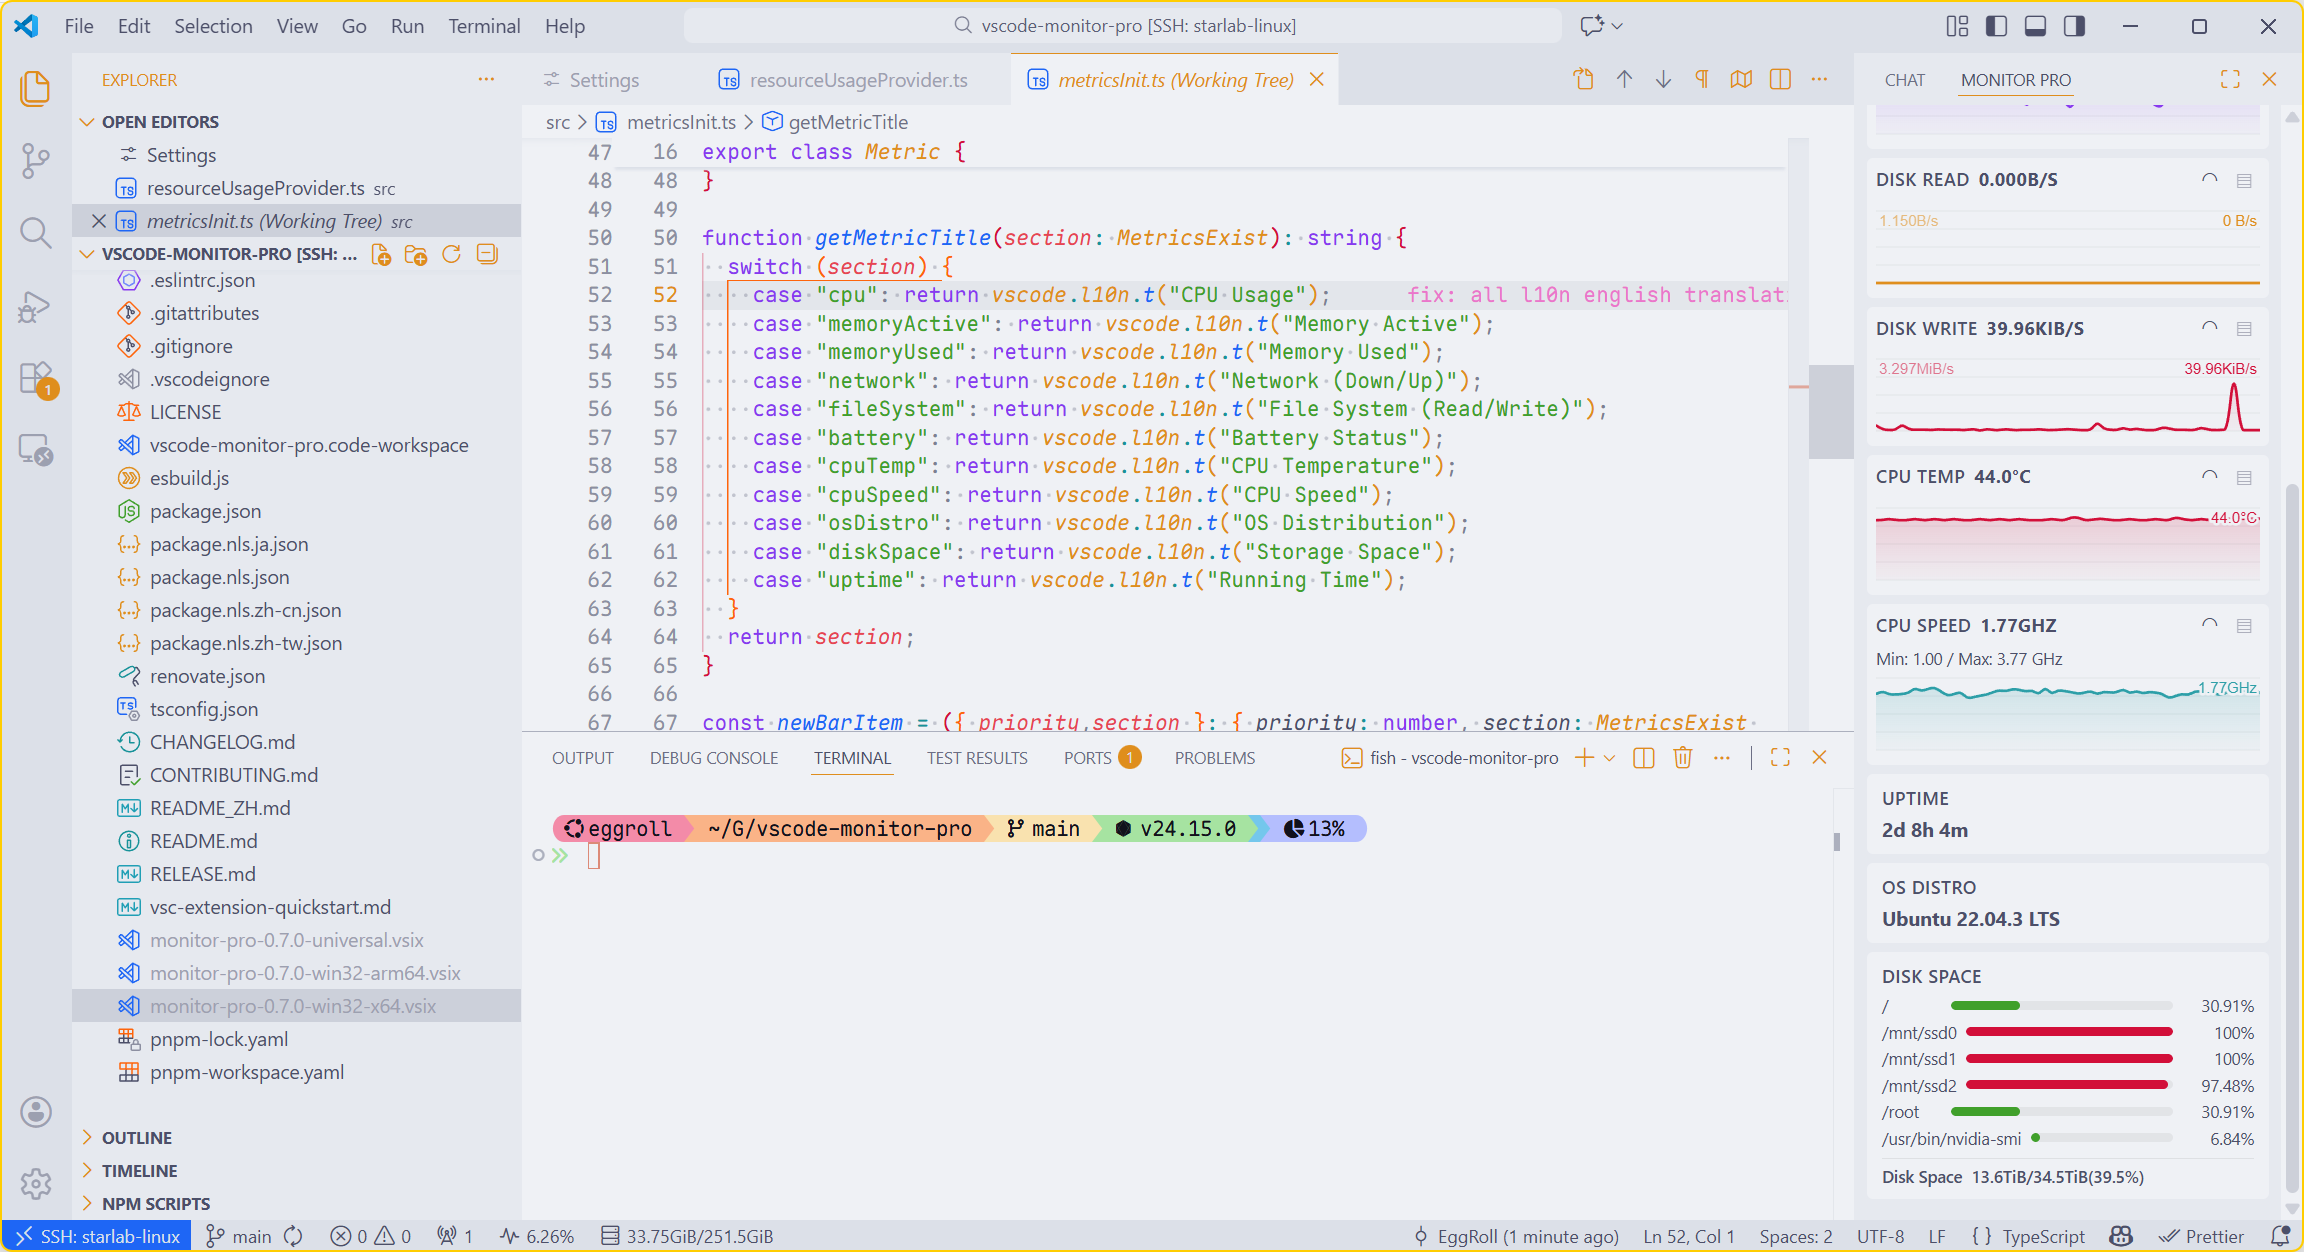
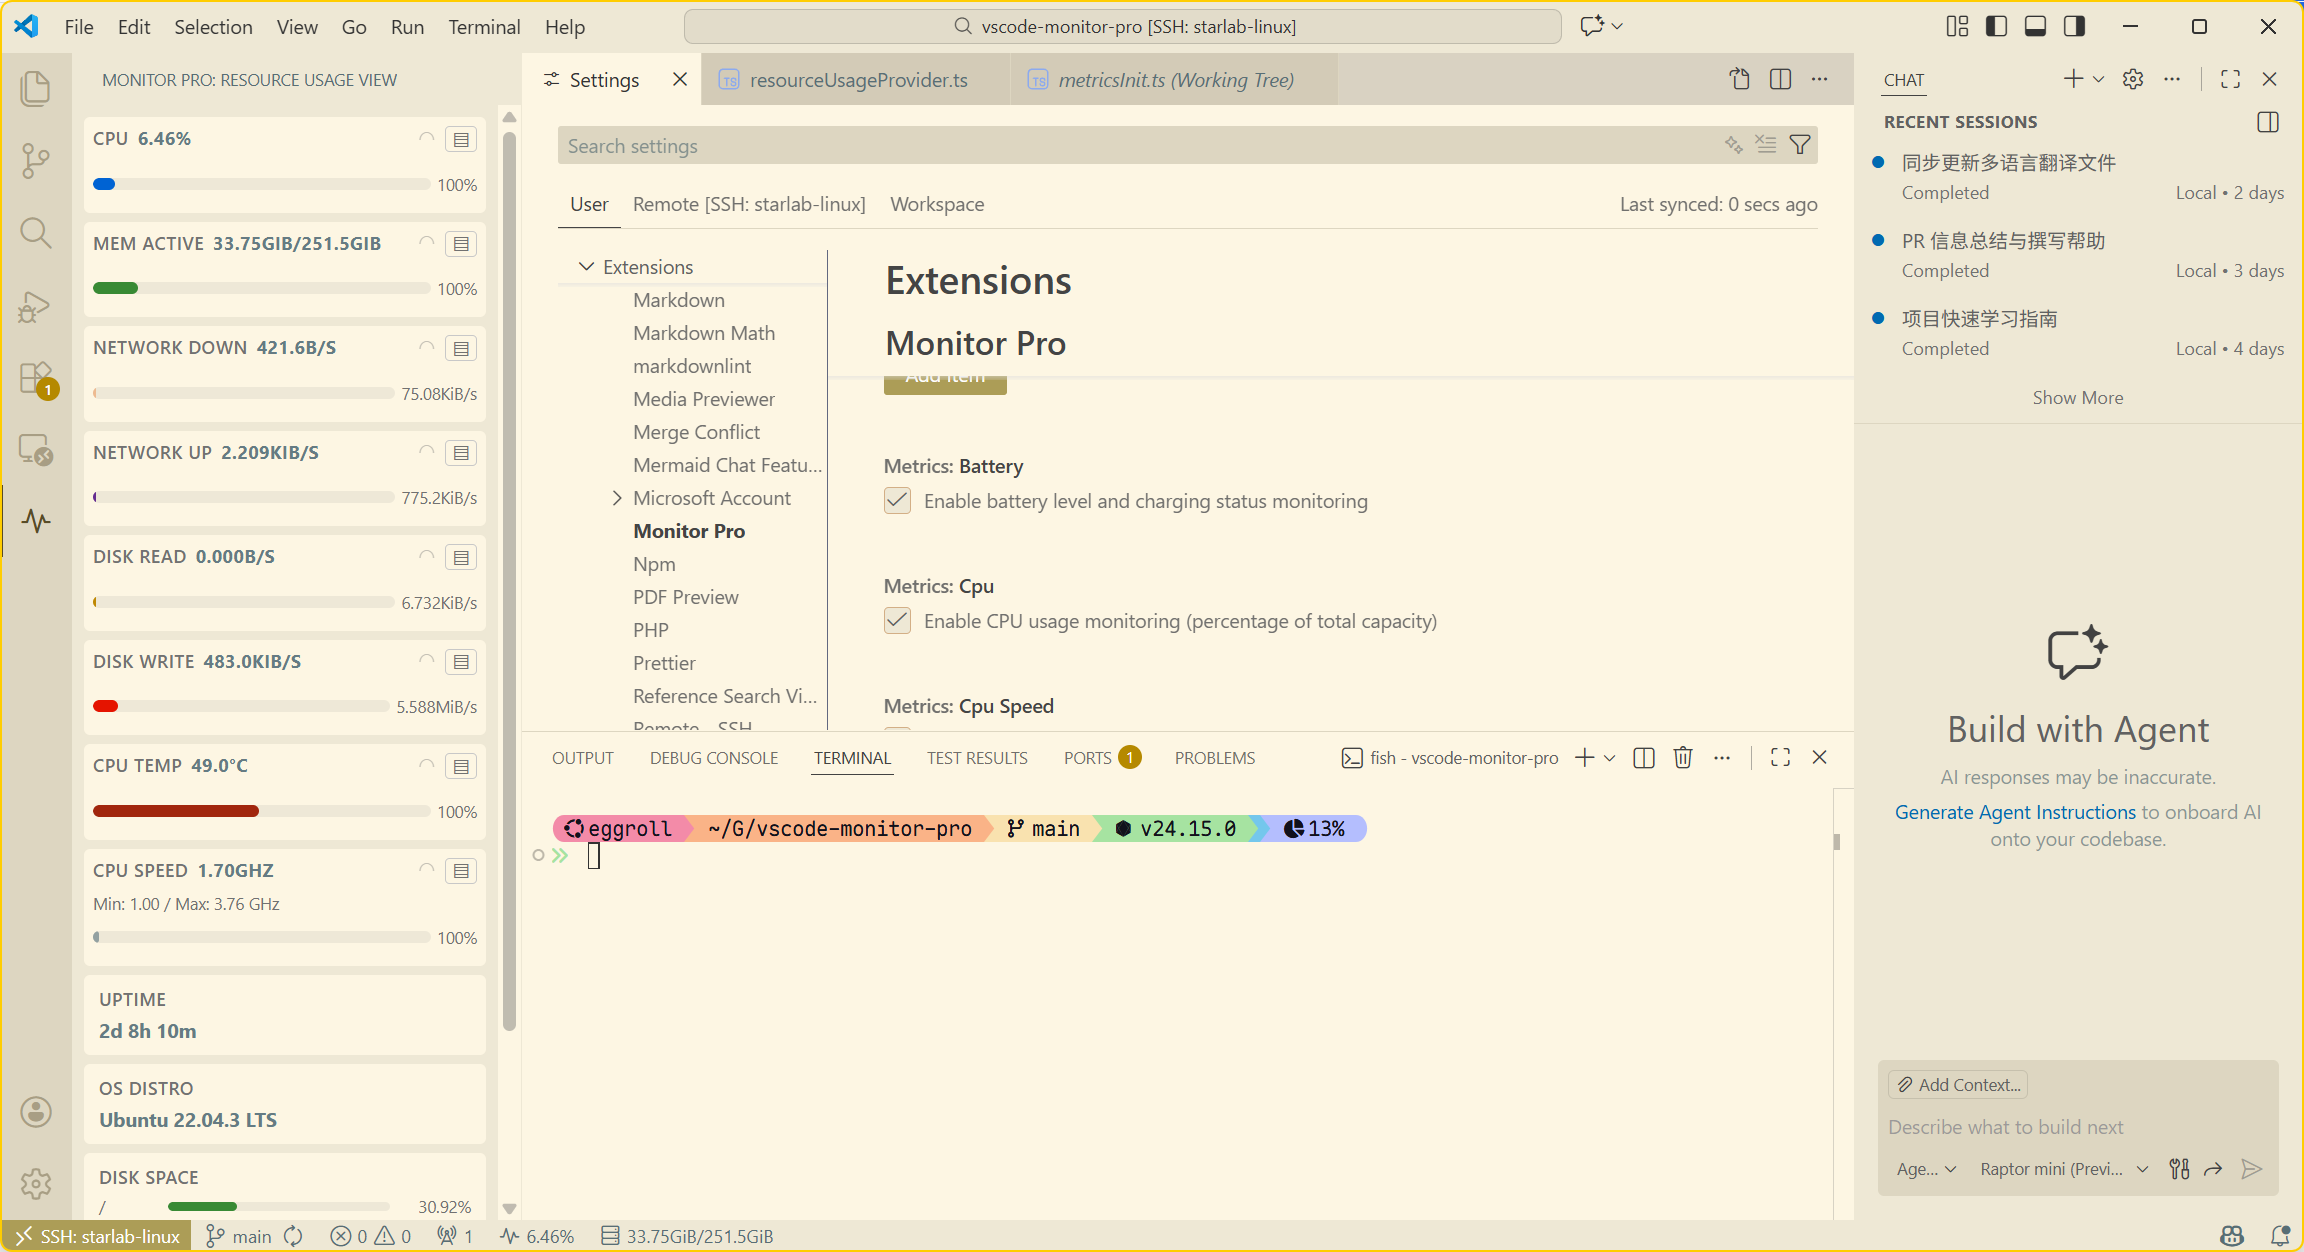
CPU speed, Disk and other info:
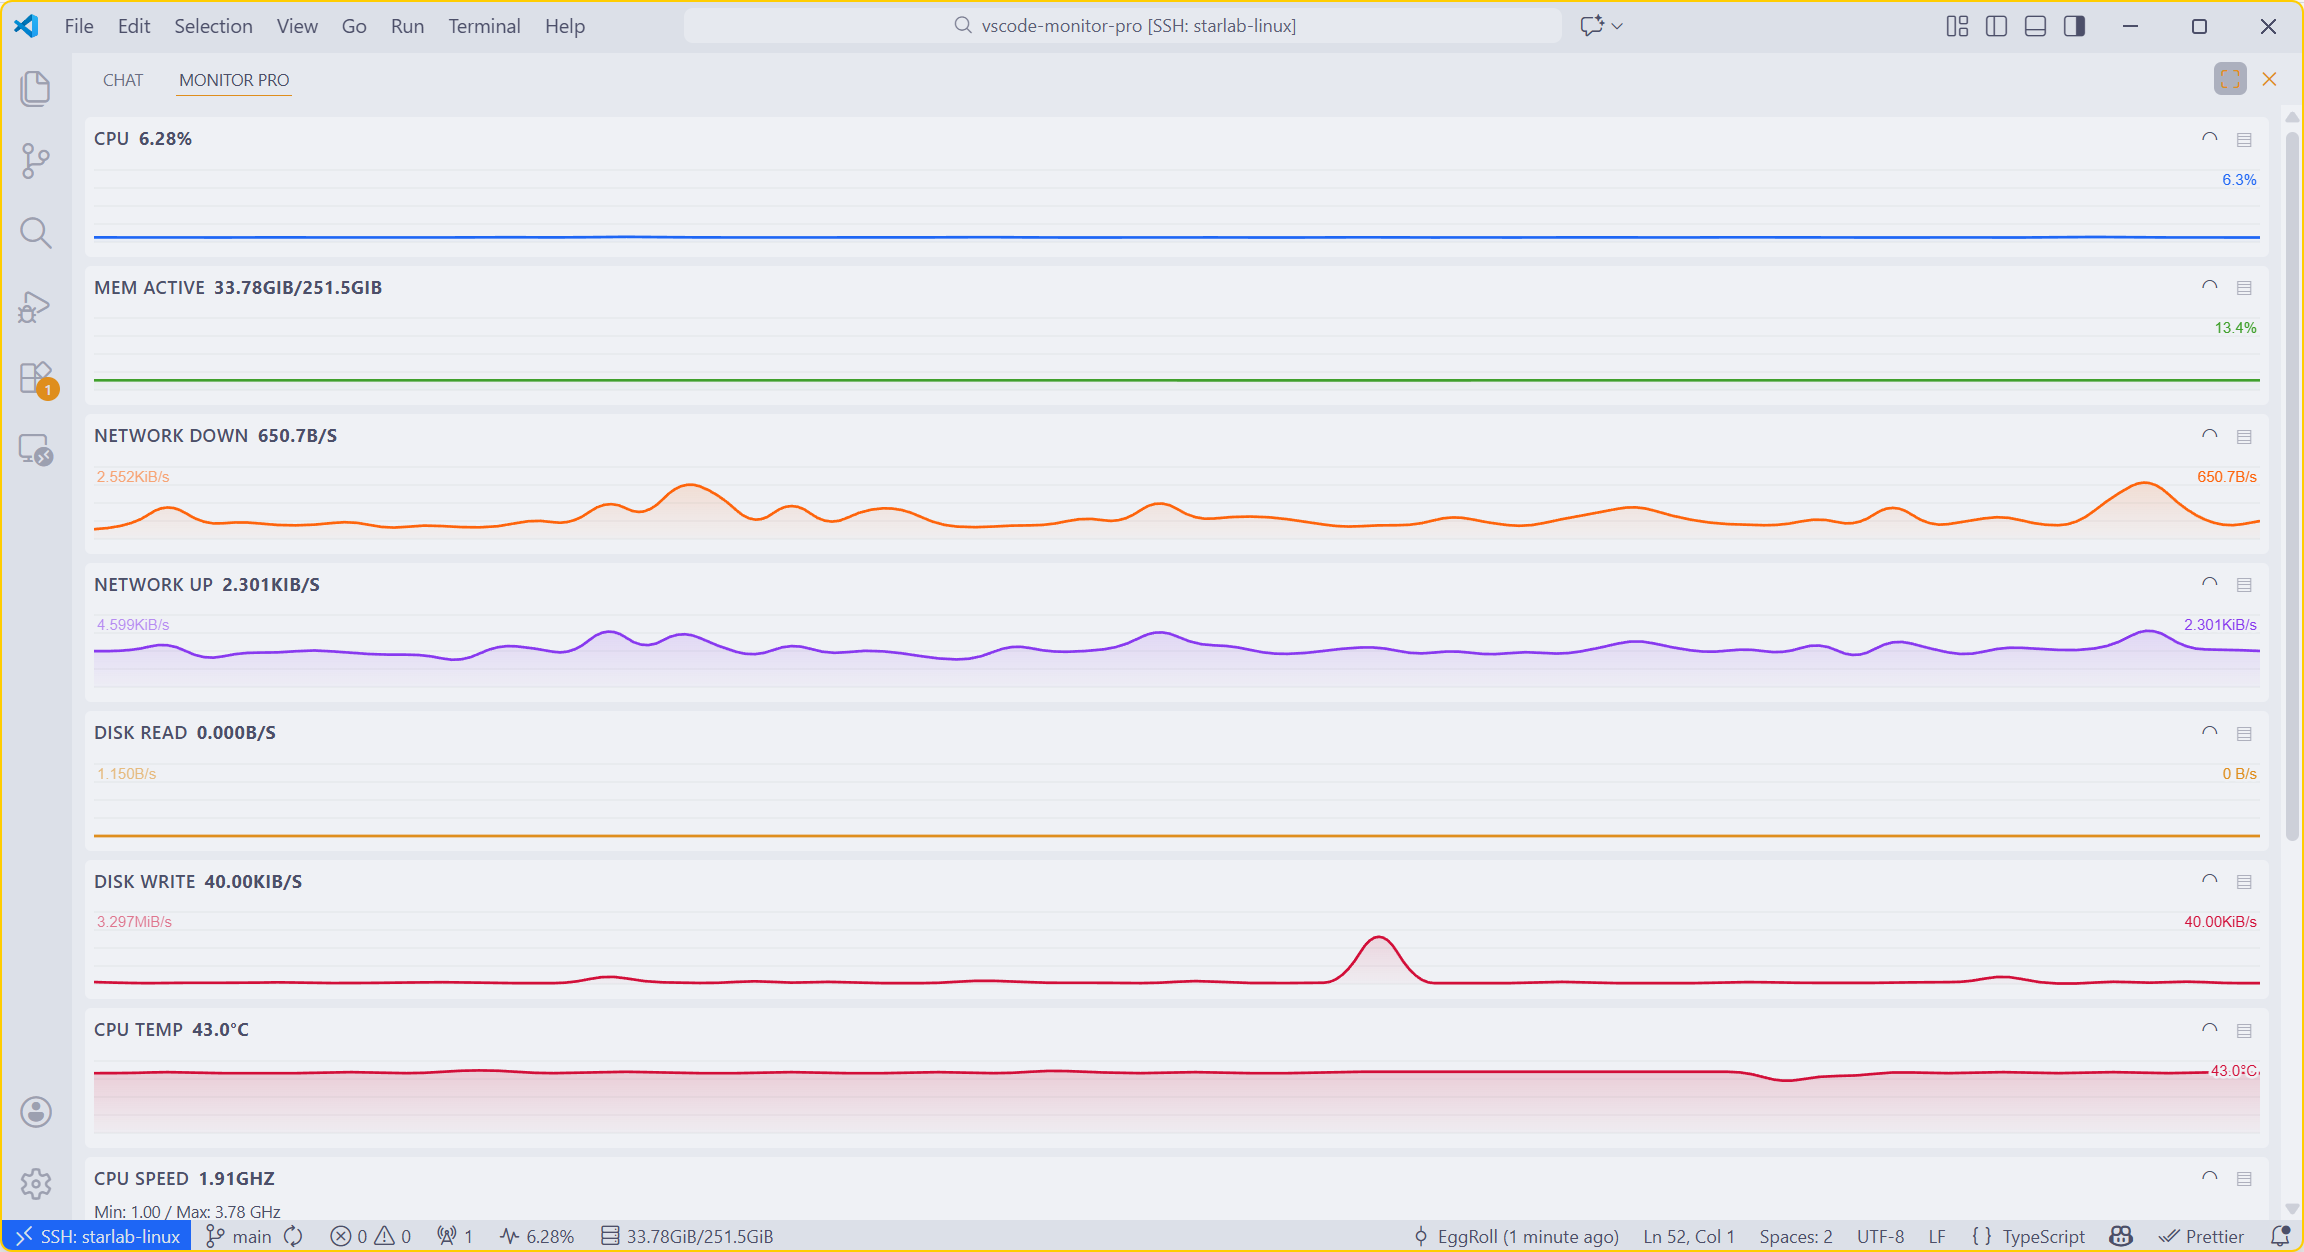
Auxiliary panel fullscreen view:
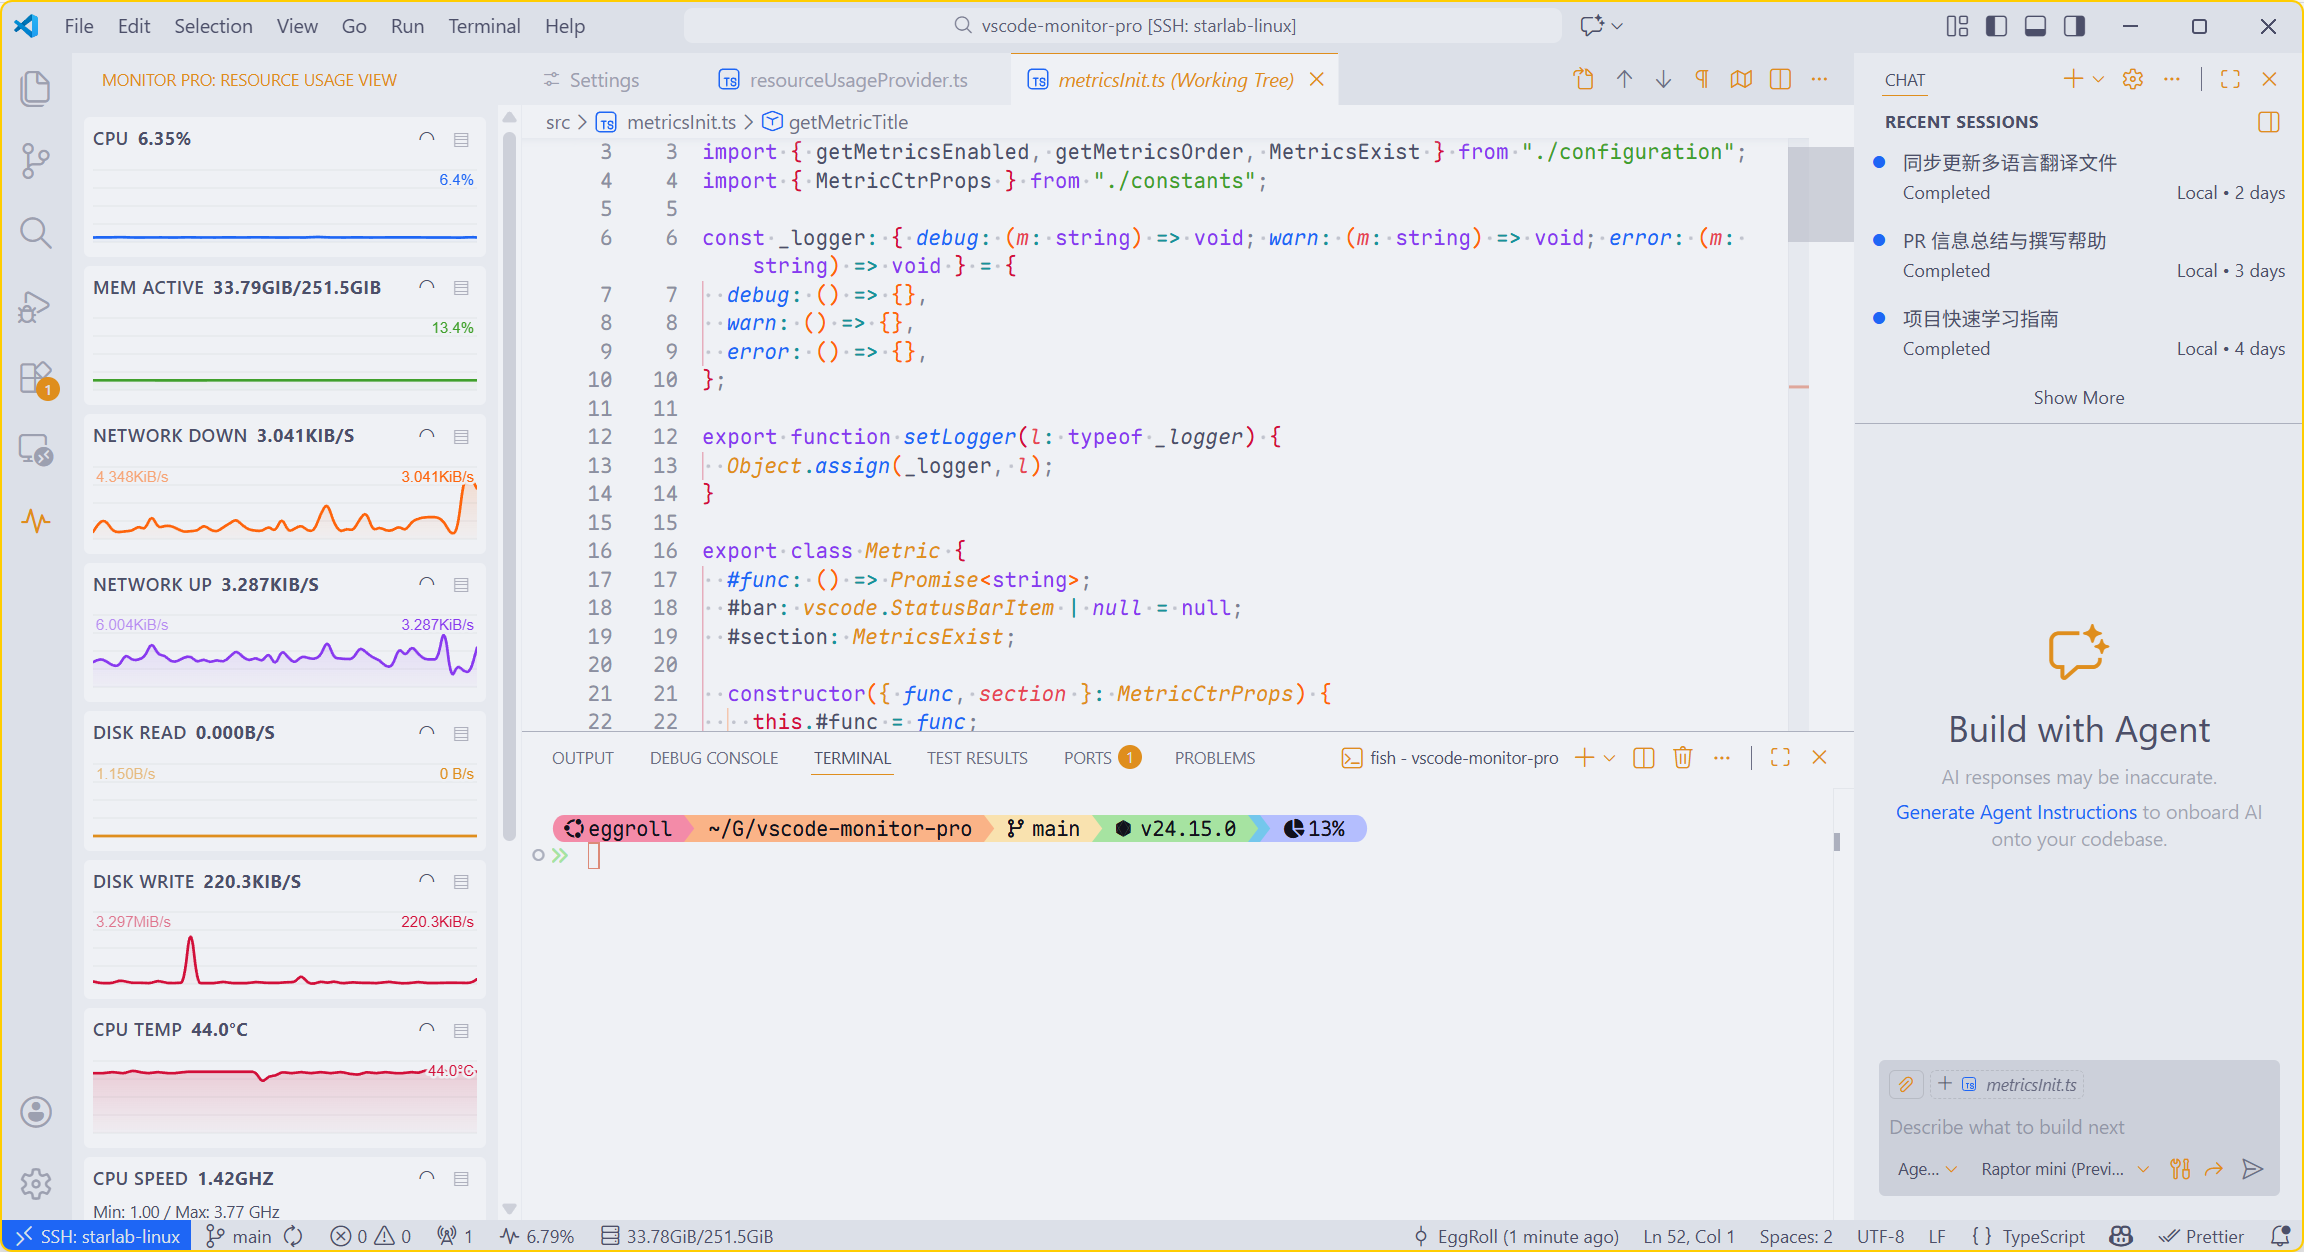
Main panel view:
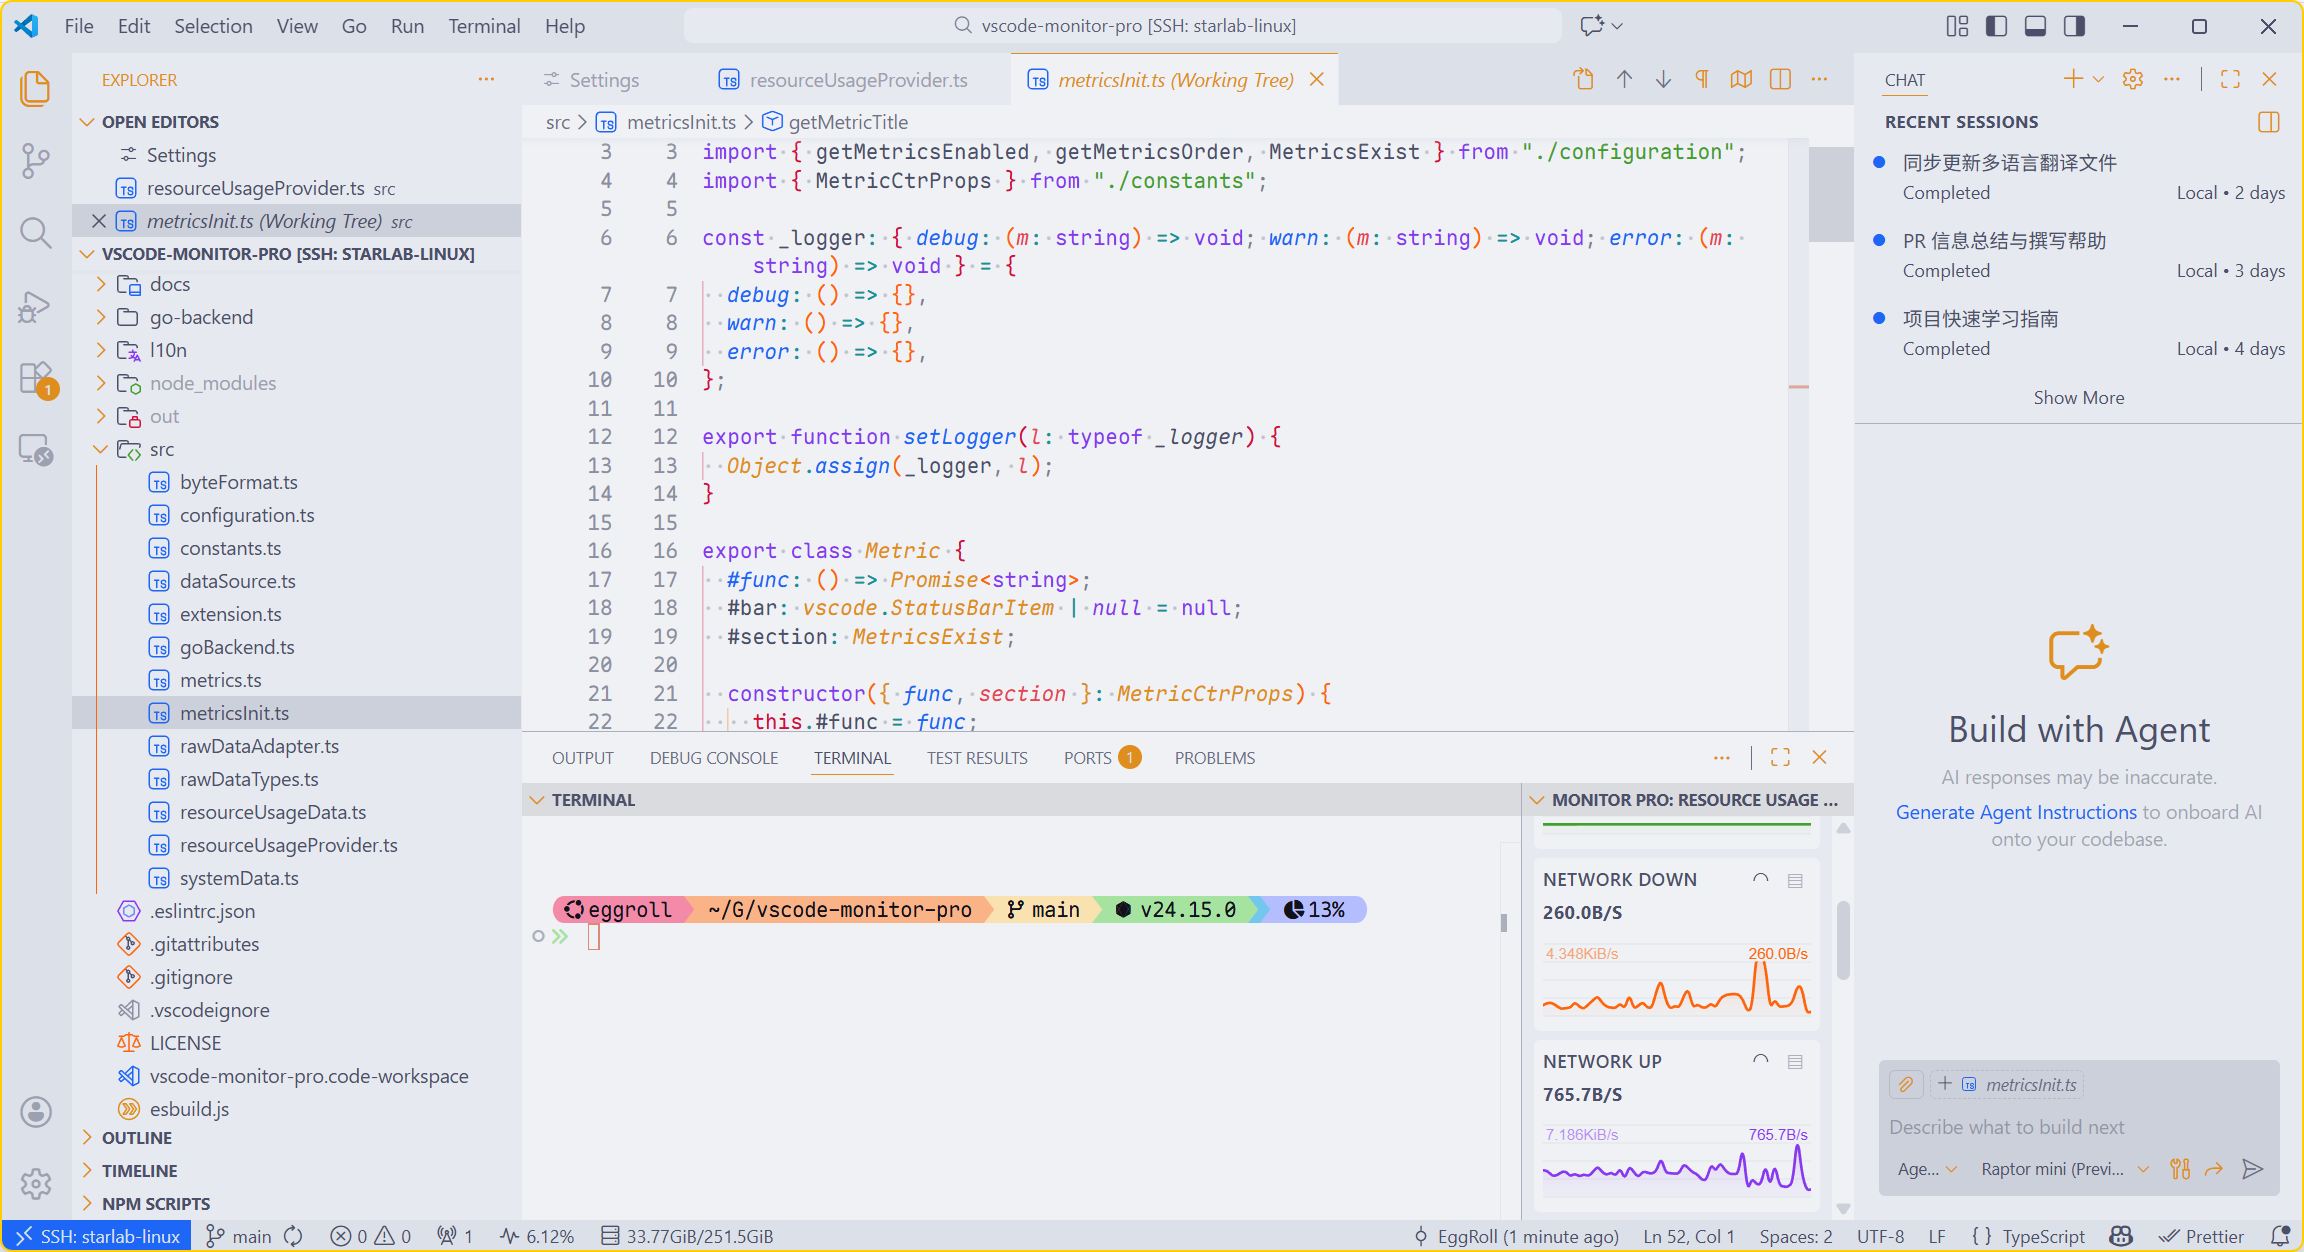
Bottom panel sidebar view:
Theme adaptive — Dark:
Bar chart demo:
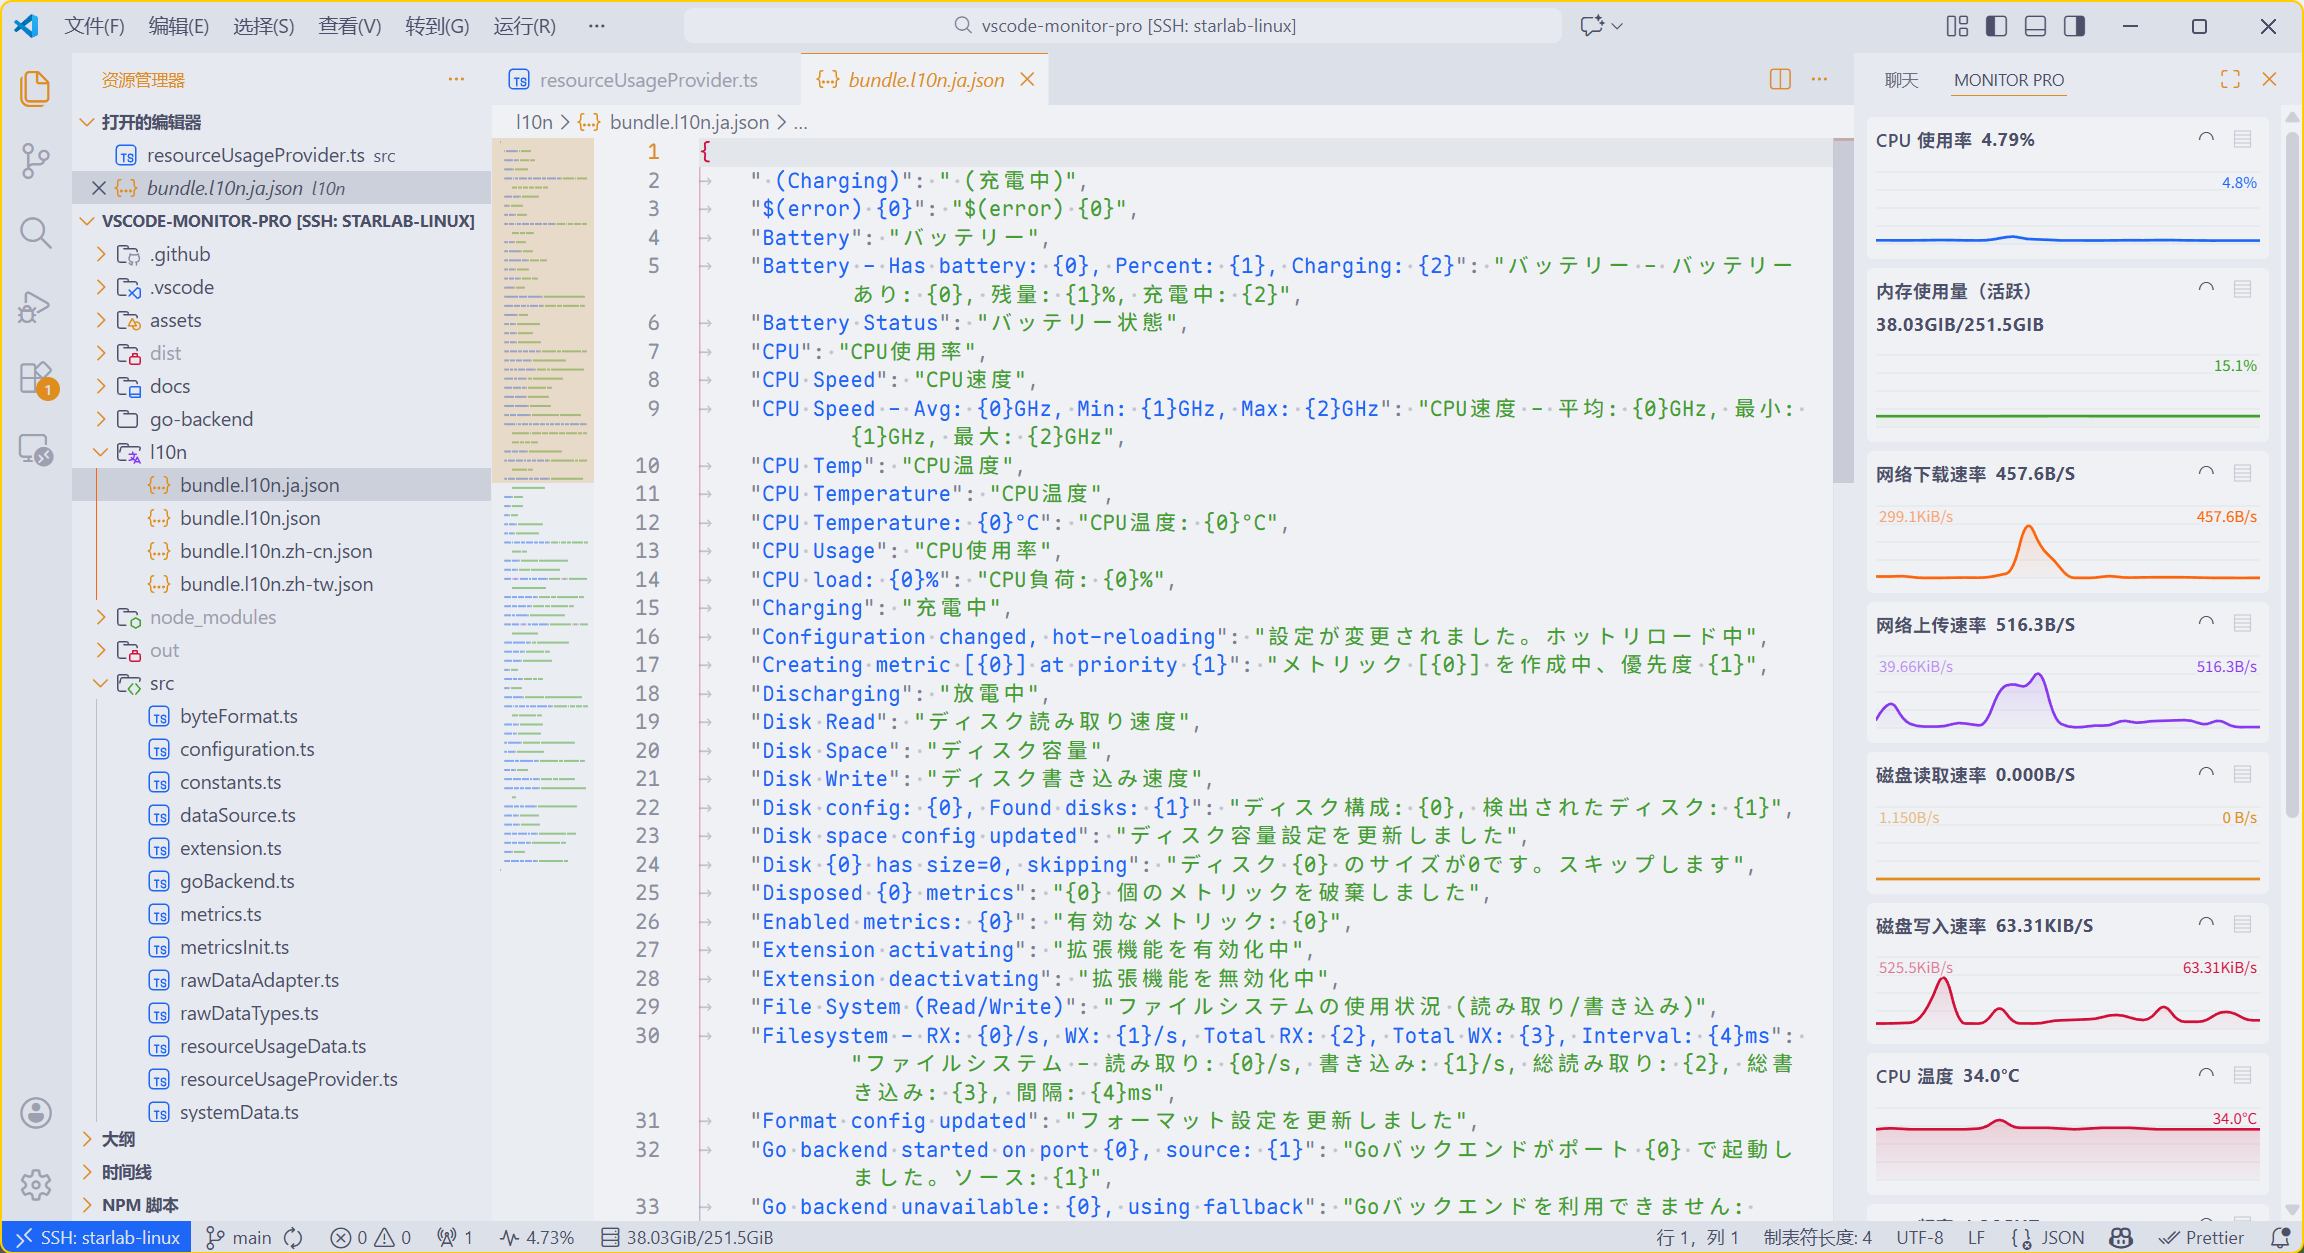
l10n — Japanese source:
l10n — Chinese, battery level, health and power:
Discharge and charge chart transition:
Features
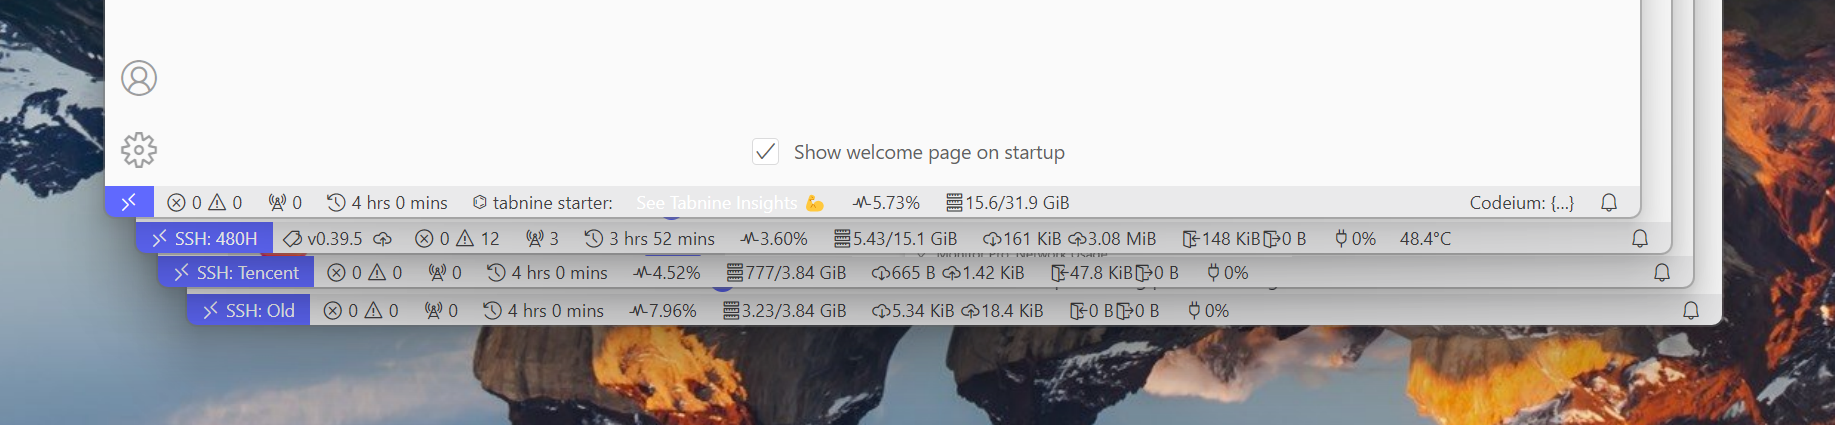
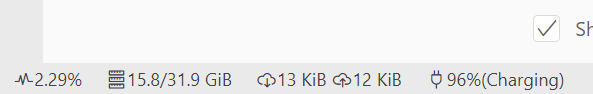
Status Bar
11 individually toggleable metrics shown as status bar items with Codicon icons:
| Metric |
Default |
Icon |
Example |
| CPU |
on |
$(pulse) |
73.2% |
| Memory Active |
on |
$(server) |
4.21 / 15.6 GiB |
| Battery |
on |
$(plug) |
85.2% (Charging) |
| Memory Used |
off |
$(server) |
8.15 / 15.6 GiB |
| Network |
off |
$(cloud-download) $(cloud-upload) |
125 KiB/s 2.34 MiB/s |
| CPU Temperature |
off |
$(flame) |
52.3°C |
| CPU Speed |
off |
$(dashboard) |
3.81 GHz |
| Uptime |
off |
$(clock) |
2d 14h 32m |
| Disk I/O |
off |
$(log-in) $(log-out) |
50.2 MiB/s 12.1 MiB/s |
| Disk Space |
off |
$(database) |
/ 45.2% 120/256 GiB |
| OS Distro |
off |
— |
Ubuntu 22.04 |
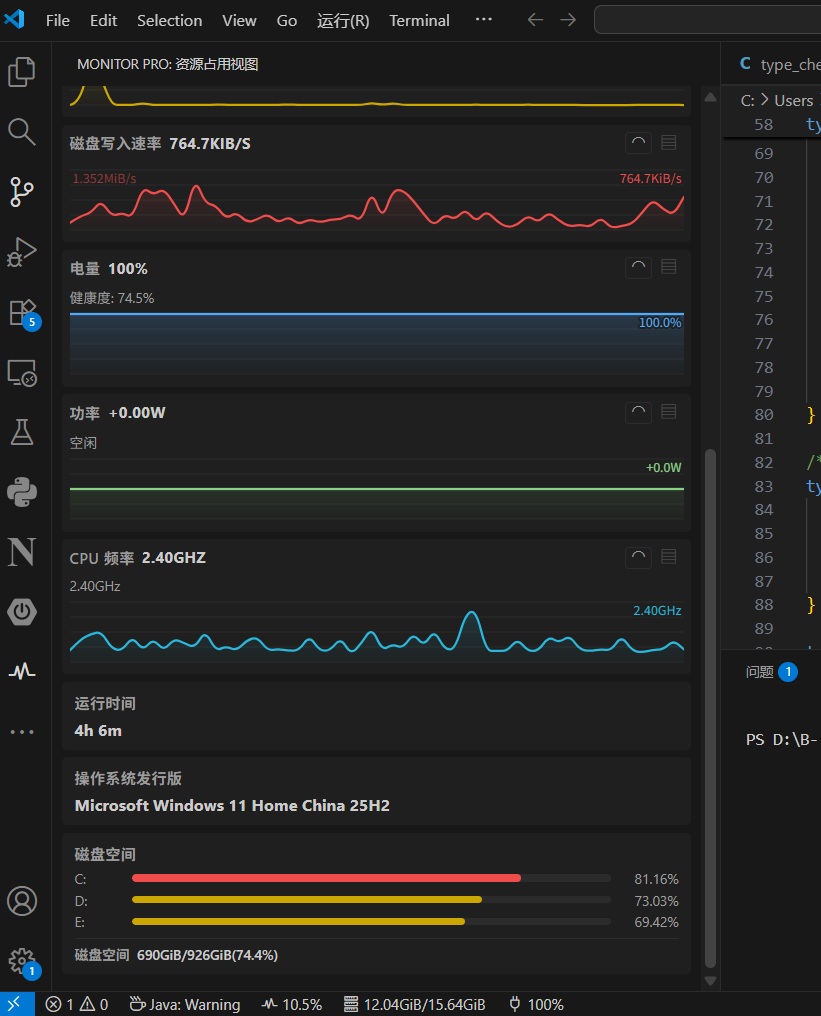
Resource Usage Webview
A dedicated side panel with live line/bar charts for 11 metrics: CPU, Memory (Active/Used), Network (Down/Up), Disk (Read/Write), Battery, Battery Power, CPU Temperature, CPU Speed.
Each chart features:
- Live 2D canvas rendering with gradient fill and Bezier curves
- Auto-scaling Y-axis with min/max labels
- Toggle between line and bar view
- Subtitle: battery health, charge/discharge state, temperature min, speed range
- 10–500 configurable history points
A lower Info section displays uptime, OS distro, and disk space with colored progress bars. Uptime and OS distro can be independently toggled via resourceUsage.showUptime / showOsDistro.
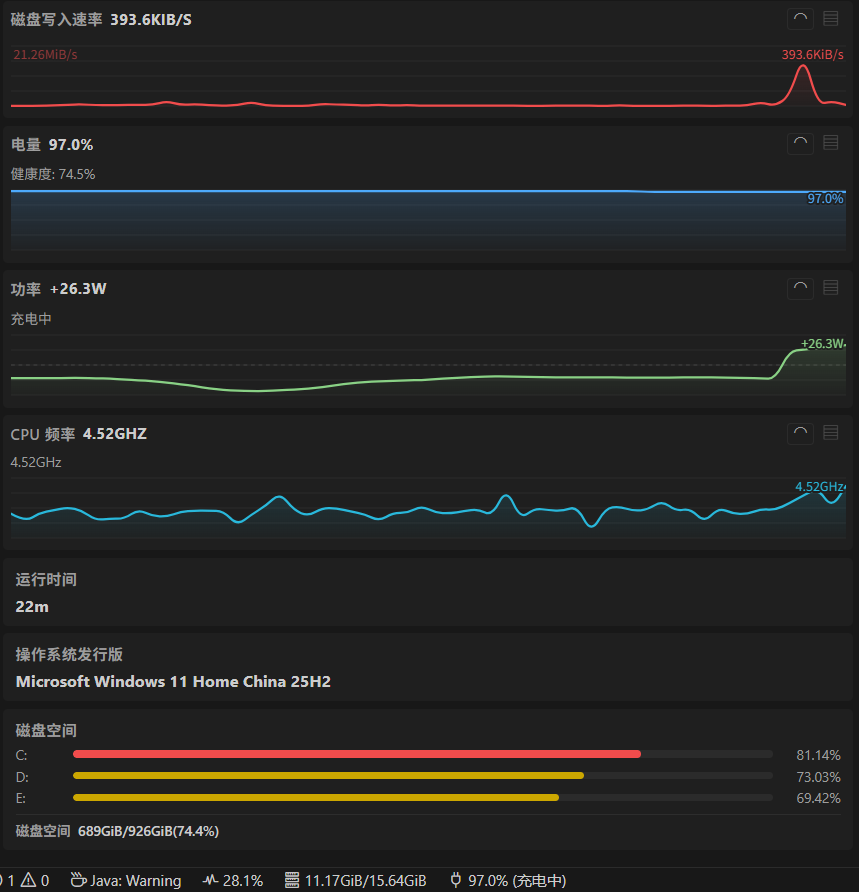
Battery Power Monitoring (currently fully implemented on Windows only)
Unique to this extension, Monitor Pro reports real-time battery power in watts:
- Signed values: positive for charging, negative for discharging
- Zero reference: a dashed guideline always marks 0W
- 5-sample moving average for stable readings
- Health percentage: ratio of current full capacity to design capacity
- State detection: Charging / Discharging / Idle
All formatted values (%, W, °C, GHz, byte rates) uniformly respect three configuration options:
showSpace: whether to insert a space between number and unitsingleUnit: abbreviate units to first letter (K, M, G)significantDigits: per-metric significant digits
These settings apply to the status bar and webview alike.
- Windows: Uses the same PDH counters as Task Manager (
% Processor Utility) for accurate CPU readings. CPU frequency is read dynamically via % Processor Performance — reflects actual turbo boost and power-saving states in real time.
- Linux: Non-blocking delta-based calculation from
/proc/stat with cached initial values — 30x faster than traditional blocking approaches.
- Works in local, Remote SSH, and WSL environments
- Go binary for Windows only; transparent fallback to Node.js on all platforms
- Multi-language: English, 简体中文, 繁體中文, 日本語
Configuration
Settings are grouped under monitor-pro.* and apply instantly via hot-reload.
| Setting |
Default |
Description |
monitor-pro.metrics.* |
varies |
Toggle each status bar metric on/off |
monitor-pro.metricsOrder |
— |
Reorder status bar items |
monitor-pro.refresh-interval |
2000 ms |
Polling interval (500–30000ms) |
monitor-pro.unitSystem |
binary |
binary (KiB/MiB) or decimal (kB/MB) |
monitor-pro.showSpace |
false |
Space between number and unit |
monitor-pro.singleUnit |
false |
Abbreviate unit to first letter (K, M, G) |
monitor-pro.significantDigits |
per-metric |
Significant digits (1–6) per metric |
monitor-pro.uptimeFormat |
auto |
Custom format with {d}, {h}, {m}, {s} |
monitor-pro.resourceUsage.charts |
— |
Chart enable/view/color per metric |
monitor-pro.resourceUsage.samplingPoints |
60 |
Chart history length (10–500) |
monitor-pro.resourceUsage.showUptime |
true |
Show uptime card in resource view |
monitor-pro.resourceUsage.showOsDistro |
true |
Show OS distro card in resource view |
monitor-pro.resourceUsage.diskSpaceMounts |
["all"] |
Mount filter for disk space chart |
monitor-pro.diskSpace |
["/", "C:"] |
Mount filter for status bar |
Screenshots (pre-0.6.0, still compatible with the current version)
Requirements
- VS Code 1.104+
- Windows 10/11 (for native Go backend; Linux/macOS use built-in fallback)
Developing
See CONTRIBUTING.md
Quick Start
pnpm install
pnpm run compile
Commands
| Command |
Description |
pnpm run lint |
Lint TypeScript sources |
pnpm run go:test |
Run Go backend tests |
pnpm run go:vet |
Run Go vet |
pnpm run go:build:win32-x64 |
Cross-compile Go binary for Windows x64 |
pnpm run go:build:win32-arm64 |
Cross-compile Go binary for Windows ARM64 |
pnpm run package:vsix:universal |
Package universal VSIX (macOS/Linux) |
pnpm run package:vsix:win32-x64 |
Package Windows x64 VSIX |
pnpm run package:vsix:win32-arm64 |
Package Windows ARM64 VSIX |
pnpm run gen-l10n |
Regenerate l10n bundle from source |
Inspiration & Acknowledgments
Inspiration
Acknowledgments
- TrafficMonitor: Adopted its PDH query lifecycle pattern (persistent handle + baseline collection + single collection per tick) for the Windows Go backend CPU monitoring, ensuring readings match Task Manager exactly.
Feedback
Issues and feature requests: github.com/nexmoe/vscode-monitor-pro/issues
Support
Please give a star on GitHub or leave a review on VS Code Marketplace!
