Aspire for Visual Studio Code
The official Aspire extension for VS Code. Run, debug, and deploy your Aspire apps without leaving the editor.
Aspire helps you build distributed apps — things like microservices, databases, containers, and frontends — and wire them together in code. This extension lets you do all of that from VS Code, with debugging support for C#, Python, Node.js, and more.
Table of Contents
Features at a Glance
| Feature |
Description |
| Run & debug |
Start your whole app and attach debuggers to every service with F5 |
| Dashboard |
See your resources, endpoints, logs, traces, and metrics while your app runs |
| Sidebar |
Browse running apphosts and resources in the Activity Bar |
| Integrations |
Add databases, queues, and cloud services from the Command Palette |
| Scaffolding |
Create new Aspire projects from templates |
| Deploy |
Generate deployment artifacts or push to cloud targets |
| MCP |
Let AI tools like GitHub Copilot see your running app via the Model Context Protocol |
| Multi-language |
Debug C#, Python, Node.js, Azure Functions, and browser apps together |
Prerequisites
Aspire CLI
The Aspire CLI needs to be installed and on your PATH. You can install it directly from VS Code with the Aspire: Install Aspire CLI (stable) command, or follow the installation guide for manual setup.
.NET
.NET 10 or later is required.
VS Code
VS Code 1.98 or later is required.
Getting Started
Open your Aspire project in VS Code, or create one with Aspire: New Aspire project from the Command Palette. Run Aspire: Configure launch.json file to set up the debug configuration, then press F5. The extension will build your apphost, start your services, attach debuggers, and print the dashboard URL. Open the dashboard from the Aspire panel when you need it, or opt into auto-launch with the aspire.dashboardBrowser setting.
There's also a built-in walkthrough at Help → Get Started → Get started with Aspire that covers the basics step by step.
The core flow is:
- Open an Aspire repo or create a starter with Aspire: New Aspire project.
- Let the Aspire view discover the AppHost.
- Press F5, or use Run Aspire apphost / Debug Aspire apphost from the editor.
- Inspect resources in the Aspire view and open the dashboard when you need logs, traces, metrics, or endpoint URLs.
Learn more in the Aspire VS Code extension documentation.
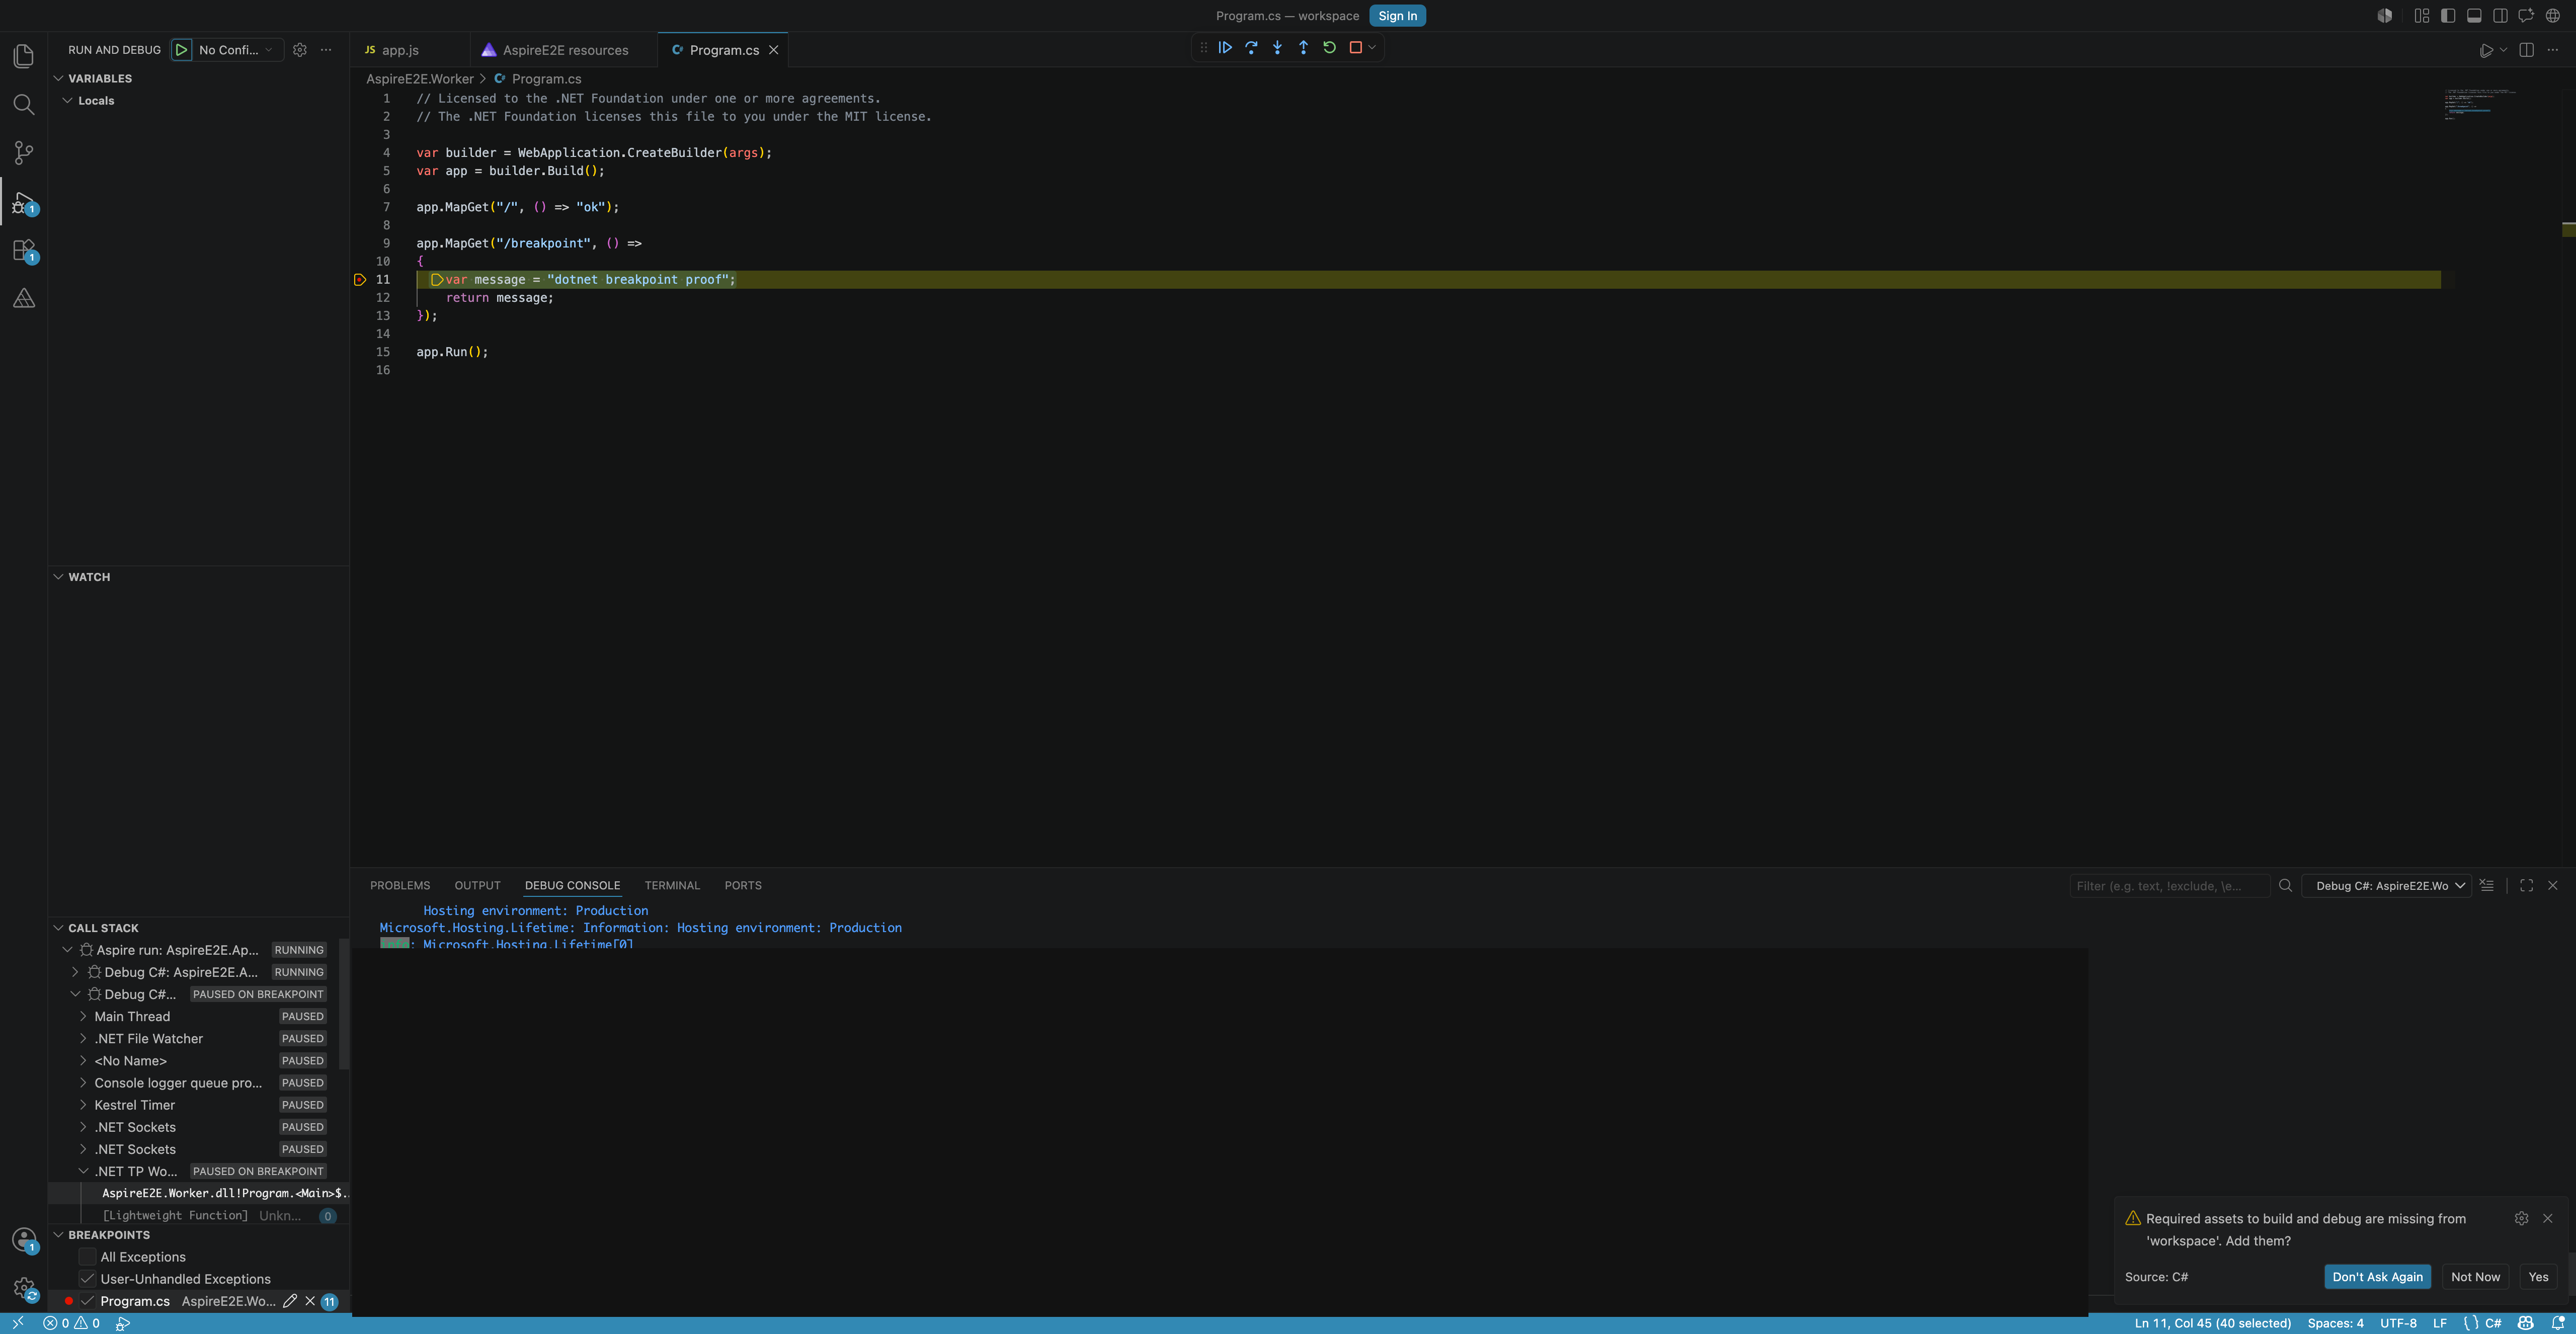
Running and Debugging
Launch configuration
Add an entry to .vscode/launch.json pointing at your apphost:
{
    "type": "aspire",
    "request": "launch",
    "name": "Aspire: Launch TypeScript starter",
    "program": "${workspaceFolder}/AppHost/apphost.mts"
}
When you hit F5, the extension builds the apphost, starts all the resources (services, containers, databases) in the right order, hooks up debuggers based on each service's language, and prints the dashboard URL.
You can also right-click an apphost.cs, apphost.ts, or apphost.js file in the Explorer and pick Run Aspire apphost or Debug Aspire apphost.
Deploy, publish, and pipeline steps
The command property in the launch config lets you do more than just run:
deploy — push to your defined deployment targets.publish — generate deployment artifacts (manifests, Bicep files, etc.).do — run a specific pipeline step. Set step to the step name.
{
    "type": "aspire",
    "request": "launch",
    "name": "Aspire: Deploy TypeScript starter",
    "program": "${workspaceFolder}/AppHost/apphost.mts",
    "command": "deploy"
}
Customizing debugger settings per language
The debuggers property lets you pass debug config specific to a language. Use project for C#/.NET services, python for Python, and apphost for the apphost itself:
{
    "type": "aspire",
    "request": "launch",
    "name": "Aspire: Launch MyAppHost",
    "program": "${workspaceFolder}/MyAppHost/MyAppHost.csproj",
    "debuggers": {
        "project": {
            "console": "integratedTerminal",
            "logging": { "moduleLoad": false }
        },
        "apphost": {
            "stopAtEntry": true
        }
    }
}
The extension adds an Aspire panel to the Activity Bar. It shows a live tree of your resources. In Workspace mode you see resources from the apphost in your current workspace, updating in real time. Switch to Global mode with the toggle in the panel header to see every running apphost on your machine.
Right-click a resource to start, stop, or restart it, view its logs, run resource-specific commands, or open the dashboard.
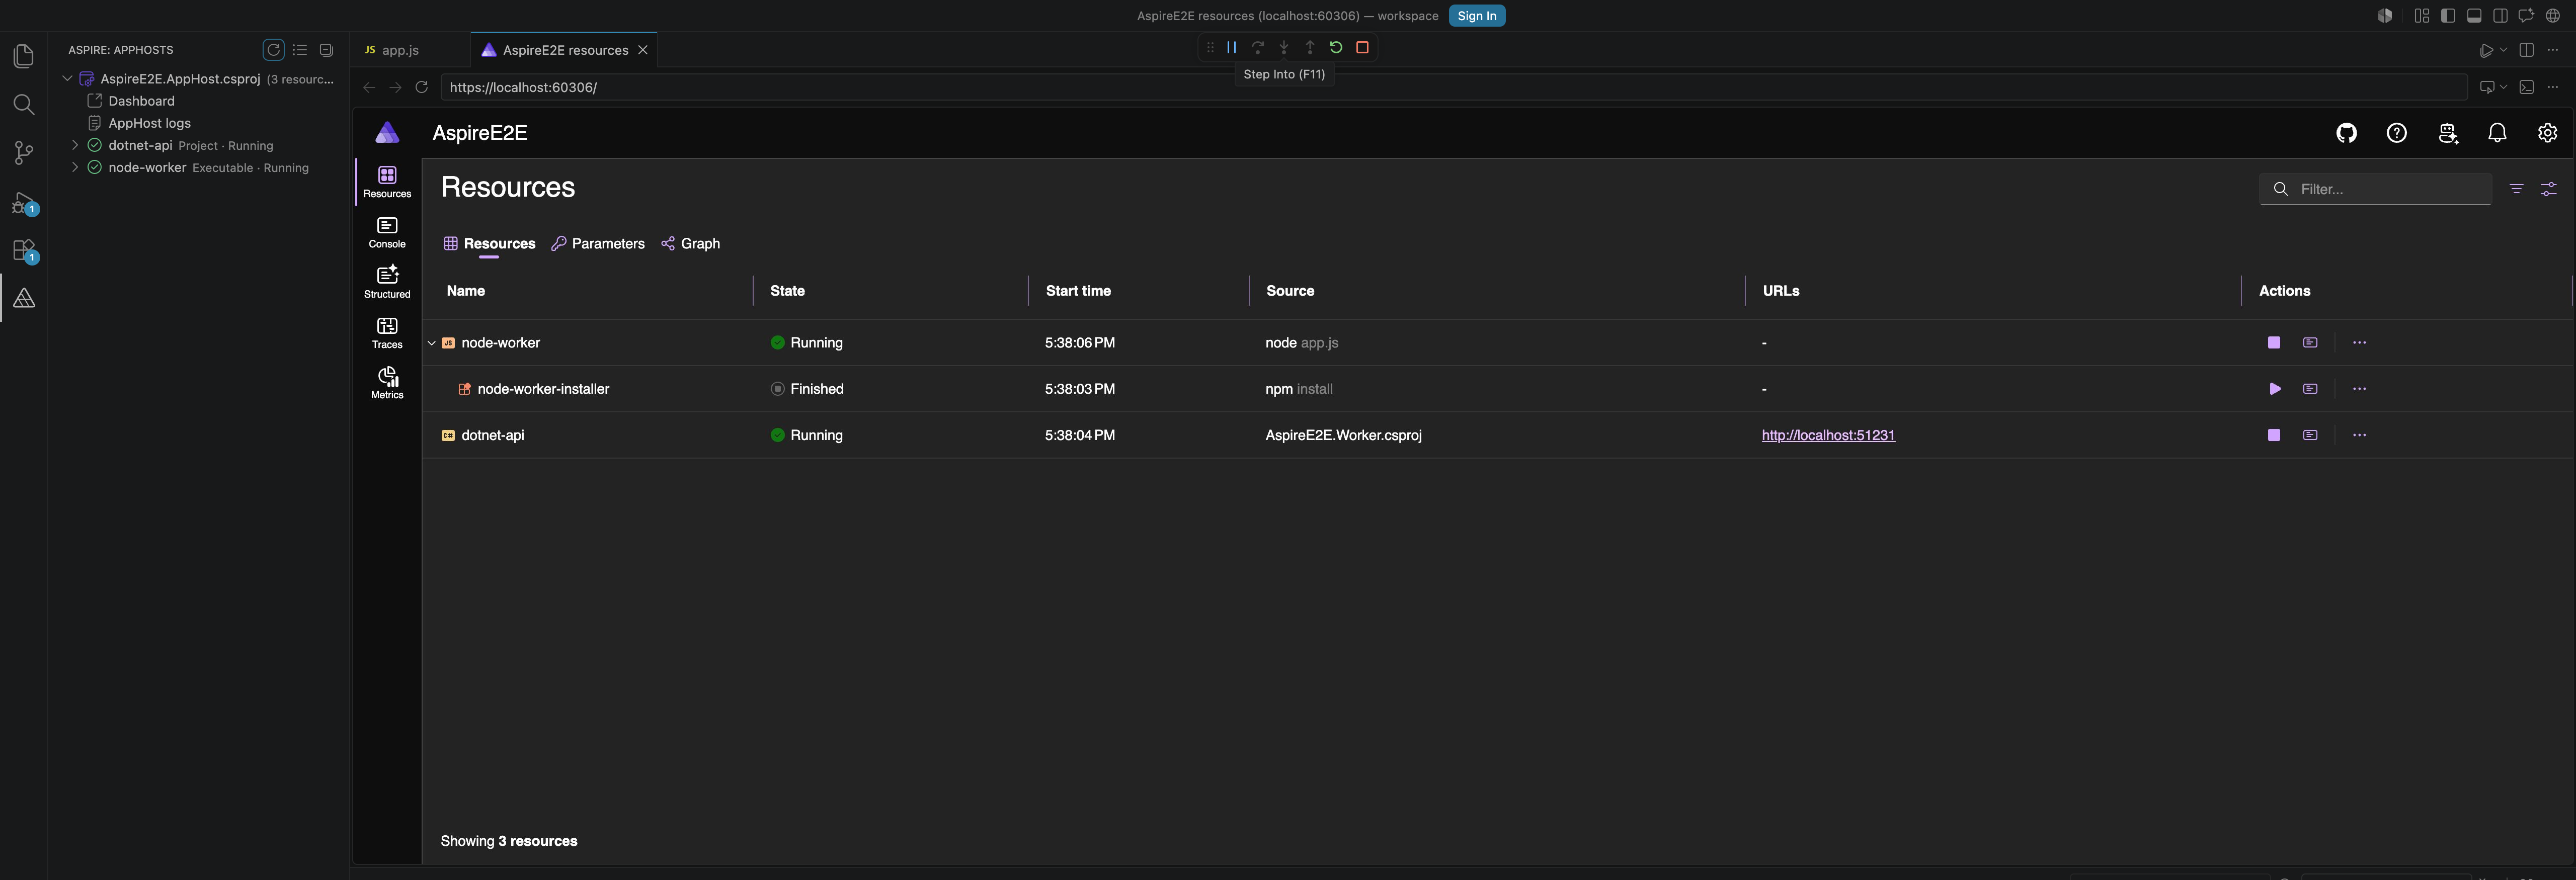
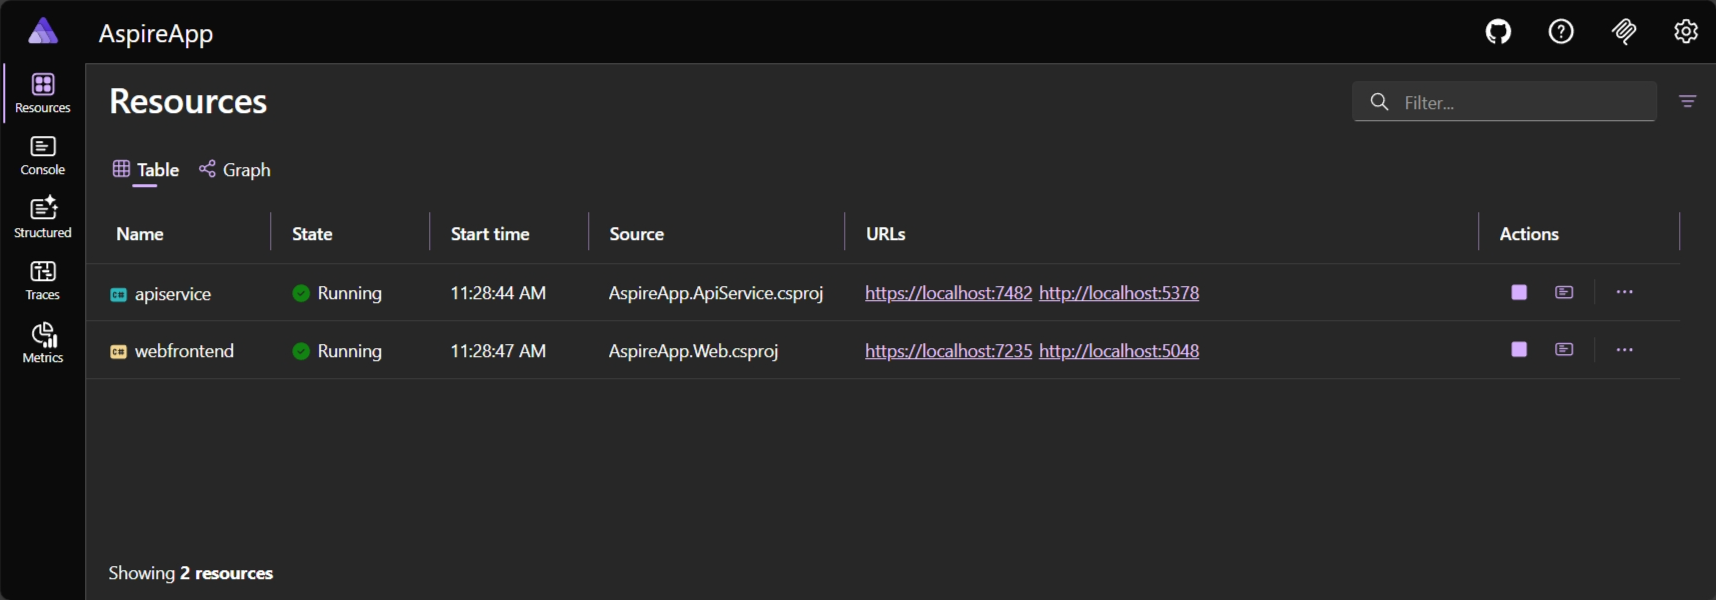
The Aspire Dashboard
The dashboard gives you a live view of your running app — all your resources and their health, endpoint URLs, console logs from every service, structured logs (via OpenTelemetry), distributed traces across services, and metrics.
By default, the dashboard URL is printed when your app starts and stays available from the Aspire panel. If you want the dashboard to open automatically, set aspire.dashboardBrowser to a notification, the system default browser, VS Code's integrated browser, or Chrome, Edge, or Firefox as a debug session. You can also set dashboardBrowser on a single launch.json configuration when only one debug profile should opt in. When using a debug browser, the aspire.closeDashboardOnDebugEnd setting controls whether it closes automatically when you stop debugging. Firefox also requires the Firefox Debugger extension.
Commands
All commands live in the Command Palette (Cmd+Shift+P / Ctrl+Shift+P) under Aspire.
| Command |
Description |
| New Aspire project |
Create a new apphost or starter app from a template |
| Initialize Aspire in an existing codebase |
Add Aspire to an existing project |
| Add an integration |
Add a hosting integration (Aspire.Hosting.*) |
| Update integrations |
Update hosting integrations and the Aspire SDK |
| Publish deployment artifacts |
Generate deployment manifests |
| Deploy app |
Deploy to your defined targets |
| Execute pipeline step |
Run a pipeline step and its dependencies (aspire do) |
| Configure launch.json file |
Add the Aspire debug config to your workspace |
| Extension settings |
Open Aspire settings |
| Open local Aspire settings |
Open the local Aspire settings file for this workspace |
| Open global Aspire settings |
Open the global Aspire settings file |
| Open Aspire terminal |
Open a terminal with the Aspire CLI ready |
| Install Aspire CLI (stable) |
Install the latest stable CLI |
| Install Aspire CLI (daily) |
Install the daily preview build |
| Update Aspire CLI |
Update the CLI |
| Verify Aspire CLI installation |
Check that the CLI works |
Language and Debugger Support
The extension figures out what language each resource uses and attaches the right debugger. Some languages need a companion extension:
| Language |
Debugger |
Extension needed |
| C# / .NET |
coreclr |
C# Dev Kit or C# |
| Python |
debugpy |
Python |
| Node.js |
js-debug (built-in) |
None |
| Browser apps |
js-debug (built-in) |
None |
| Azure Functions |
varies by language |
Azure Functions + language extension |
Node.js and browser debugging just work — VS Code has a built-in JavaScript debugger. C# Dev Kit gives you richer build integration than the standalone C# extension, but either one works for debugging. Azure Functions debugging supports C#, JavaScript/TypeScript, and Python.
Extension Settings
You can configure the extension under Settings → Aspire, or jump there with Aspire: Extension settings. The most commonly used:
| Setting |
Default |
Description |
aspire.aspireCliExecutablePath |
"" |
Path to the Aspire CLI. Leave empty to use aspire from PATH. |
aspire.dashboardBrowser |
none |
Controls what happens with the dashboard when debugging starts: none, notification, openExternalBrowser, integratedBrowser, debugChrome, debugEdge, or debugFirefox |
aspire.enableAspireDashboardAutoLaunch |
off |
Legacy dashboard launch setting. Use aspire.dashboardBrowser instead. Explicit aspire.dashboardBrowser none or notification values win. Otherwise, legacy notification or off overrides browser-opening choices; launch uses aspire.dashboardBrowser when set, otherwise opens VS Code's integrated browser to preserve pre-opt-in behavior. |
aspire.registerMcpServerInWorkspace |
false |
Register the Aspire MCP server (see below) |
There are more settings for things like verbose logging, startup prompts, and polling intervals — run Aspire: Extension settings from the Command Palette to see them all.
The extension also gives you IntelliSense and validation when editing Aspire configuration files, including the new aspire.config.json format as well as the legacy .aspire/settings.json (workspace-level) and ~/.aspire/globalsettings.json (user-level) files. Use the Open local/global Aspire settings commands to open them.
MCP Server Integration
The extension can register an Aspire MCP server with VS Code. This lets AI tools — GitHub Copilot included — see your running app's resources, endpoints, and configuration, so they have better context when helping you write code or answer questions.
Turn it on by setting aspire.registerMcpServerInWorkspace to true. When enabled, the extension registers the MCP server definition via the Aspire CLI whenever a workspace is open and the CLI is available.
Feedback and Issues
Found a bug or have an idea? File it on the microsoft/aspire repo:
Contributing
See CONTRIBUTING.md for setup, project layout, the extension-only inner loop, and running tests. Good first issues are tagged area-vscode-extension + good first issue.
Learn more
License
See LICENSE.TXT for details.
