MCU-Debug: The Next-Generation Embedded Debugger for VS Code
mcu-debug — Cortex-Debug, rethought for modern embedded by the same author
If you’ve been using Cortex-Debug, this will feel familiar — but it’s not just an update. mcu-debug is a ground-up rebuild to support how embedded development actually works today. MCU-Debug bridges the gap between your local hardware probes and your modern development environments.
👉 View a 3-Minute Interactive Intro & Architecture Deck
👉 Full documentation for MCU Debug Family
What’s different?
Truly vendor-neutral Built to be use whatever MCU (not just ARM), probe, GDB server, or silicon you want. GDB Server is the only requirement
Works where others break Native support for WSL, containers, and remote setups—no more fragile hacks just to get a debugger running.
The only VSCode debugger that makes WSL, containers, and local debugging behave the same One config. works everywhere your code and hardware live. All it takes is "hostconfig": true in your launch.json and specify where your gdb-server (OpenOCD, etc.) lives if not in your $PATH. The gdb-server is the boundary, everything else is handled.
Your launch.json is now scriptable Run the same debug configuration in VS Code or the command line. Automate it. Put it in CI. Reproduce it anywhere.
Finally automation-friendly Enables hardware-in-the-loop testing, regression runs, and repeatable debug sessions—things that were painful or impractical before.
Built with AI in mind A consistent, machine-readable debug surface that lets tools (and AI) actually understand and assist with your sessions.
Why switch?
Cortex-Debug isn’t going anywhere—it’s stable and proven. But it is feature frozen and if you’ve ever hit limits with:
- Remote development
- Lack of automation, AI, CLI, CI friendly
then this is the upgrade path. mcu-debug isn’t just easier—it unlocks workflows that weren’t really possible before.
For full installation guides, advanced configurations, and architecture details, visit the official documentation at mcu-debug.github.io/mcu-debug/.
MCU-Debug: Next generation Cortex-Debug
If you are currently using cortex-debug, you're already ready to use MCU-Debug. It maintains full backward compatibility with all your existing launch.json configurations under the "cortex-debug" type, while introducing game-changing features for modern development. Integration with AI agents and remote development was the special focus
- Standard Embedded Debug Features: All the common features you would expect for of an embedded C/C++ development environment. With support for Rust data structures as well.
- Remote Development: First class support for
remote development with WSL2, Docker, and ssh. Suppoert for Apple Container coming
- Zero-Friction Remote Debugging: Develop inside WSL2, Dev Containers, or remote SSH servers while keeping your debug probe physically connected to your local machine.
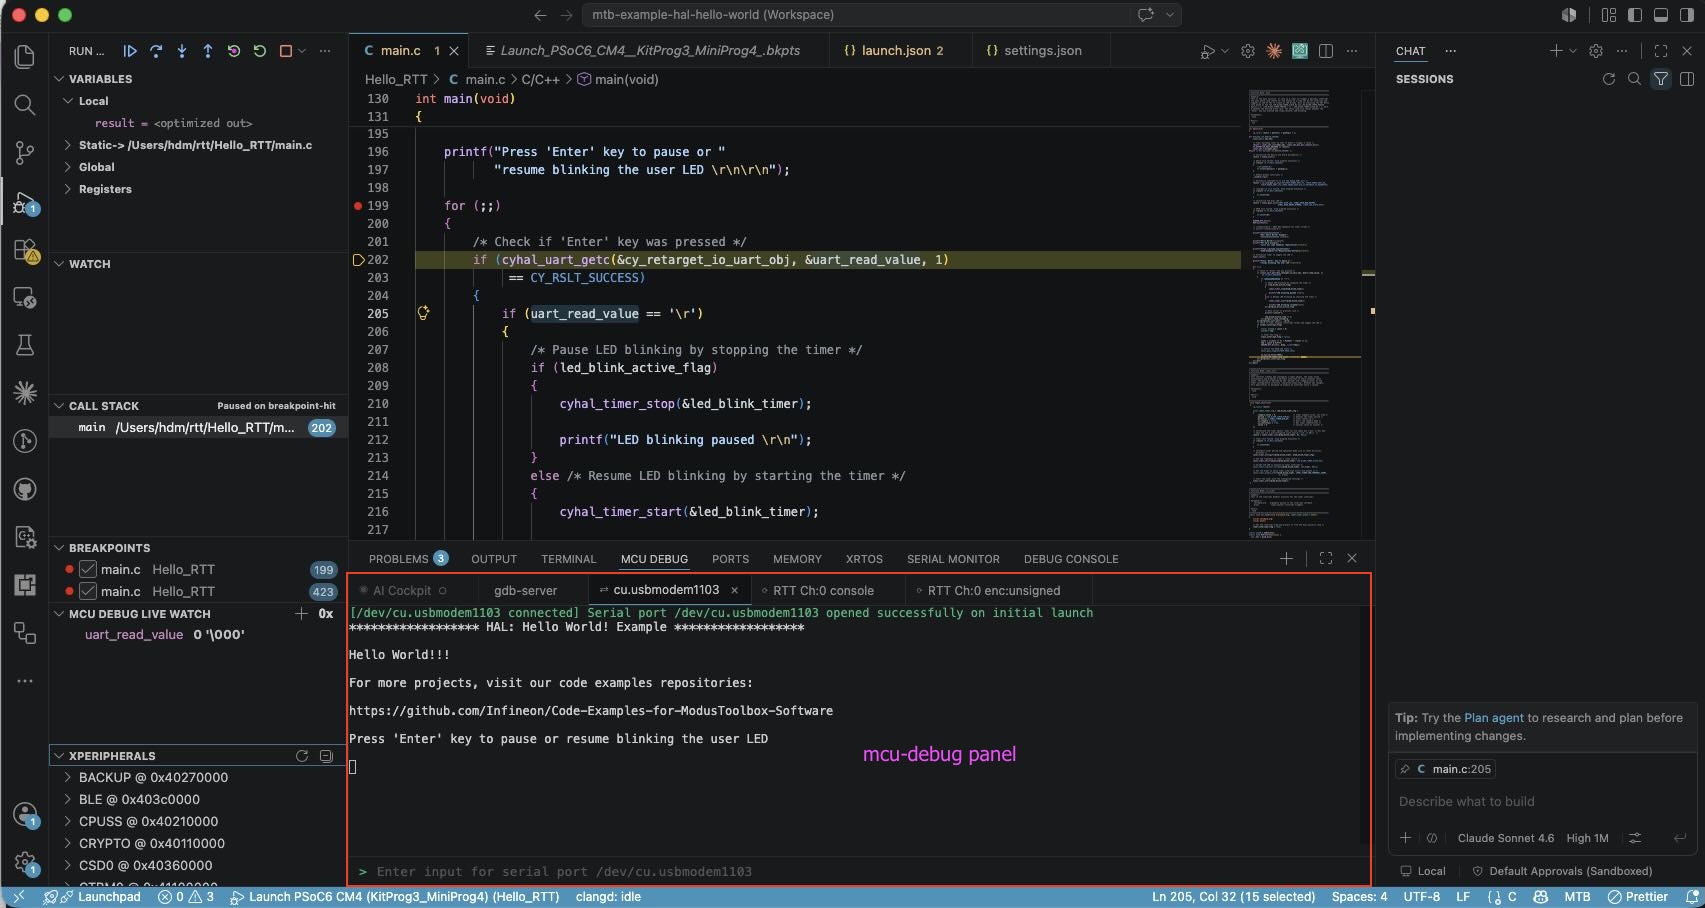
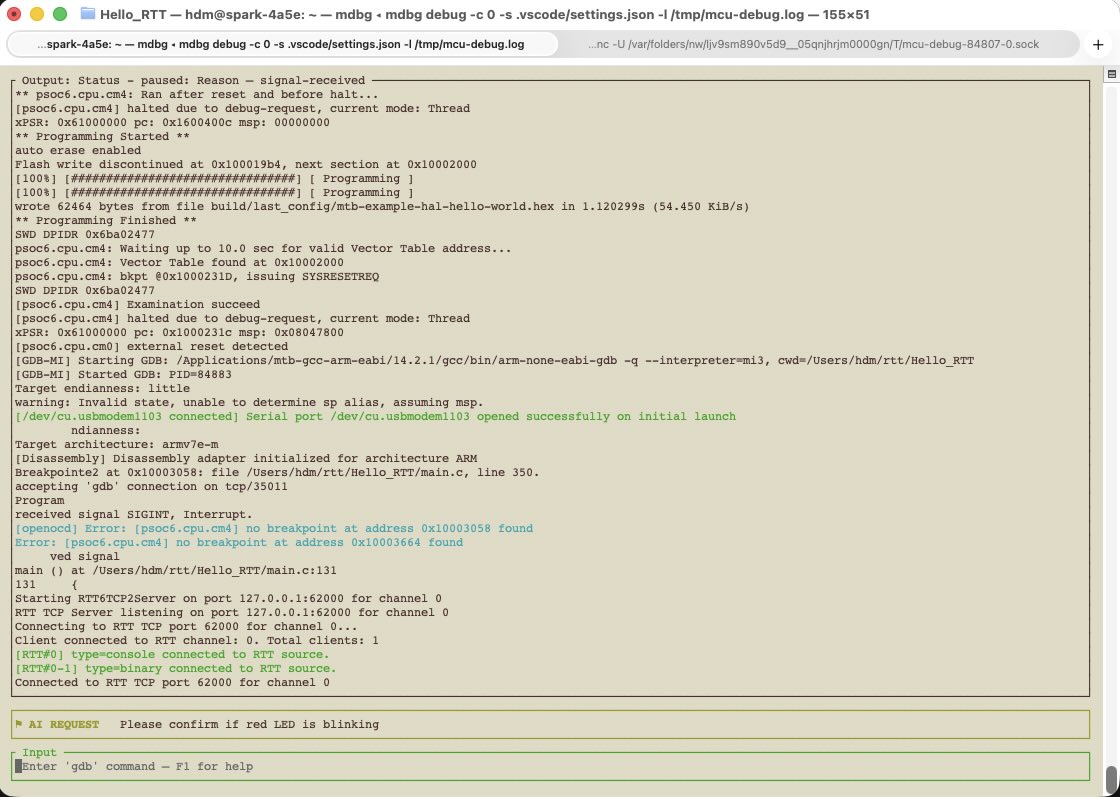
- Standalone CLI & TUI Mode: Mux your debug console, serial port, and RTT logs into a single Rust-powered terminal dashboard (
mcu-debug debug), or run headless for CI/CD and AI agent integrations. See CLI Exampe
- MCU-Debug in VSCode Panel CLI mode:: Launch CLI debug session inside VSCode
- Workspace-Scoped UARTs: Keep serial ports open during board resets and IDE restarts, capturing early boot logs in a local ring buffer.
- Dual-Mode RTT: Bypasses sluggish server-level TCP polling with target memory direct reads at up to 40 Hz.
- Real-time Telemetry: Subscribe to named variables and get streaming updates pushed directly to the UI, enabling live telemetry without manual polling loops.
- Beautiful UI: A modern, VS Code integrated UI with RTT, SWO, and serial (UART) log visualization.
- Performace: Much faster startup times, thanks to Rust doing the heavy lifting
- Rust Friendly: Support for
defmt-print RTT and understanding Rust data structures in the debugger
Key Features
1. Transparent Remote Probe Support (Funnel Protocol)
In modern development, your compiler and workspace often live inside WSL, a Dev Container, or a remote lab server, while your hardware probe is plugged into your laptop.
MCU-Debug solves this with a lightweight Probe Agent (mdbg) running locally that multiplexes GDB RSP, RTT, SWO, and serial ports over a single, secure SSH or local TCP tunnel. No complex usbipd setup or firewall configuration needed.
2. Standalone CLI & Terminal UI (TUI)
Step out of the IDE entirely. With the mcu-debug command-line interface:
- Launch debug sessions from your terminal with a rich
ratatui-based TUI, using your existing launch.json configurations.
- Use your existing
launch.json to launch CLI tools
- Attach to ongoing debug sessions from external scripts via a socket
- Run in headless mode to expose clean, tagged multiplexed streams to CI/CD pipelines or AI assistants.
- Autonomous Debugging: AI agents can use the CLI to debug MCU targets using familiar gdb commands and monitoring serial/RTT channels. With or without a human in the loop to deal with the physical world
- Use the CLI in a terminal or inside a VS Code panel
- Following is a TUI example - non TUI (Terminal UI) and VSCOde panels have similar views
3. Advanced RTT & SWO Support
- Standard Mode: Connects to standard TCP ports exposed by your GDB server.
- Direct Memory Mode: Reads the RTT control block directly from MCU target memory via GDB at high speed. Supports up to 16 bidirectional channels and custom pre-decoders (e.g.
defmt-print for Rust developers).
4. Continuous UART / Serial Port Management
No more missing early boot diagnostic prints:
- UART logs are workspace-scoped and survive debug session resets.
- A built-in ring buffer captures firmware output before your console tab is even opened.
- Tunnel remote serial ports from your lab server to your local machine using the Funnel Protocol.
5. Live Watch & ~~Real-time Graphing~~
Subscribe to named variables and get streaming updates pushed directly to the UI, enabling live telemetry and graphing without manual polling loops. (Real-time graphing is coming soon).
6. Multi-core Debug Support
Support for debugging multiple cores on the same target. It can also support debugging multiple targets at the same time. You can control the startup sequence and decide how cores are started in an event based manner. They are done using a chaining launch/attach configurations in a tree like fashion.
Companion Extensions (DAP-Compatible)
To keep the core debugger lightweight and modular, we have factored out several key visualization components into standalone companion extensions. Because they leverage standard Debug Adapter Protocol (DAP) memory and variable APIs, they are fully decoupled and can be used with any DAP-compatible debugger (such as cppdbg or cspy), as well as with MCU-Debug:
- Peripheral Viewer: An interactive SVD (System View Description) viewer to inspect microcontroller peripheral registers during a debug session.
- RTOS Views: A popular, community-driven real-time monitor for RTOS tasks, queues, semaphores, and kernel states. Backed by a active contributor base (including ARM), this extension features a framework supporting a wide variety of RTOSes.
- MemoryView: A high-performance memory inspector for raw hex dumps and direct memory reads/writes.
Supported GDB Servers & Targets
MCU-Debug is vendor-agnostic and includes built-in configurations for:
- Segger J-Link
- OpenOCD
- probe-rs Experimental
- pyOCD
- ST-Link & ST-Util
- PE Micro
- Black Magic Probe (BMP)
- QEMU (Emulation)
- External/Custom GDB Servers
Getting Started
1. Installation
Install MCU-Debug from the VS Code Marketplace or Open VSX.
Use your existing cortex-debug configurations. For example:
{
  "version": "0.2.0",
  "configurations": [
    {
      "name": "Debug STM32 (MCU-Debug)",
      "type": "mcu-debug", // Or "cortex-debug" for drop-in compatibility
      "request": "launch",
      "servertype": "openocd",
      "executable": "./build/firmware.elf",
      "device": "STM32F103C8",
      "serialConfig": {   // New in "mcu-debug", ignored by "cortex-debug"
        "enabled": true,
        "ports": [
            {
                "match": "stlink",    // Match a serial port with 'stlink' in the description
                "baud_rate": 115200
            }
        ]
      },
      "configFiles": [
        "interface/stlink.cfg",
        "target/stm32f1x.cfg"
      ]
    }
  ]
}
3. Remote/WSL/Docker Setup (Optional)
To use remote debugging, simply define a hostConfig inside your launch configuration:
"hostConfig": true // Automatically resolves WSL or Dev Container namespaces
THe above is equivalent to the following
"hostConfig": {
  "enabled" true,
  "type": "auto" // Automatically resolves WSL or Dev Container namespaces
}
Contributing & Support
Developed and maintained by Haneef Mohammed. Licensed under MIT and Apache-2.0.

