Markdown Preview Infographic Support


Adds AntV Infographic diagram and visualization support to VS Code's builtin Markdown preview.
Currently supports AntV Infographic version 0.1.0.
Usage
In Markdown Preview
Create infographic diagrams in markdown using infographic fenced code blocks:
```infographic
infographic list-row-simple-horizontal-arrow
data
  items
    - label Step 1
      desc Initialize
    - label Step 2
      desc Process
    - label Step 3
      desc Complete
```
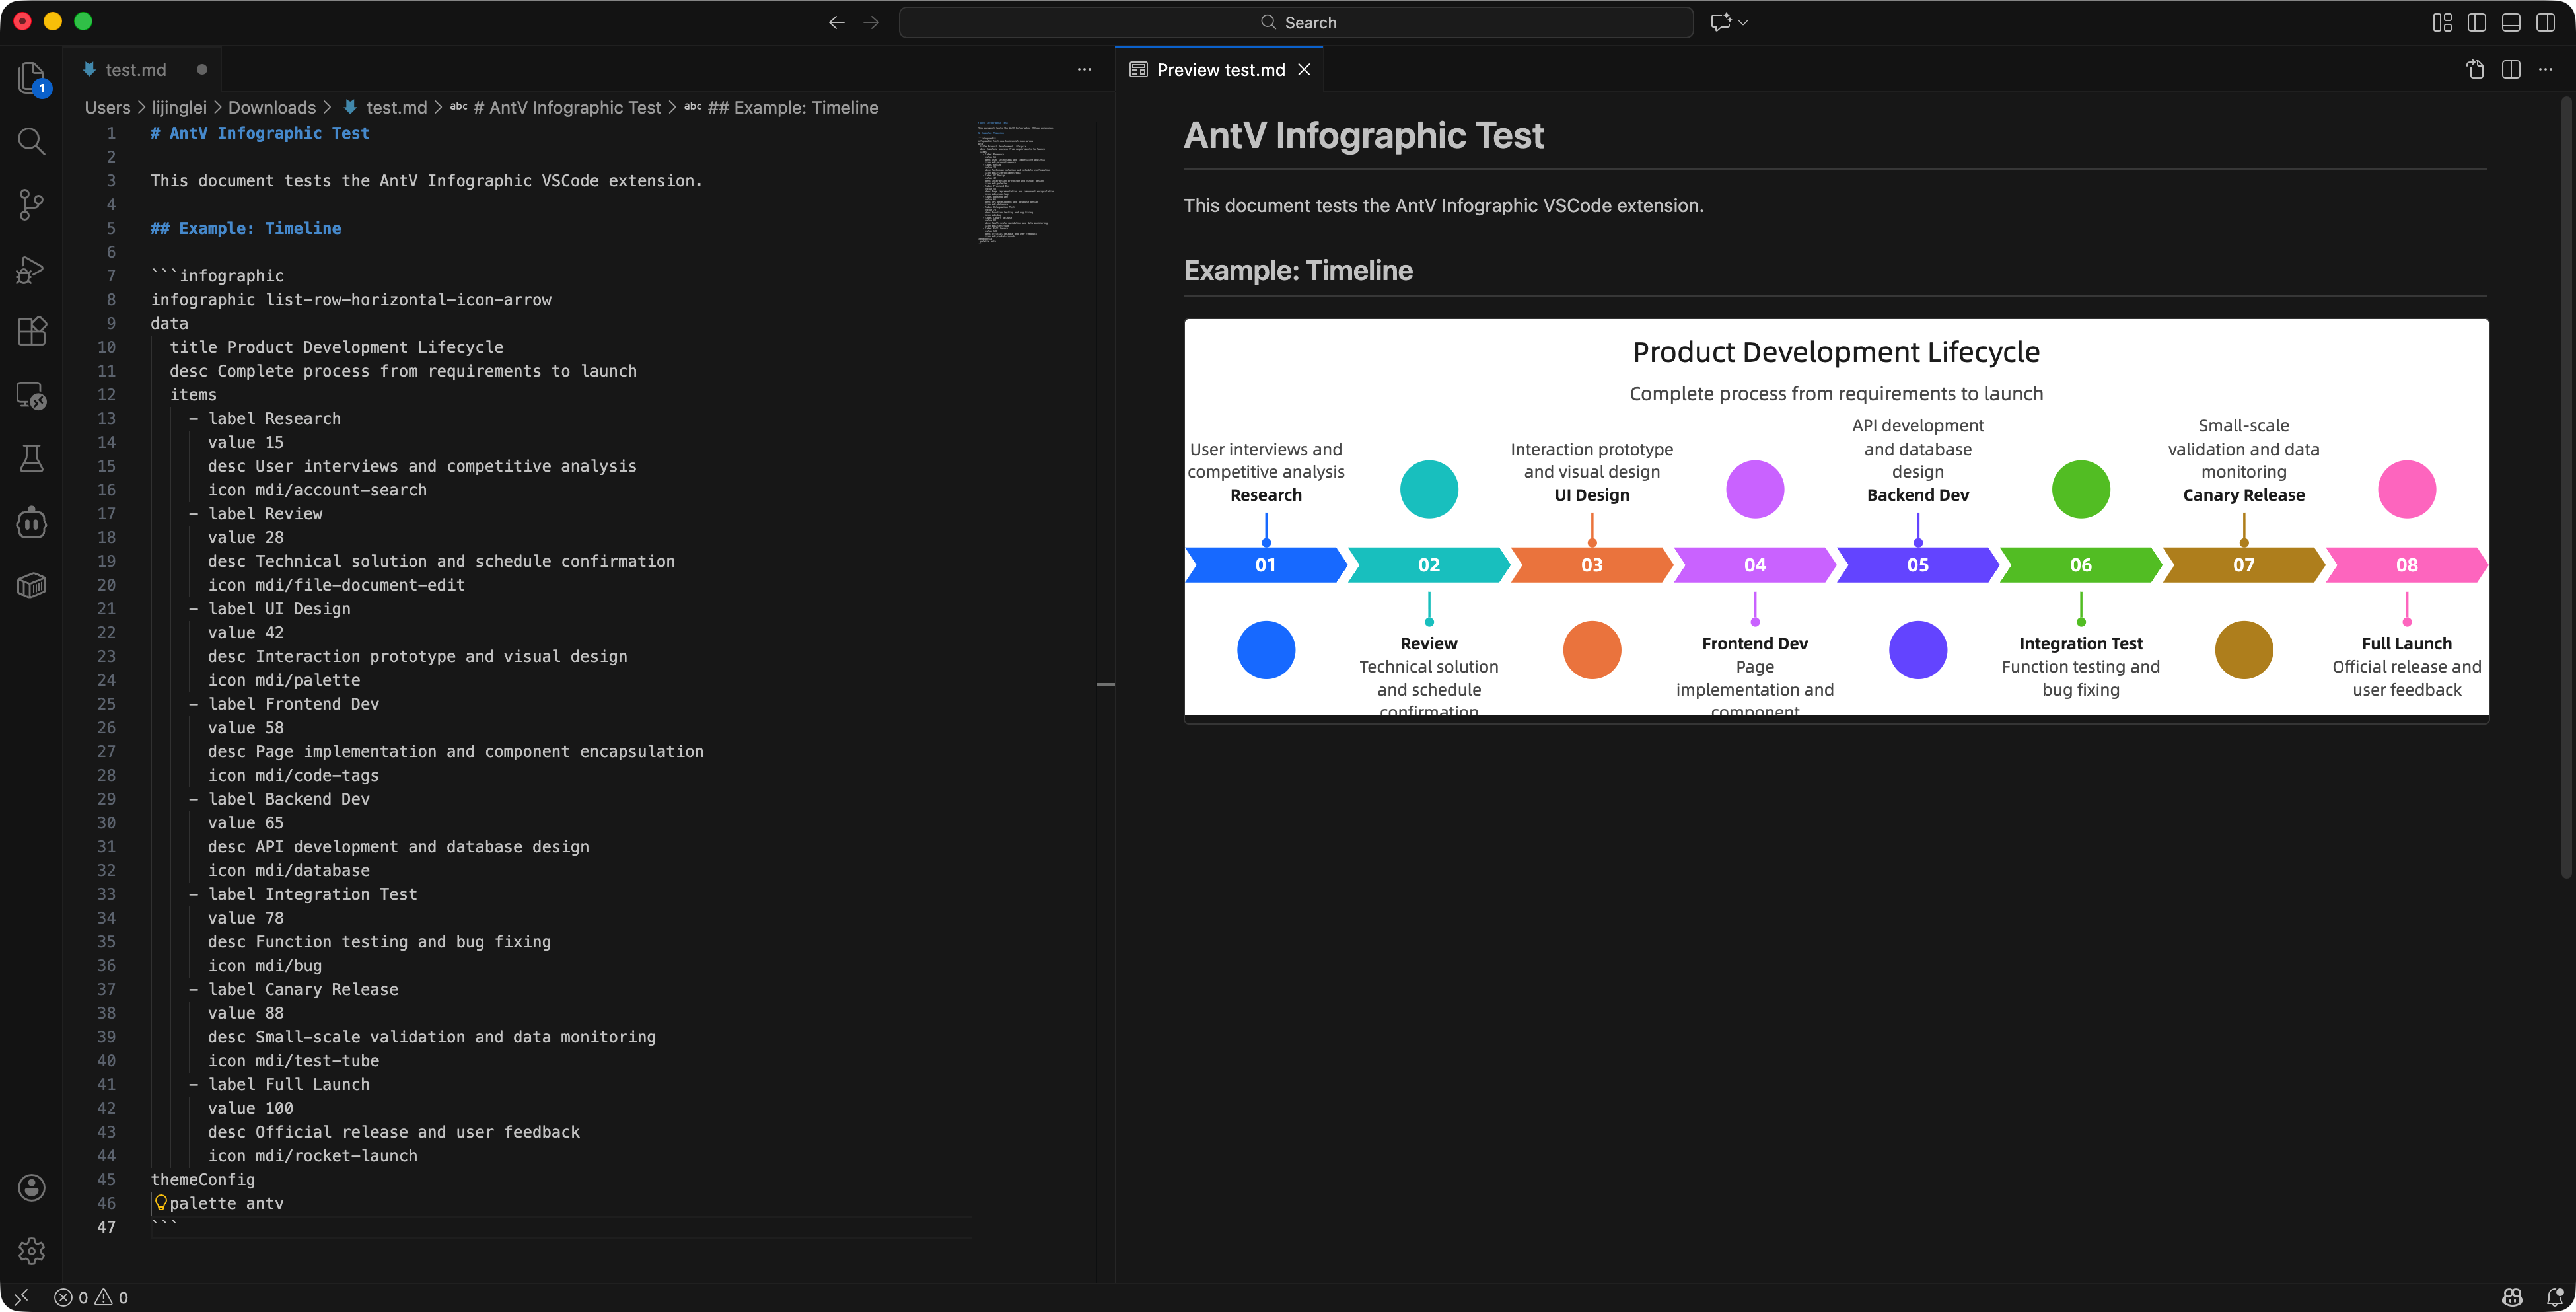
You can create various types of infographics with icons and values:
```infographic
infographic list-row-horizontal-icon-arrow
data
  title Customer Growth Engine
  desc Multi-channel customer acquisition
  items
    - label Lead Generation
      value 18.6
      desc Content marketing and outreach
      icon company-021_v1_lineal
    - label Conversion
      value 12.4
      desc Lead scoring and automation
      icon antenna-bars-5_v1_lineal
    - label Retention
      value 32.1
      desc Customer success programs
      icon activities-037_v1_lineal
```
For complete syntax documentation, see the AntV Infographic Syntax Guide.
Standalone .infographic Files
You can now create standalone .infographic files! These files will open in a custom editor with a live preview panel:
- Create a new file with
.infographic extension
- Write your infographic syntax directly (without code fences)
- The editor will show a split view with text on the left and live preview on the right
- Changes update automatically as you type
Interactive Code Block Editor
Edit infographic code blocks in a dedicated editor:
- Open a markdown file containing
infographic code blocks
- Click the Edit icon (📝) in the gutter next to any infographic code block
- An interactive editor opens with:
- Text editor on the left for editing syntax
- Live preview on the right showing the rendered infographic
- Apply/Revert buttons to save or discard changes
- Click Apply to save changes back to your markdown file
Configuration
infographicMarkdown.width — Width of the rendered infographic. Supports absolute values (e.g., "500") or percentages (e.g., "100%"). The default is "100%".
infographicMarkdown.height — Height of the rendered infographic. Supports absolute values (e.g., "400") or percentages (e.g., "100%"). The default is "100%".
infographicMarkdown.padding — Padding inside the infographic container. Can be a single number for uniform padding or an array of 4 numbers [top, right, bottom, left]. The default is 0.
Using custom CSS in the Markdown Preview
You can use the built-in functionality to add custom CSS. More info can be found in the markdown.styles documentation
For example, add custom styling like this:
"markdown.styles": [
    "path/to/your/custom.css"
]
