Live Eval — Inline JavaScript & TypeScriptSee JavaScript & TypeScript values inline as you type — a free, no-terminal way to eval, debug, inspect objects, trace recursion, benchmark, and visualize the Event Loop & Promises right inside VS Code. Add // ? to any line. Installation Launch VS Code Quick Open ( Ctrl+P), paste the following command, and press enter.Copied to clipboard |

Live Eval — Inline JavaScript & TypeScript
See JavaScript & TypeScript values inline as you type. Live Eval evaluates your code as you write it and shows the result of any expression right next to it — no terminal, no run button, no REPL, no context switching. It's a free, no-friction way to eval, debug, and inspect JS/TS, with built-in recursion and Event Loop & Promise visualizers you won't find elsewhere. Why Live Eval?
Quick ExampleWorks with .js and .ts files. ScreenshotsLive Eval shows results inline as you type — no run button, no separate console.
Get Started in 30 Seconds
TutorialsStep-by-step guides with screenshots — every output in them was produced by running the snippet through Live Eval's real evaluation pipeline.
Browse them all in the tutorial index. Marker ReferenceMarkers are plain comments. They don't change how your code runs — they just tell Live Eval what to show.
What You Can DoVisualize recursionAdd The interactive visualizer shows every call, argument, return value, depth, and timing. Switch between a call tree, a DAG (collapsed duplicate subtrees), a timeline (calls plotted by entry time), or a minimap overview. Step through calls one at a time, animate playback, and see a memoization estimate showing how many redundant calls could be eliminated. Visualize the Event Loop & PromisesOpen LiveEval: Visualize Promises from the Command Palette while a file with
Step forward/back through events or press Play to animate at adjustable speed. Switch between the Event Loop view (live call stack / queues / Promise states) and the Timeline view (the whole run as a phase-grouped story with real millisecond offsets). Visualize prototype chainsRun LiveEval: Visualize Prototype Chain (or add See execution coverage in the gutterEvery evaluation tracks which lines actually ran. Executed lines get a subtle gutter mark with an execution-count badge; lines that never ran are highlighted so dead code jumps out. Choose how loud this is with
Branch badges ( Work across multiple filesImport your own
Keep results steady while you typeTurn on Toggle visualizer panels individuallyEvery panel in the recursion visualizer (execution tree, timeline, call stack, backtrack animation, results pane) and the editor branch badges can be switched off independently via the Evaluate any expression instantly
Full TypeScript supportTypes, interfaces, and generics are stripped at evaluation time. Results are remapped back to the original TypeScript line numbers via source maps, so decorations always land on the right line even when the compiler removes type-only declarations. See loop values as sparklinesWhen a marked line runs multiple times, all values are shown in sequence with a sparkline: Use
|

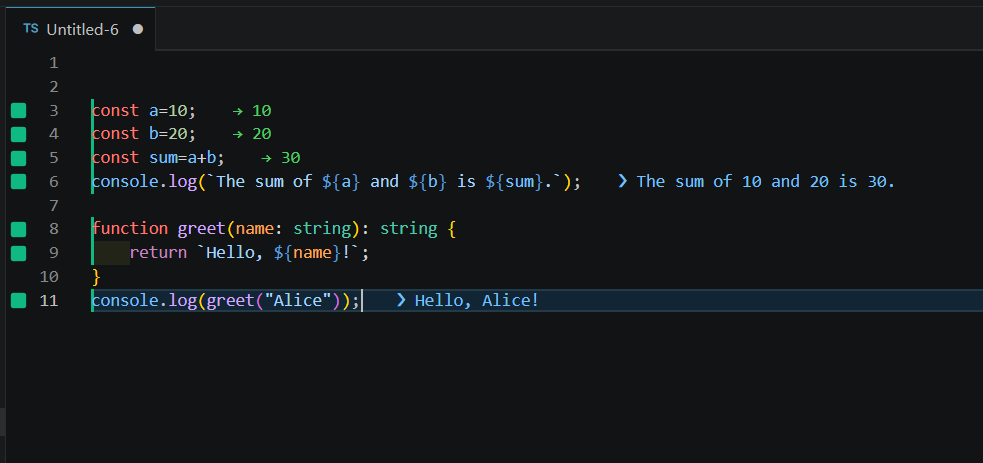 Inline results for
 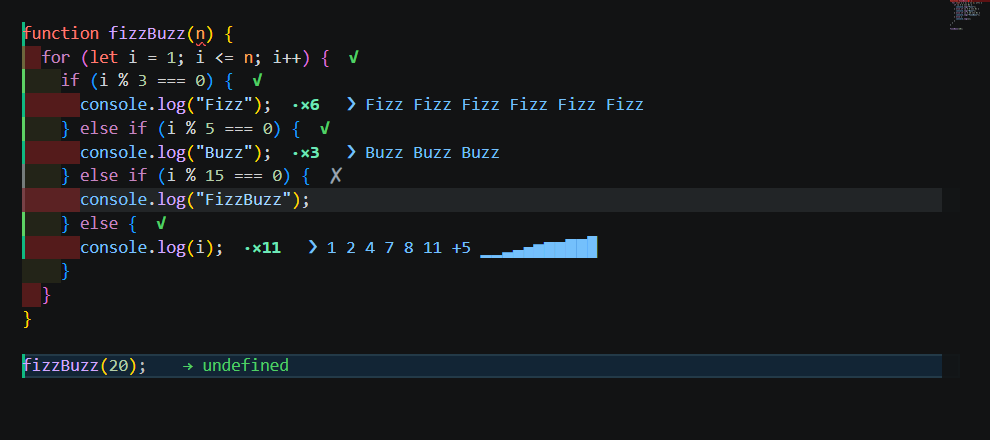 Step-by-step visualization of the call stack, microtask queue, and Promise states
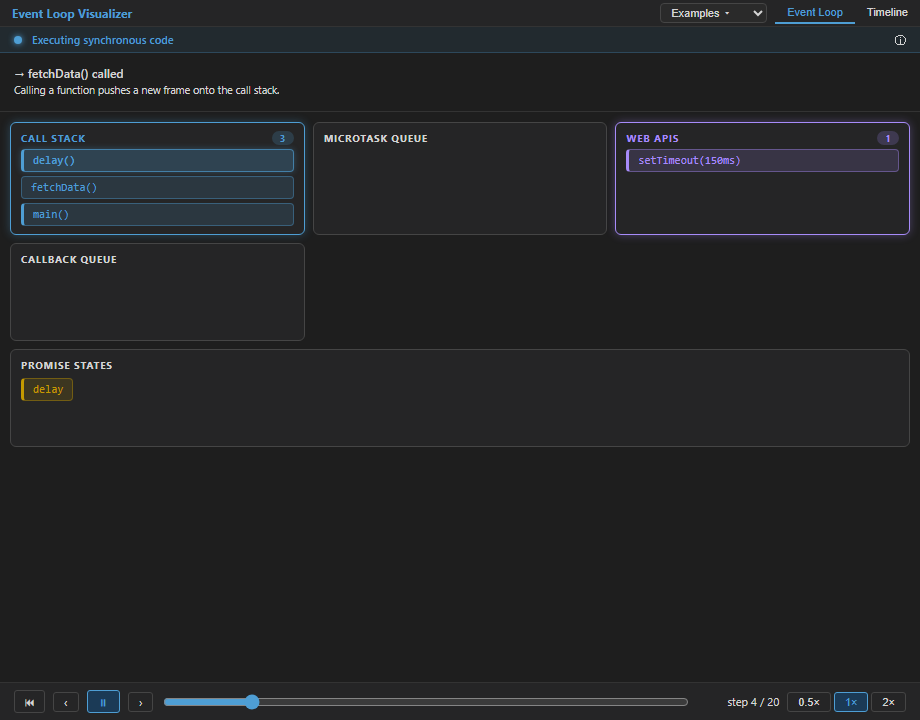 Event Loop view: watch
 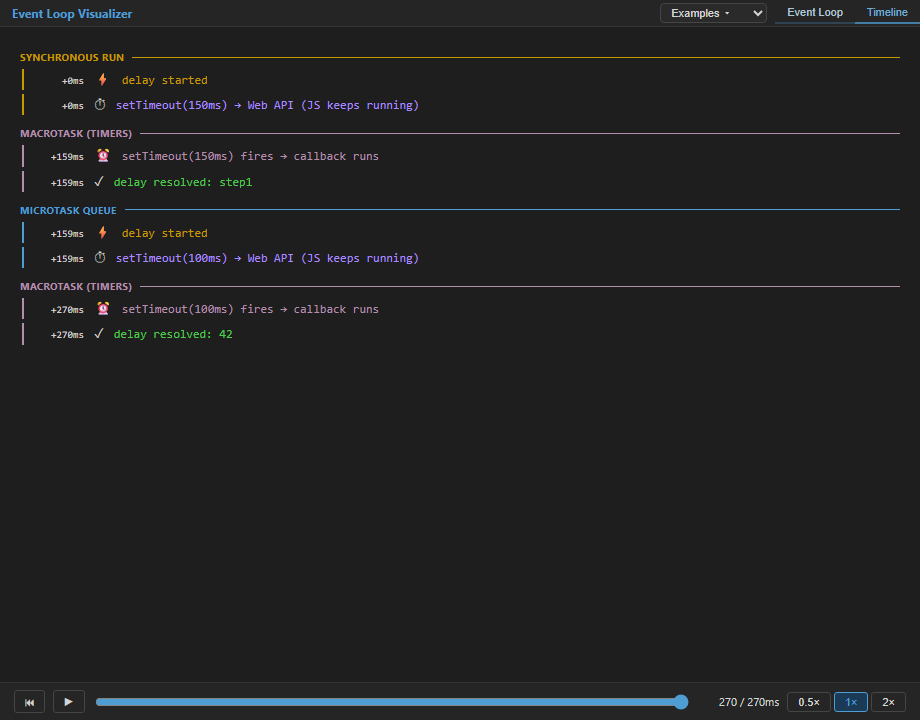 Timeline view: the same run told as a story — synchronous run, macrotasks, and microtask queue, each event stamped with its real
 | Limit | Default |
|---|---|
| Evaluation timeout | 5 000 ms |
fetch() timeout |
auto (timeout − 500 ms) |
| Recursion depth | 1 000 calls |
| Trace records per function | 50 |
| Trace events per visualizer run | 2 000 |
| Watch history per variable | 10 values |
Commands
Open the Command Palette (Ctrl+Shift+P / Cmd+Shift+P):
| Command | Shortcut | Description |
|---|---|---|
| LiveEval: Run — Evaluate Current File | Ctrl+Shift+Enter |
Evaluate immediately |
| LiveEval: Toggle Live Auto-Evaluation On/Off | Ctrl+Shift+L |
Enable/disable live mode |
| LiveEval: Clear Inline Results | — | Remove all inline decorations |
| LiveEval: Visualize Recursion Tree | — | Open the call tree for the last // trace run |
| LiveEval: Visualize Promises | — | Open the Event-loop & Promise Visualizer |
| LiveEval: Visualize Prototype Chain | — | Open the prototype-chain panel for an inspected object |
| LiveEval: Show Console Output Panel | — | Open the captured console output panel |
| LiveEval: Show Results Panel | — | Open the results tree view |
| LiveEval: Show Output Panel | — | Open the extension log panel |
| LiveEval: New JavaScript Scratchpad | — | New JS file pre-loaded with marker examples |
| LiveEval: New TypeScript Scratchpad | — | New TS file pre-loaded with typed examples |
| LiveEval: Add // ? Marker to Selected Lines | — | Insert a value marker on each selected line |
| LiveEval: Export Results to Clipboard | — | Copy all current inline results as text |
| LiveEval: Copy Line Value to Clipboard | — | Copy the evaluated value on the current line |
| LiveEval: Show Extension Status | — | Display version and feature status |
Configuration
Settings are under liveeval.* in VS Code Settings (Ctrl+,). Changes apply live — no window reload needed.
Execution
| Setting | Default | Description |
|---|---|---|
liveeval.execution.timeout |
5000 |
Max evaluation time (ms) before a slow run is stopped |
liveeval.execution.fetchTimeout |
0 |
Time limit (ms) for fetch() calls; 0 = auto (execution timeout − 500 ms, clamped 2–30 s) |
liveeval.execution.maxCallDepth |
1000 |
Recursion guard — max call-stack depth before execution stops |
liveeval.execution.allowedModules |
[] |
Modules evaluated code may load — npm packages or powerful builtins (fs, child_process, …). Safe builtins are always available. Listing a module is explicit consent. |
liveeval.execution.debug |
false |
Print internal diagnostic logs to the output panel |
Behavior
| Setting | Default | Description |
|---|---|---|
liveeval.behavior.evaluationDelay |
300 |
Debounce after typing before re-evaluating (ms). With adaptive delay on, this is the maximum wait |
liveeval.behavior.adaptiveDelay |
true |
Scale the debounce down to what the file actually costs to evaluate. Turn off to always wait the configured delay exactly |
liveeval.behavior.evaluateWithoutMarkers |
false |
Show results for every line automatically — no markers needed (Quokka-style) |
liveeval.behavior.stickyResults |
false |
Keep the last successful results visible while mid-edit; replace only on the next successful run |
Markers & history
| Setting | Default | Description |
|---|---|---|
liveeval.execution.traceMaxCalls |
50 |
Max call records per // trace |
liveeval.execution.traceMaxEvents |
2000 |
Max trace events streamed to the recursion visualizer per run |
liveeval.execution.watchHistorySize |
10 |
Values retained per // watch across re-evaluations |
Multi-file projects
| Setting | Default | Description |
|---|---|---|
liveeval.execution.entryPoints |
[] |
Explicit entry-point files (e.g. ["src/app.ts"]) overriding automatic entry detection |
liveeval.execution.entryReevalBudgetMs |
1200 |
Time budget (ms) for re-running the whole import graph when a module is edited; 0 disables live module re-runs |
liveeval.pathAliases |
{} |
Manual path-alias map (e.g. {"@lib/*": "src/lib/*"}) supplementing auto-detected tsconfig.json paths |
Console output
| Setting | Default | Description |
|---|---|---|
liveeval.console.maxDepth |
6 |
Object nesting depth for console output inspection |
liveeval.console.filter |
{"mode":"off"} |
Log-level filter: whitelist shows only listed levels, blacklist hides them (e.g. {"mode":"blacklist","levels":["debug"]}) |
Coverage & editor decorations
| Setting | Default | Description |
|---|---|---|
liveeval.coverage.style |
"full" |
Coverage presentation: full (badges + dead-line highlight), quiet (badges only), dead-only (only highlight never-executed lines) |
liveeval.features.branchHighlight.enabled |
true |
✓/✗ taken / not-taken branch badges in the gutter |
Recursion visualizer
| Setting | Default | Description |
|---|---|---|
liveeval.visualization.maxEvents |
5000 |
Max call events recorded before the visualizer stops capturing |
liveeval.visualization.showTruncationWarning |
true |
Show a banner in the visualizer when the trace was cut off |
liveeval.visualization.showRecursionNotification |
true |
Pop up a notification when deep recursion is detected |
liveeval.features.recursionTree.enabled |
true |
Show the Execution Tree panel |
liveeval.features.timeline.enabled |
true |
Show the Execution Timeline tab |
liveeval.features.callStack.enabled |
true |
Show the Call Stack panel |
liveeval.features.backtrack.enabled |
true |
Show backtracking highlights/animation |
liveeval.features.resultsOutput.enabled |
true |
Show the Results / Console pane |
Troubleshooting
Results not appearing — check the status bar shows $(play) LiveEval. If it says LiveEval Disabled, click it or press Ctrl+Shift+L. Make sure the file is a supported language (.js or .ts) and add a // ? marker to a line.
Decorations look stale — run LiveEval: Clear Inline Results.
Slow typing — raise liveeval.behavior.evaluationDelay to 500–1000 ms.
Recursion visualizer is empty — make sure the function actually recurses, place // trace on the closing brace or definition line, and evaluate the file first.
require() not found — the sandbox scopes require to your workspace root. Open the file inside a VS Code workspace folder.
Imports fail in a multi-file project — check that the imported file is part of the workspace and that the relative file path is correct.
Feedback
Found a bug or have a suggestion? Submit feedback — include the code that triggered it, your VS Code version, and OS.
License
Copyright (c) 2026 LiveEvalJS Labs. All rights reserved.
This software is proprietary and confidential. The source code is not open source. You may install and use the extension binary distributed via the VS Code Marketplace for personal or internal business purposes only.
You may not copy, modify, distribute, sublicense, reverse-engineer, or create derivative works from this software without the prior explicit written permission of LiveEvalJS Labs.
See the LICENSE file for the full terms.
Terms & Conditions
By installing or using Live Eval you agree to the following:
1. Permitted use. You may install and use the extension on machines you own or control, solely for your own personal or internal business purposes.
2. Restrictions. You may not redistribute, resell, sublicense, reverse-engineer, decompile, or create derivative works based on this software without explicit written permission from LiveEvalJS Labs.
3. Code execution is your responsibility. Code you evaluate runs on your local machine under your own operating-system user permissions. You are solely responsible for the code you choose to evaluate, including any effects it may have on your system, files, or external services.
4. No warranty. This software is provided "as is", without warranty of any kind, express or implied — including but not limited to warranties of merchantability, fitness for a particular purpose, or non-infringement.
5. Limitation of liability. LiveEvalJS Labs shall not be liable for any direct, indirect, incidental, special, consequential, or punitive damages arising from the use or inability to use this software, even if advised of the possibility of such damages.
6. No warranty of continuity. The extension may be updated, changed, deprecated, or discontinued at any time without notice.
7. Security. While the sandbox is designed to isolate evaluated code, no sandboxing mechanism is unconditionally secure. Do not evaluate untrusted third-party code. Add modules to liveeval.execution.allowedModules only in workspaces you fully trust.
8. No responsibility for misuse. LiveEvalJS Labs accepts no liability for misuse, including unintended access to external services, leakage of sensitive data, or violations of applicable laws or third-party terms of service.