Skip to content
| Marketplace
Sign in
Visual Studio Code>Testing>Playwright LogbookNew to Visual Studio Code? Get it now.
Playwright Logbook

Playwright Logbook

Krishna S

|
4 installs
| (0) | Free
Browse Playwright runs, investigate failures and retries, compare test history, and import CI results.
Installation
Launch VS Code Quick Open (Ctrl+P), paste the following command, and press enter.
Copied to clipboard
More Info

Playwright Logbook logo

Playwright Logbook for VS Code

Browse Playwright runs, investigate failures and retries, and compare test history without leaving your editor. Jump from a recorded error straight to your test source.

Install Playwright Logbook for VS Code

Get started

Install Playwright Logbook by krishnapollu from the VS Code Marketplace, or use:

code --install-extension krishnapollu.playwright-logbook-vscode

Requires desktop VS Code 1.95+ and a local project folder on macOS, Windows or Linux. Remote SSH, containers and browser-based VS Code are unsupported; full screen-reader validation is ongoing.

The extension displays saved results. Install the reporter in your Playwright project to collect them (Node.js 20+, Playwright 1.42+):

npm install --save-dev playwright-logbook

Add Logbook to your existing playwright.config.ts reporter list:

import { defineConfig } from '@playwright/test';

export default defineConfig({
  reporter: [
    ['list'],
    ['playwright-logbook', { captureDetails: true }],
  ],
  use: {
    screenshot: 'only-on-failure',
    trace: 'on-first-retry',
  },
});

Run your tests, then open Logbook in VS Code's activity bar:

npx playwright test

Keep .logbook/index.jsonl and .logbook/runs/ between runs to retain history. Open the folder containing your Playwright configuration in VS Code.

Browse your runs

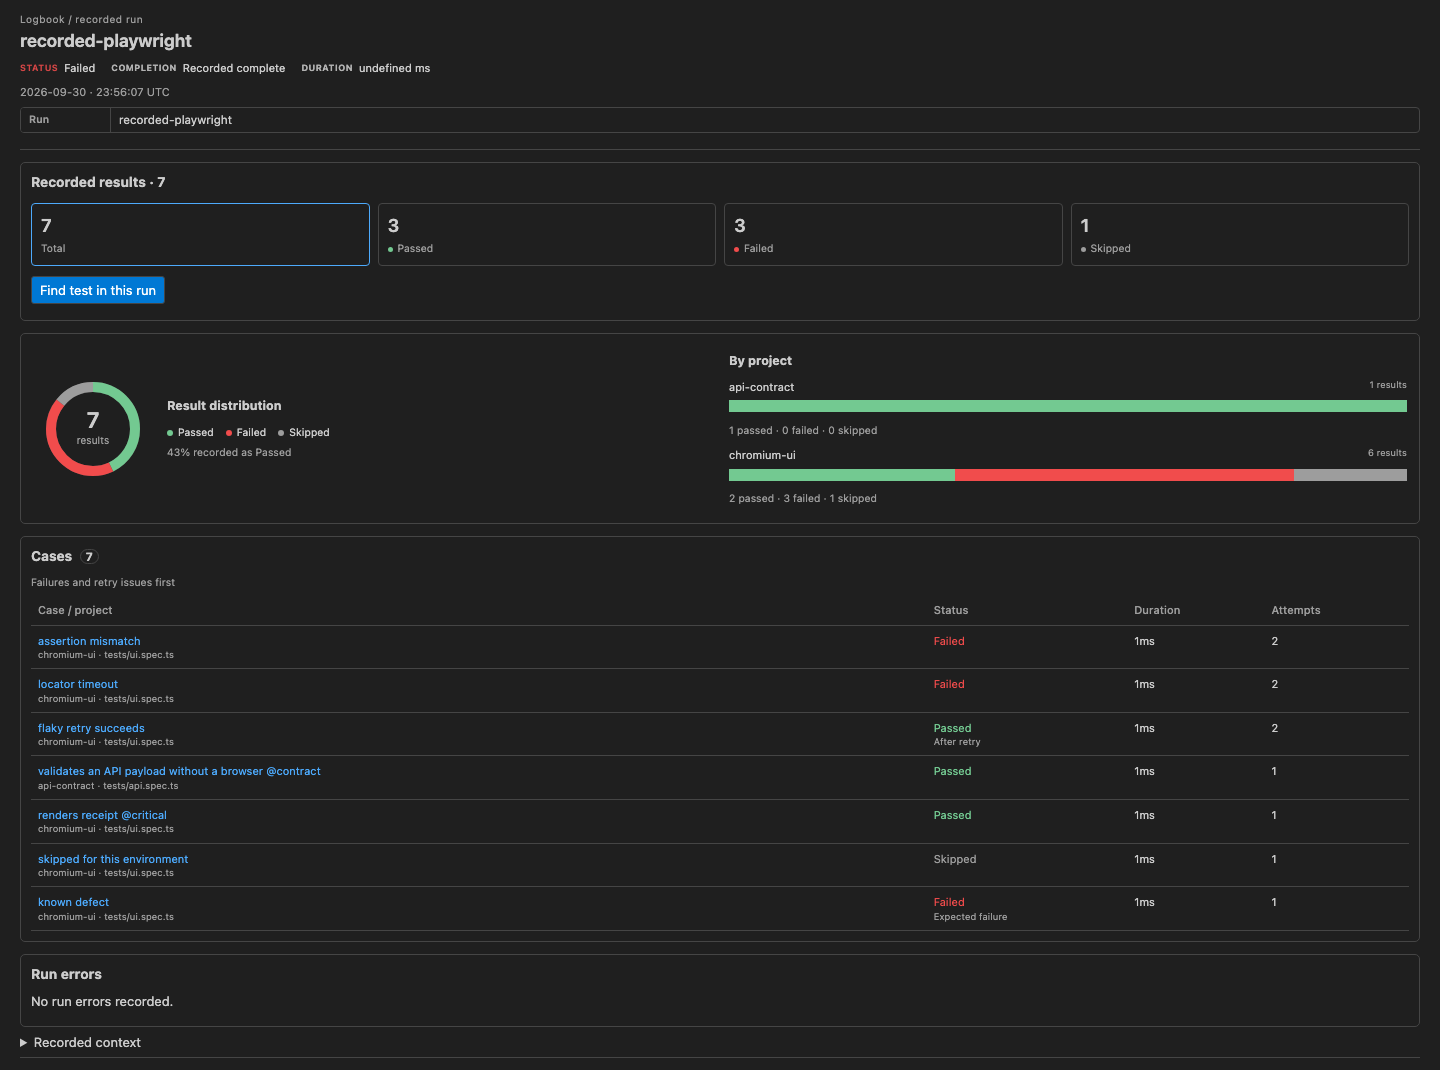
Expand a run in Recent Runs and choose Run overview. Review totals, project breakdowns and the cases list; click a test to inspect it. Use the sidebar search action to find a test in the selected run.

Run overview with result totals, project breakdowns and clickable tests

Investigate a failure

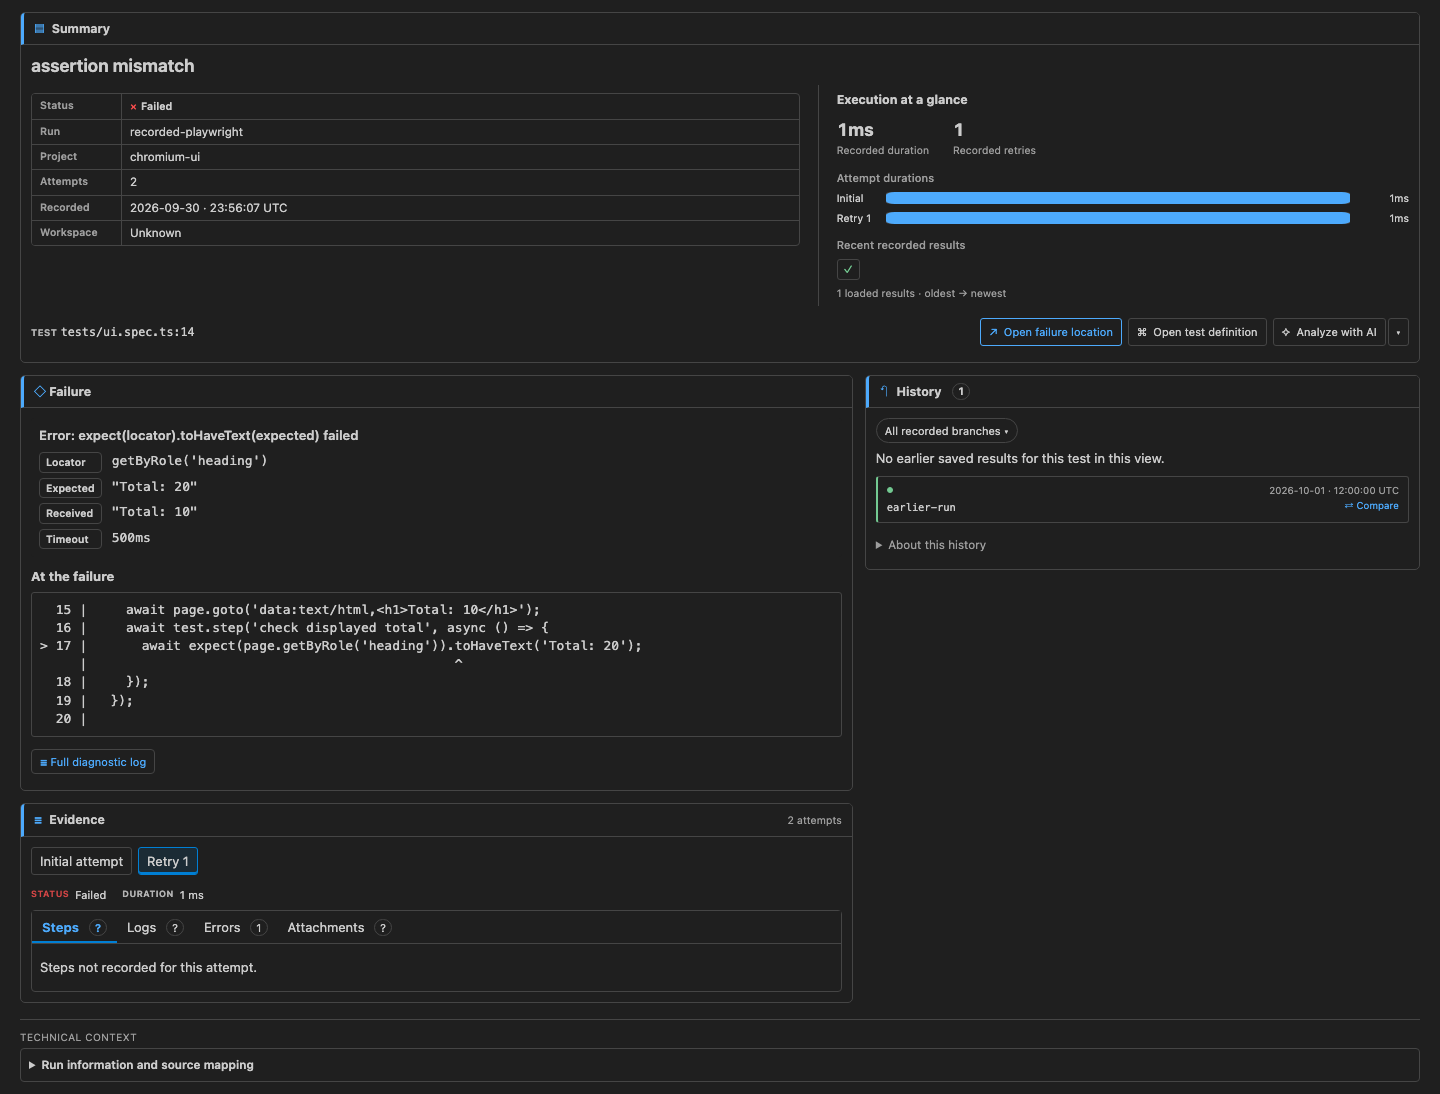
Select a test to see its error, assertion details and recorded source excerpt. Switch attempts to inspect Steps, Logs, Errors and Attachments. In History, select an earlier execution or choose Compare to review changes.

Test failure with attempt evidence and execution history

Choose Open failure location or Open test definition to navigate to your current checkout. Recorded line numbers may have moved. Commit source and diffs require Workspace Trust, local Git and locally available recorded revisions.

captureDetails: true enables steps, stdout/stderr and eligible failed/flaky-test PNG/JPEG previews. It applies to new runs. Videos, traces and other file attachments show metadata; playback and trace viewing are not available in the extension.

Screenshots show the extension's panels with sample Playwright results.

Analyze a test

The test summary places ✧ Analyze with AI ▾ beside the source actions. On first use, choose an installed coding-agent chat extension or native VS Code Chat. Logbook remembers the agent separately for each workspace folder; later clicks prepare the task and open that agent directly. The arrow changes the saved agent without starting a handoff. Removed agents trigger a new picker. Logbook: Analyze Selected Test uses the same saved choice. No analysis section, context preview or AI response appears in Logbook; a brief editor notification reports the handoff result.

Native VS Code Chat receives an unsent draft, including a declared chat participant when available. Codex, Antigravity, Amazon Q and Cline use their input-focus commands and VS Code's native paste routing to insert the full prepared task into the chat composer. Review the draft, choose the model in your agent and submit. No manual paste is required. For other installed agents, automatic insertion requires a supported input integration; unsupported inputs report an error so you can choose another agent. An installed/active label describes extension activation, not sign-in or model access. Logbook does not automatically send a request or read the agent's answer.

The terminal analyze command and extension use the same evidence builder; the extension does not launch a subprocess or ask the agent to reconstruct the task. Evidence includes the exact selected execution/project/repeat, captured output, errors, attempts, steps, attachment references and matching scoped history. A bounded excerpt from the mapped current test file is included when available; current source may differ from the recording. Artifact bodies are excluded, and safe project-relative references let the agent read accessible attachments. Known secret filtering applies to the task. Analysis requires Workspace Trust. Answers are requested in at most 200 words, with cause, supporting references and next steps; the agent writes the concise answer, without client trimming. Cancel or change execution to discard an in-progress handoff.

Available in extension 0.2.15+. The terminal analyze command requires reporter 0.3.1+; the extension includes its own task builder. Provider integration remains future work.

Framework loggers

Winston's Console transport and Pino's stdout destination were verified with reporter 0.3.0: their output appears in the corresponding attempt's Logs when output capture is enabled. This captures output attributed by Playwright to the test worker; browser-page console and separate server processes need forwarding. Capture is bounded (maxOutputLength defaults to a 2,000-character tail per channel), so long logs may be truncated.

For a file-only logger, write to a per-test path and attach the file after flushing the logger:

const logPath = testInfo.outputPath('framework.log');
// Configure your logger's file transport/destination with logPath.
// Flush and close it before attaching the file.
await testInfo.attach('Framework log', {
  path: logPath,
  contentType: 'text/plain',
});

The extension shows attachment metadata. Export with --artifacts to include the file in a portable bundle, subject to the bundle's evidence limits. This route works without a Logbook-specific logger adapter. A file shared across parallel tests cannot reliably identify which test produced each line; use separate files per test.

Bring CI results into your history

With reporter 0.3.0+, export a run as a portable ZIP using the bundle and CI guide.

  1. Choose Logbook: Import Run Bundle… from the Command Palette or the sidebar's cloud-download action.
  2. Select the exported ZIP files and enter the same stable project ID used by CI when prompted.
  3. Review the runs and evidence, then choose Import and Open Imported Run.

Imported runs join your local history. Import requires a trusted workspace; Logbook does not download CI artifacts or check out commits.

Use a custom project folder

For a nested project, add workspace settings like these:

{
  "logbook.historyPath": "e2e/.logbook",
  "logbook.sourceRoot": "e2e"
}

Or use Logbook: Select History Folder and Logbook: Configure Source Mapping. Select the folder containing index.jsonl and runs/, rather than the HTML report. History refreshes automatically; Logbook: Refresh History refreshes manually.

Need help?

Problem Try this
No runs in the sidebar Run tests with the reporter; check logbook.historyPath, then refresh.
Logs, steps or screenshots are missing Enable captureDetails and Playwright screenshots, then run again. Missing or oversized images may have no preview.
Source opens in the wrong place Check logbook.sourceRoot; your checkout may differ from the recorded run.
Earlier executions are missing Keep the history files, check branch scope and choose Load more history.

Upgrading from the old repository preview? Uninstall it before installing the Marketplace edition:

code --uninstall-extension logbook-local-preview.playwright-logbook-vscode

Results stay in your local history folder. The extension makes no telemetry or automatic AI-upload requests. Review captured logs and screenshots before sharing.

Reporter options · Report an issue · Changelog

  • Contact us
  • Jobs
  • Privacy
  • Manage cookies
  • Terms of use
  • Trademarks
  • Your Privacy Choices
  • Consumer Health Privacy
© 2026 Microsoft