See exactly what your agent did — which tools it called, what it sent and received, token counts, cost, and timing — all in an interactive timeline panel.
Free and open source. No account, no subscription, no telemetry.
Features
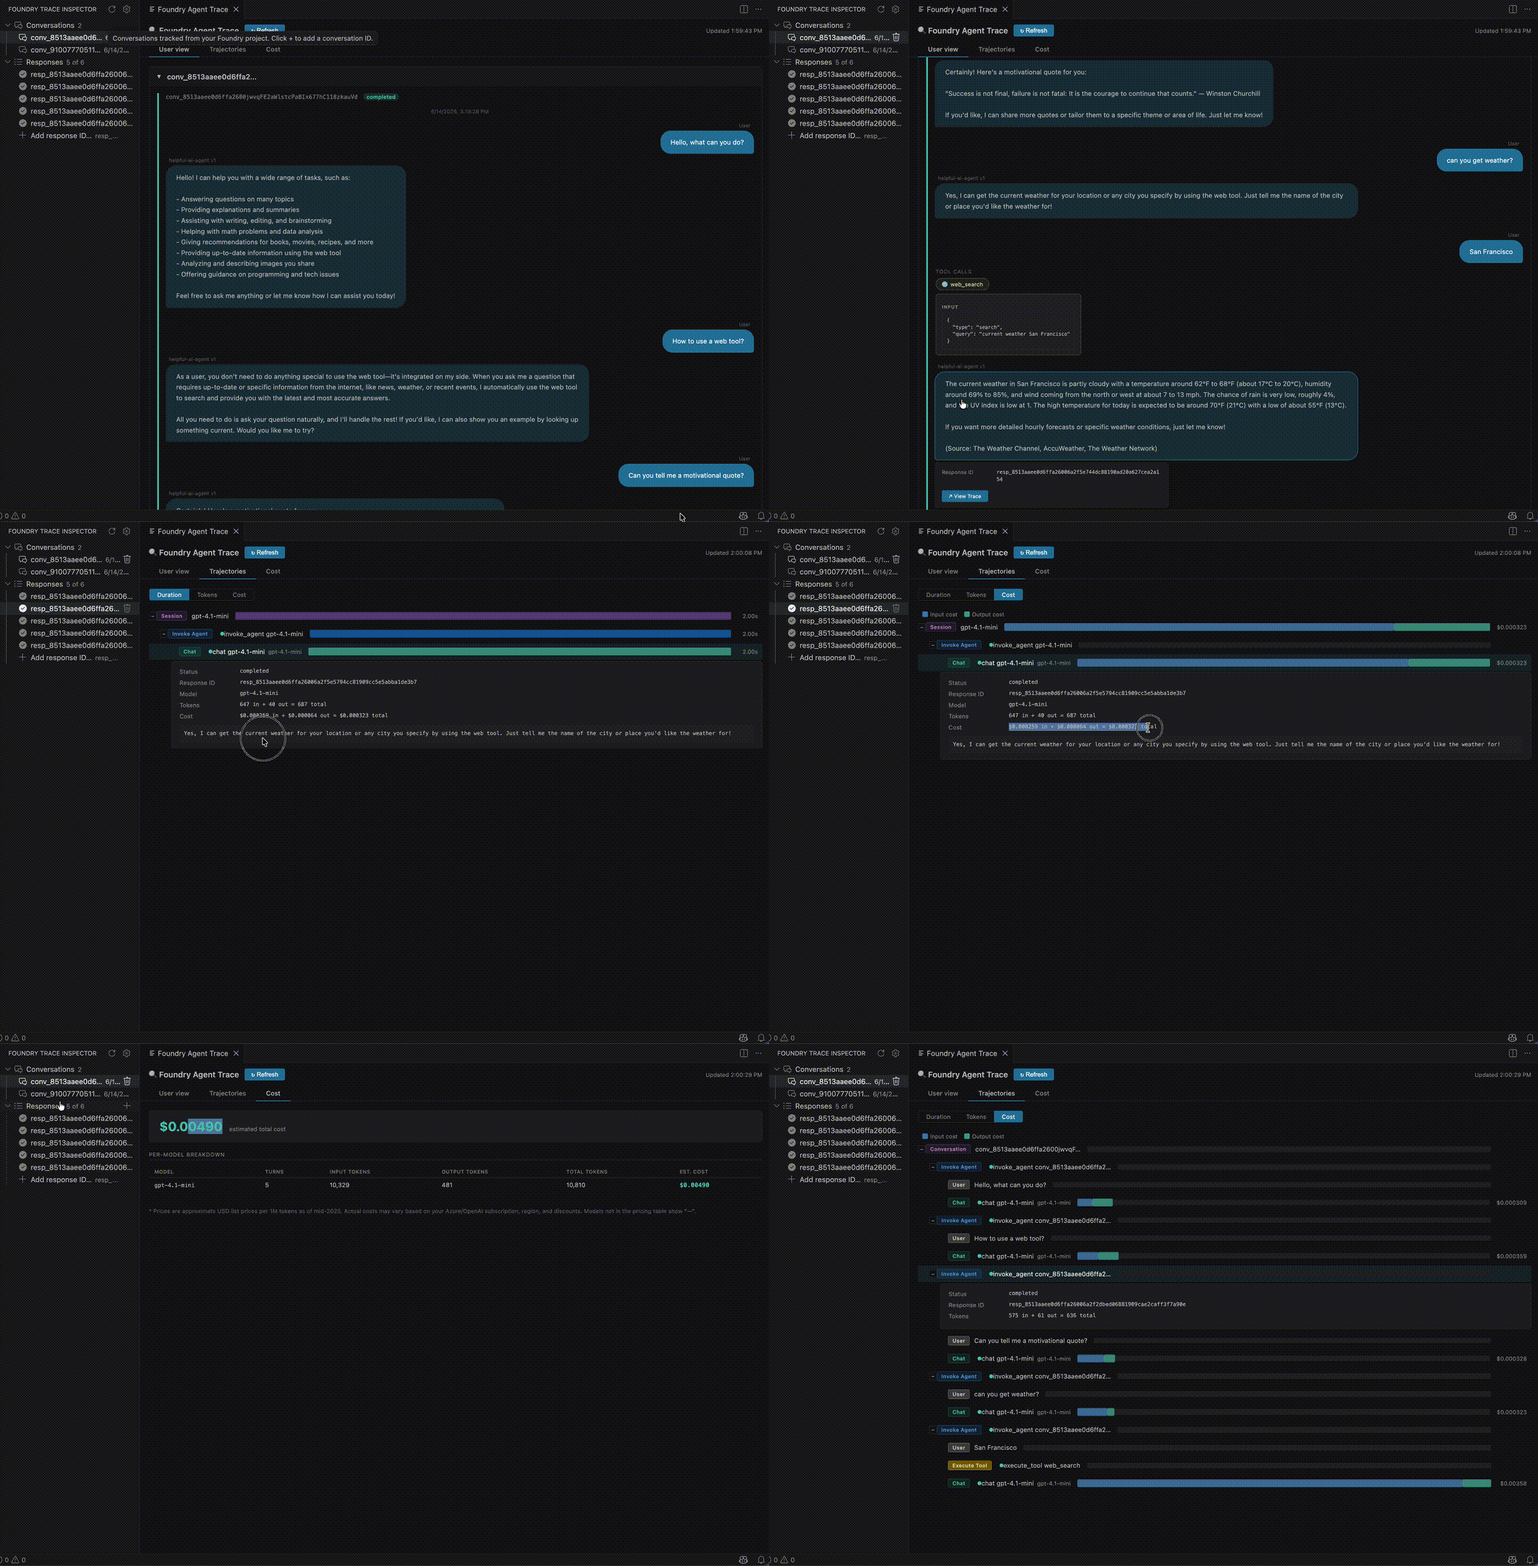
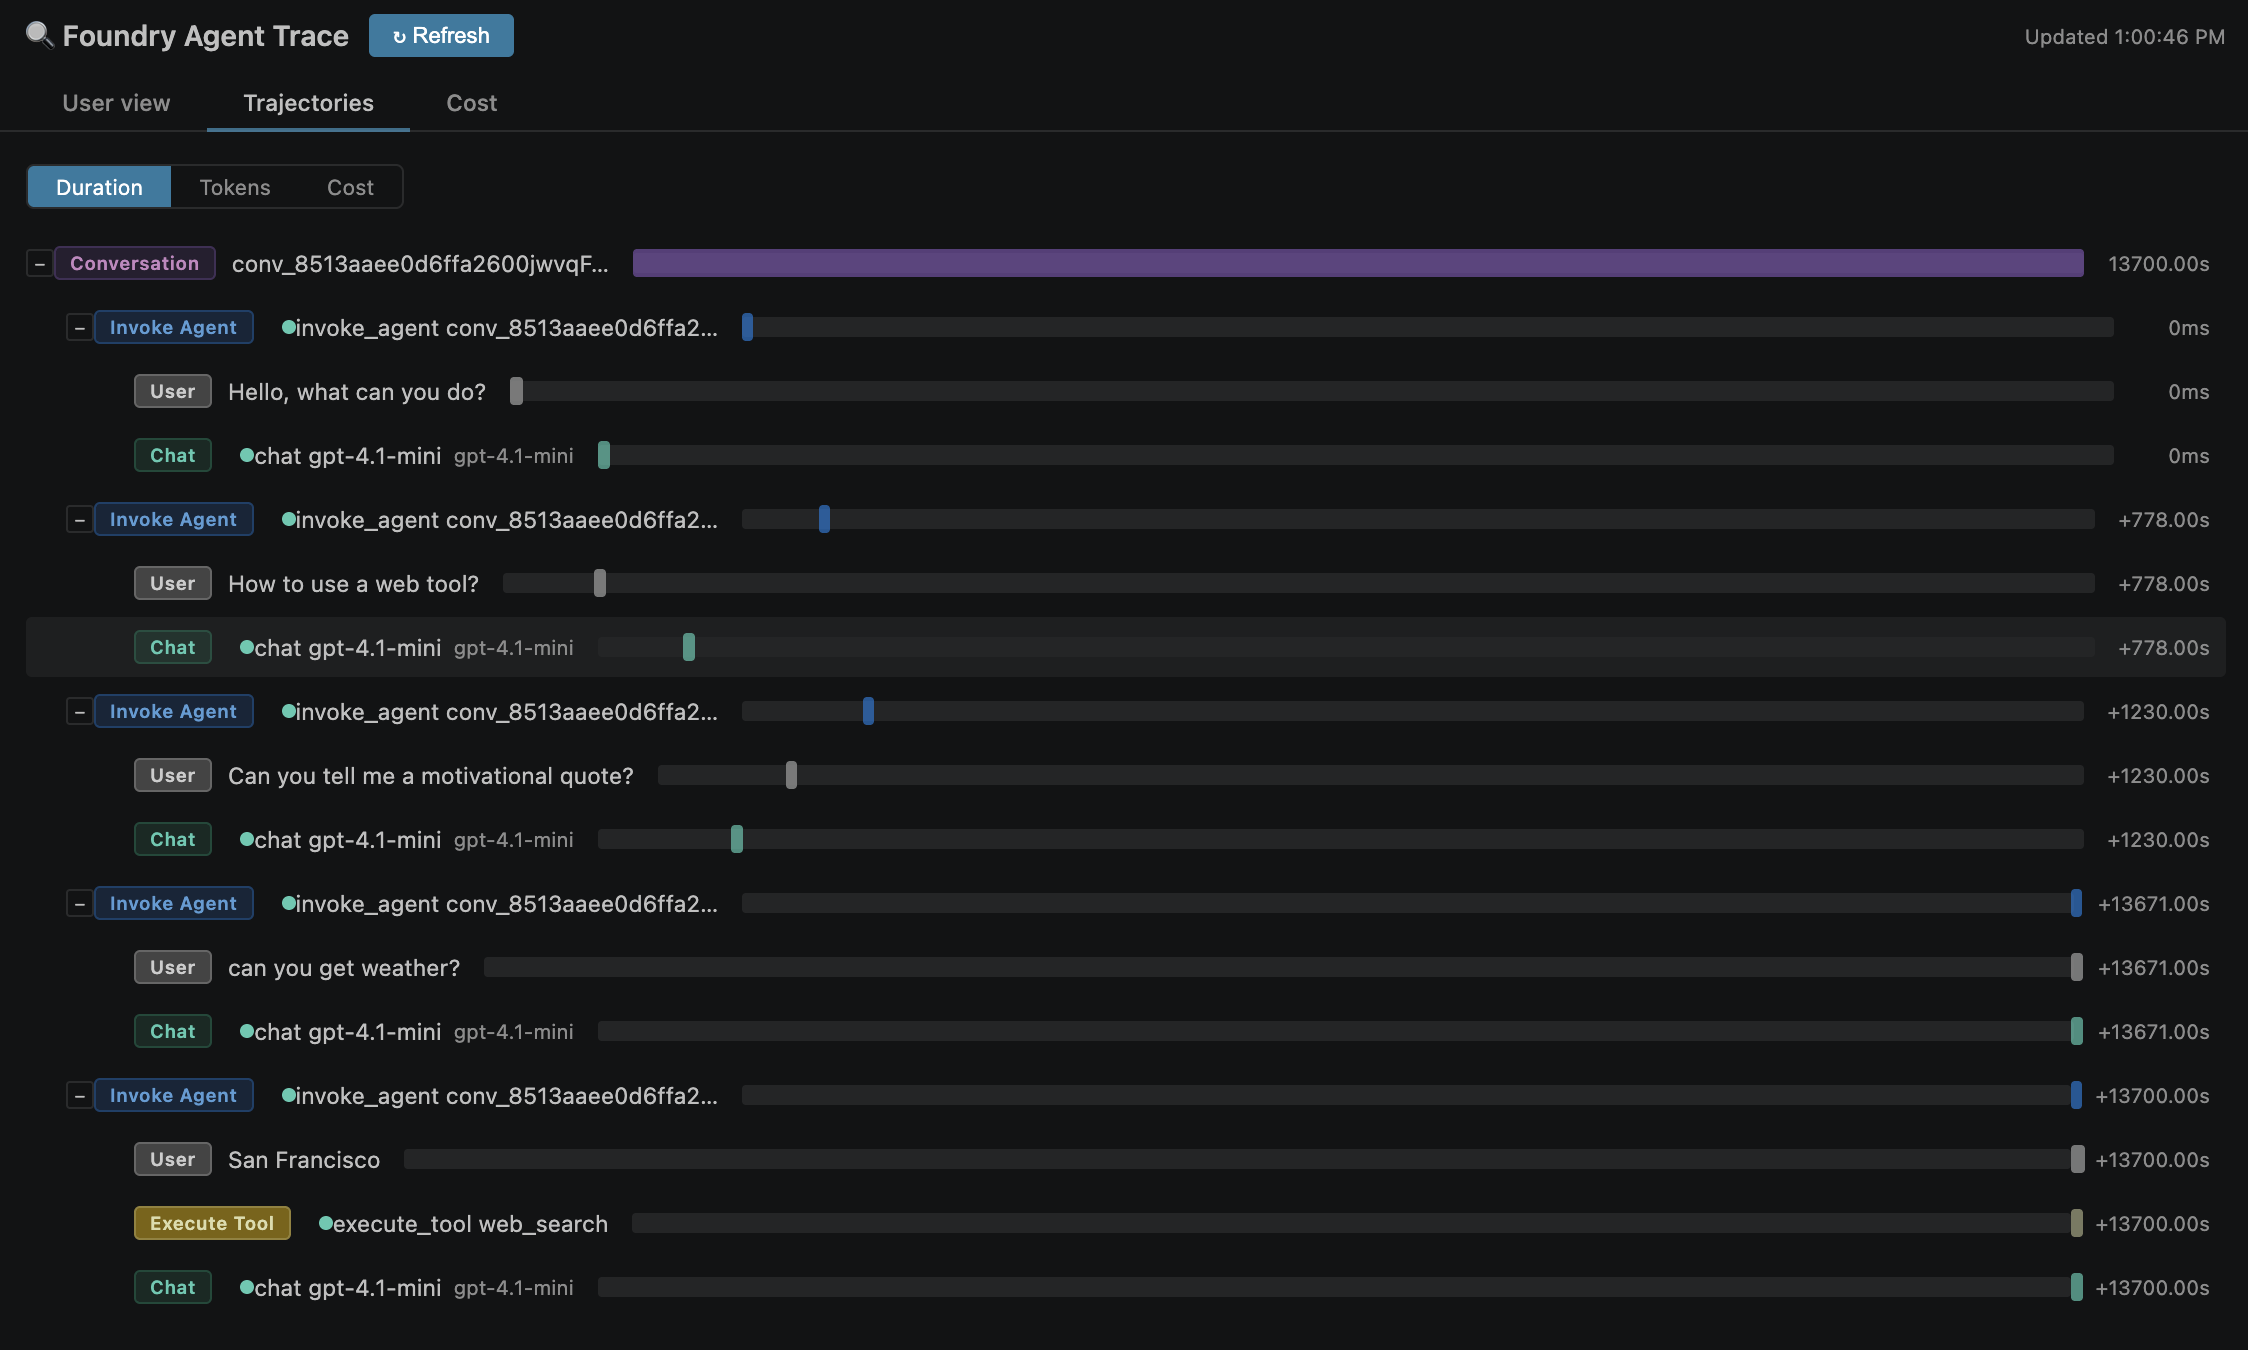
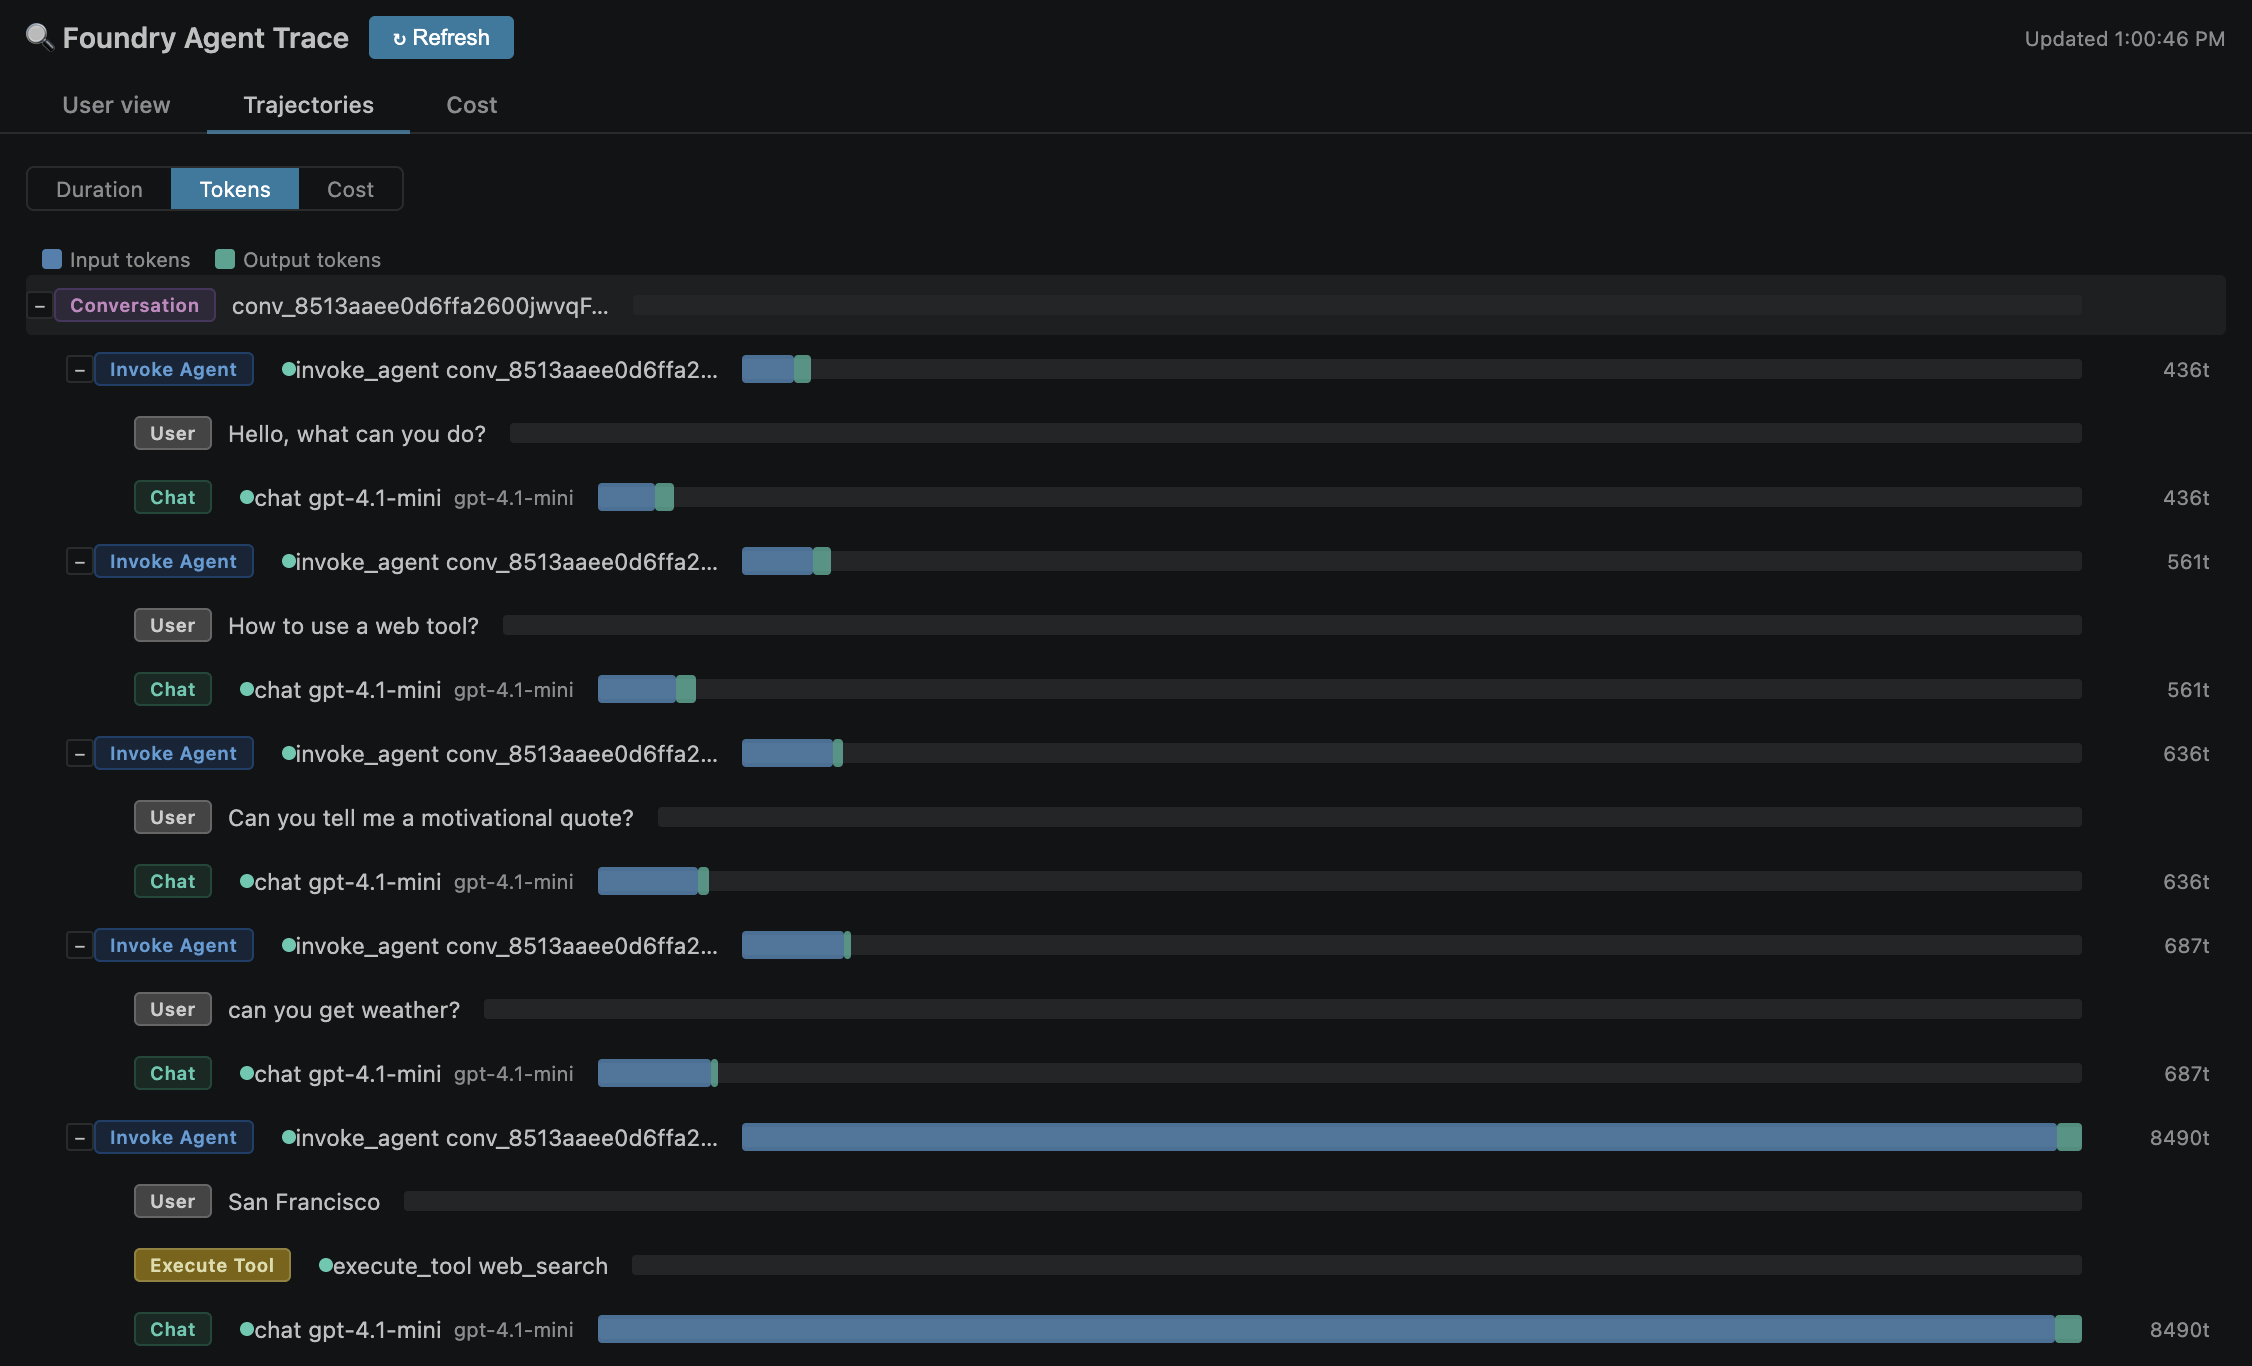
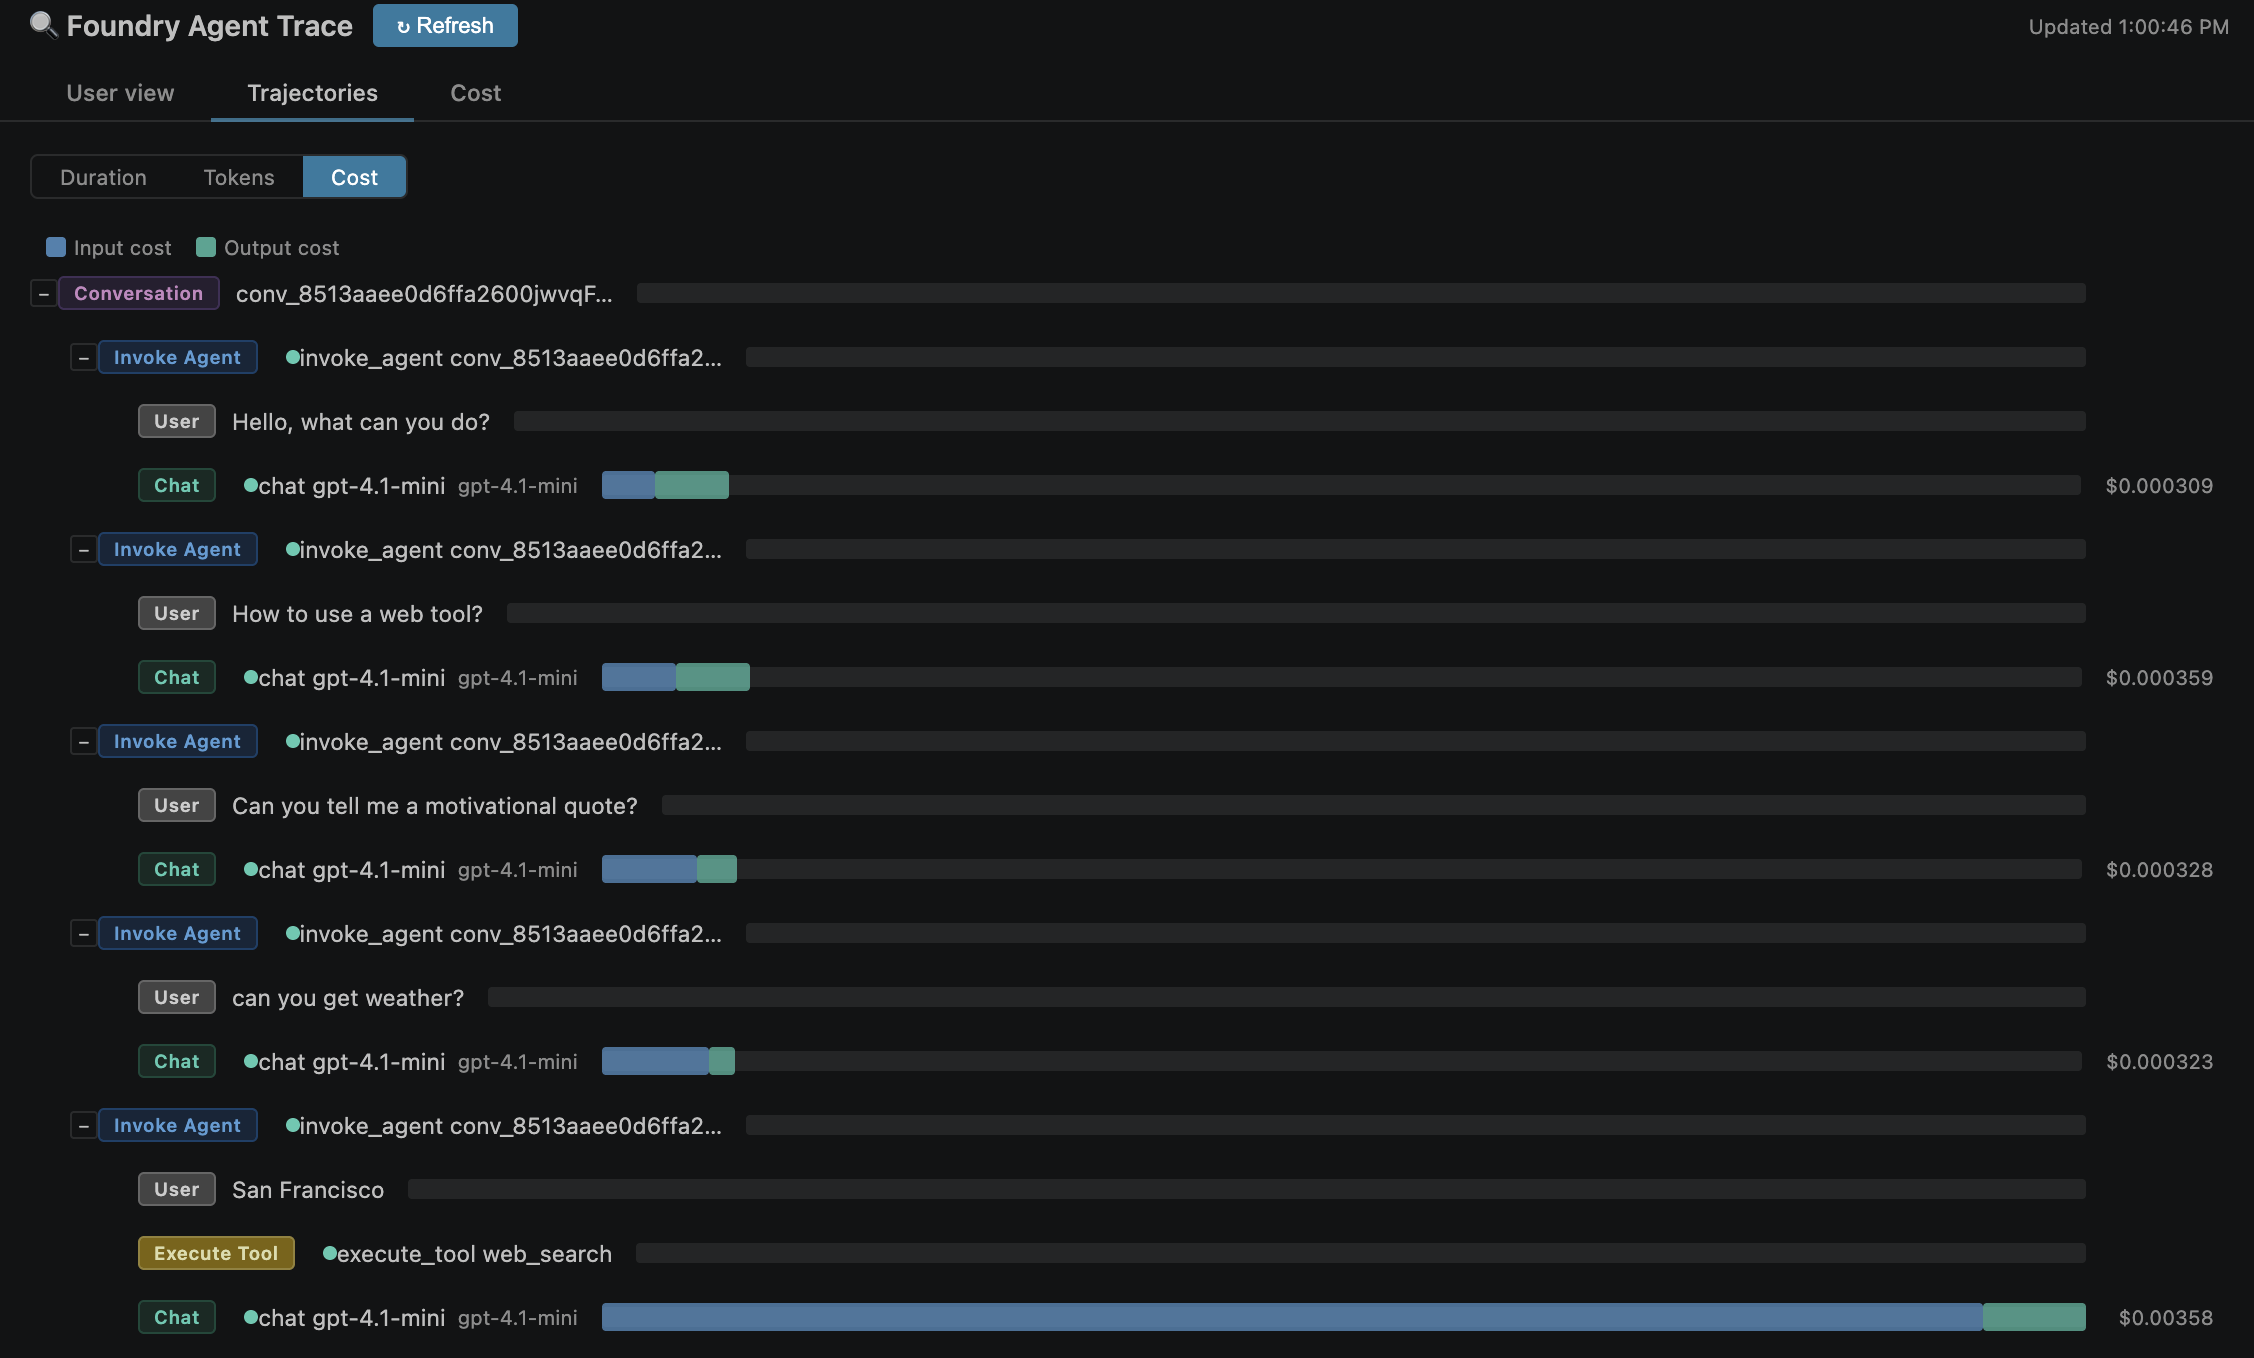
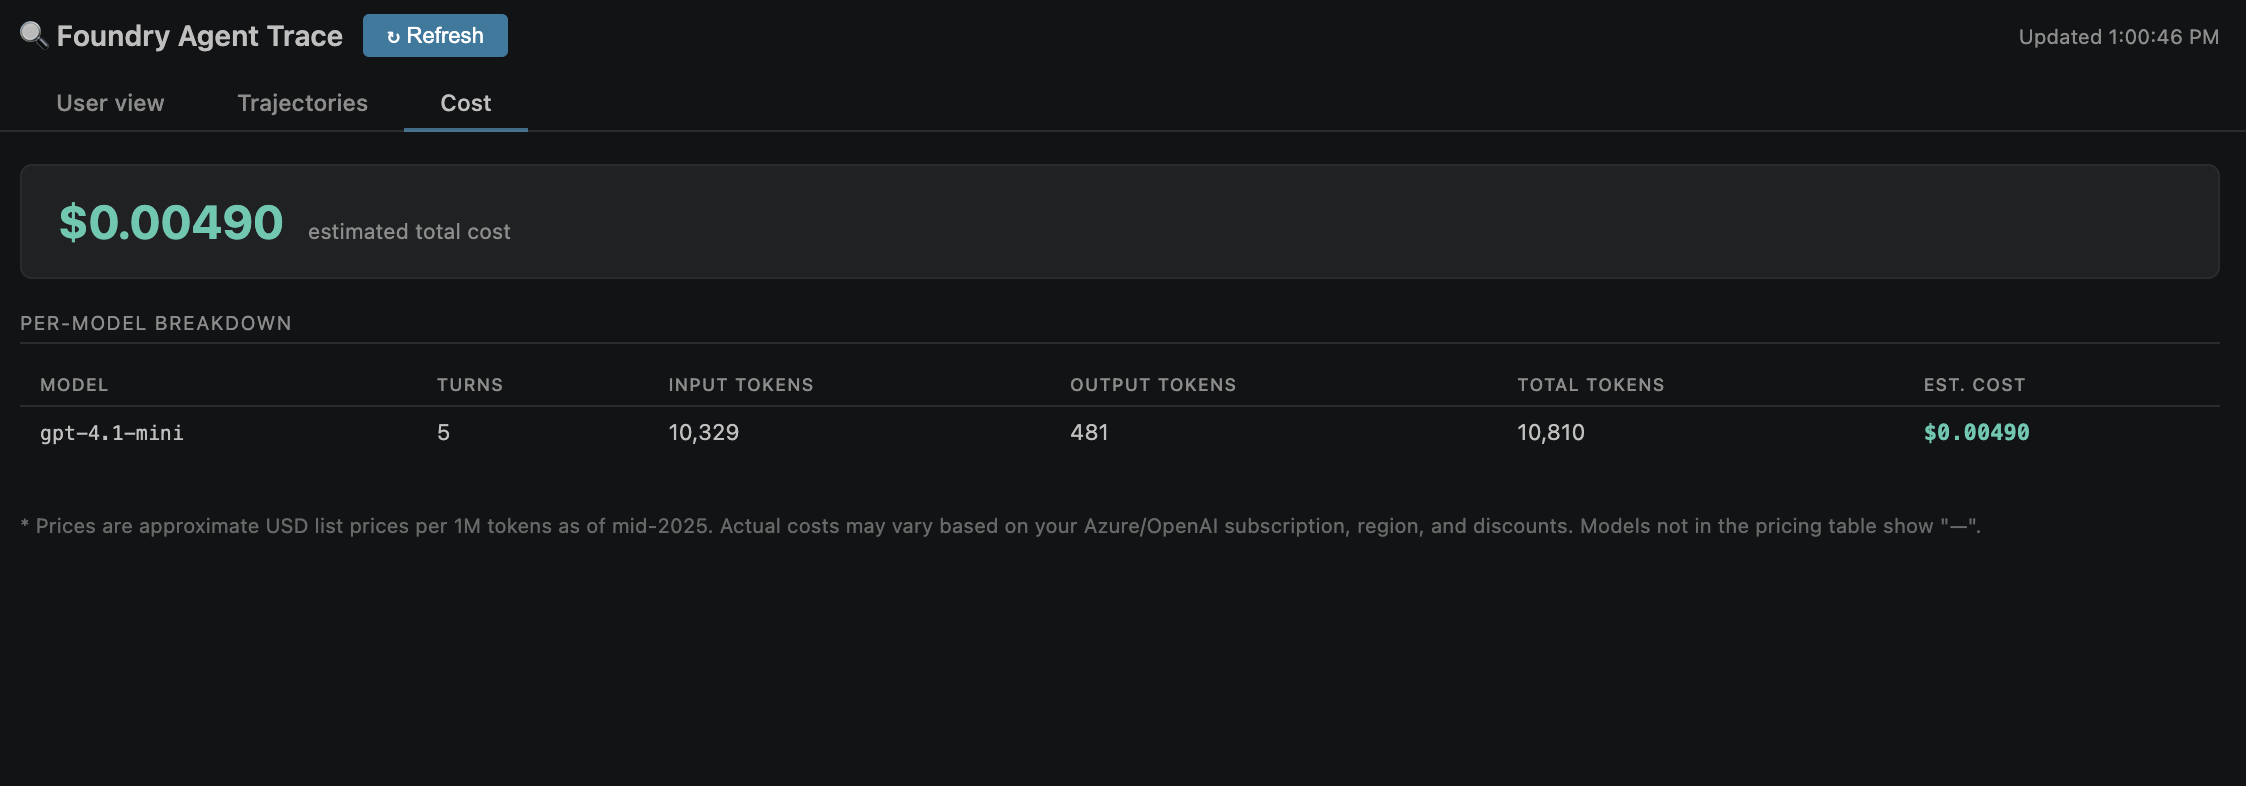
- Trajectories view — collapsible span tree with Gantt-style timing bars, token counts, and cost per span
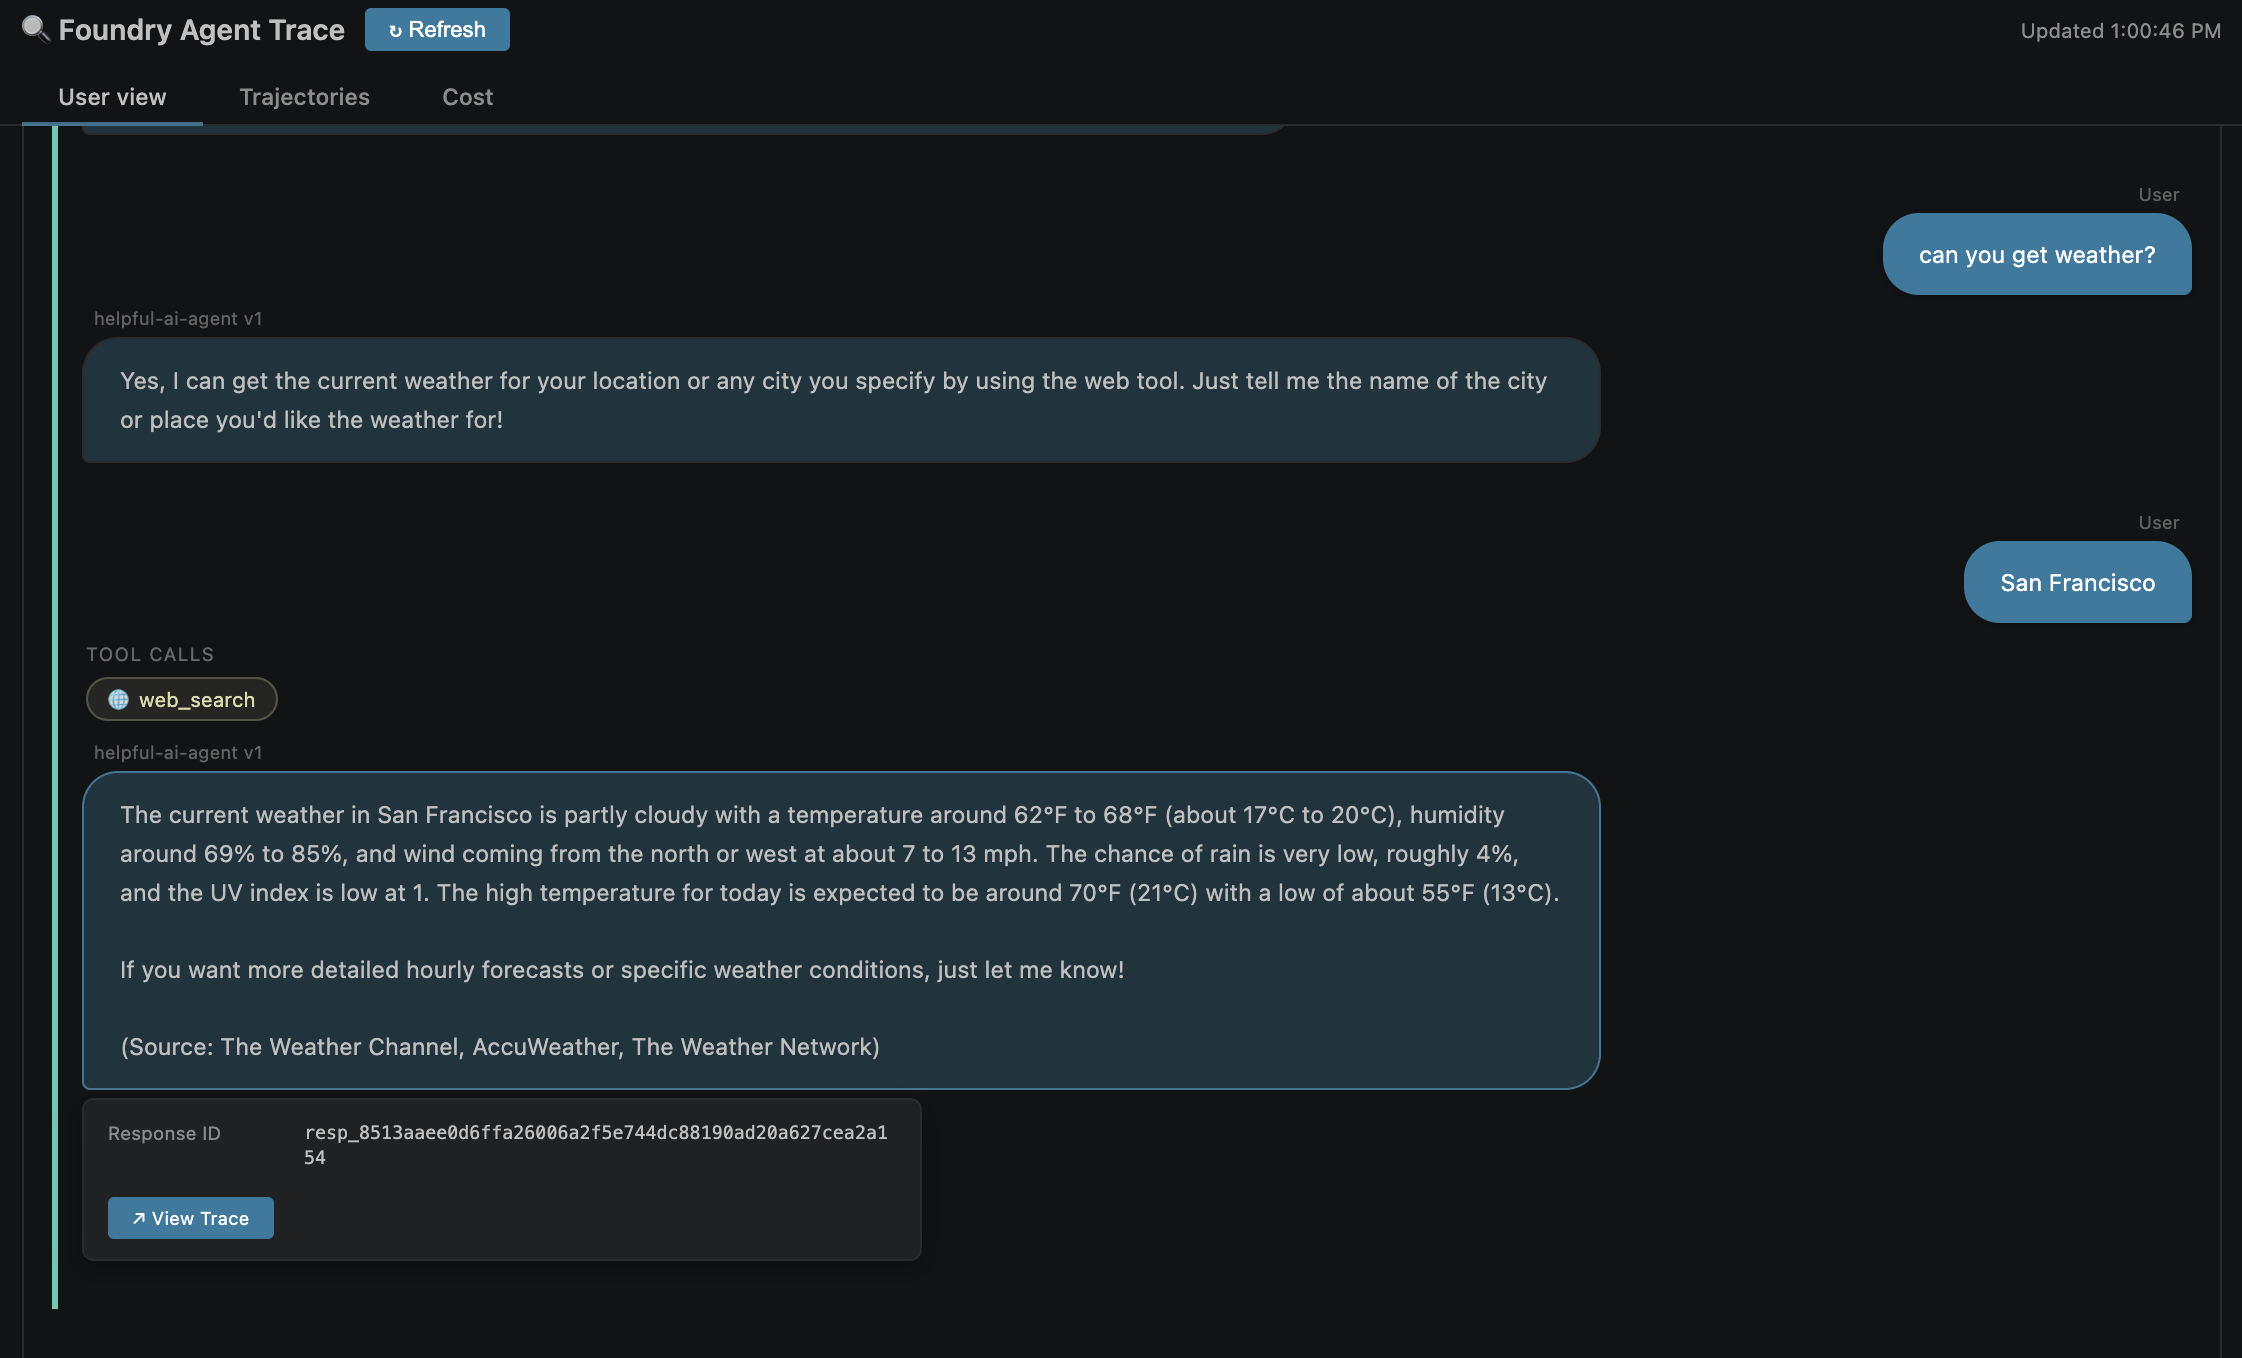
- User View — readable chat-bubble replay of the full conversation with agent name on each turn
- Token & Cost chart — input vs output tokens per LLM turn so you can spot expensive calls at a glance
- Sidebar panel — track conversations and responses from the Activity Bar; click any item to open its trace
- "View Trace" deep link — jump from any assistant bubble in User View directly to that response in the sidebar
- Conversation tracking —
conv_... IDs are discovered automatically from saved responses
- One-click refresh — re-fetches all trace data without reopening the panel
- API key or Entra ID auth — API key stored in VS Code SecretStorage; or
az login / managed identity
- VS Code for the Web — works on vscode.dev with API key auth
- Theme aware — light, dark, and high-contrast all supported
Getting Started
1. Install
Search "Foundry Trace Inspector" in the VS Code Extensions panel, or install from the Marketplace.
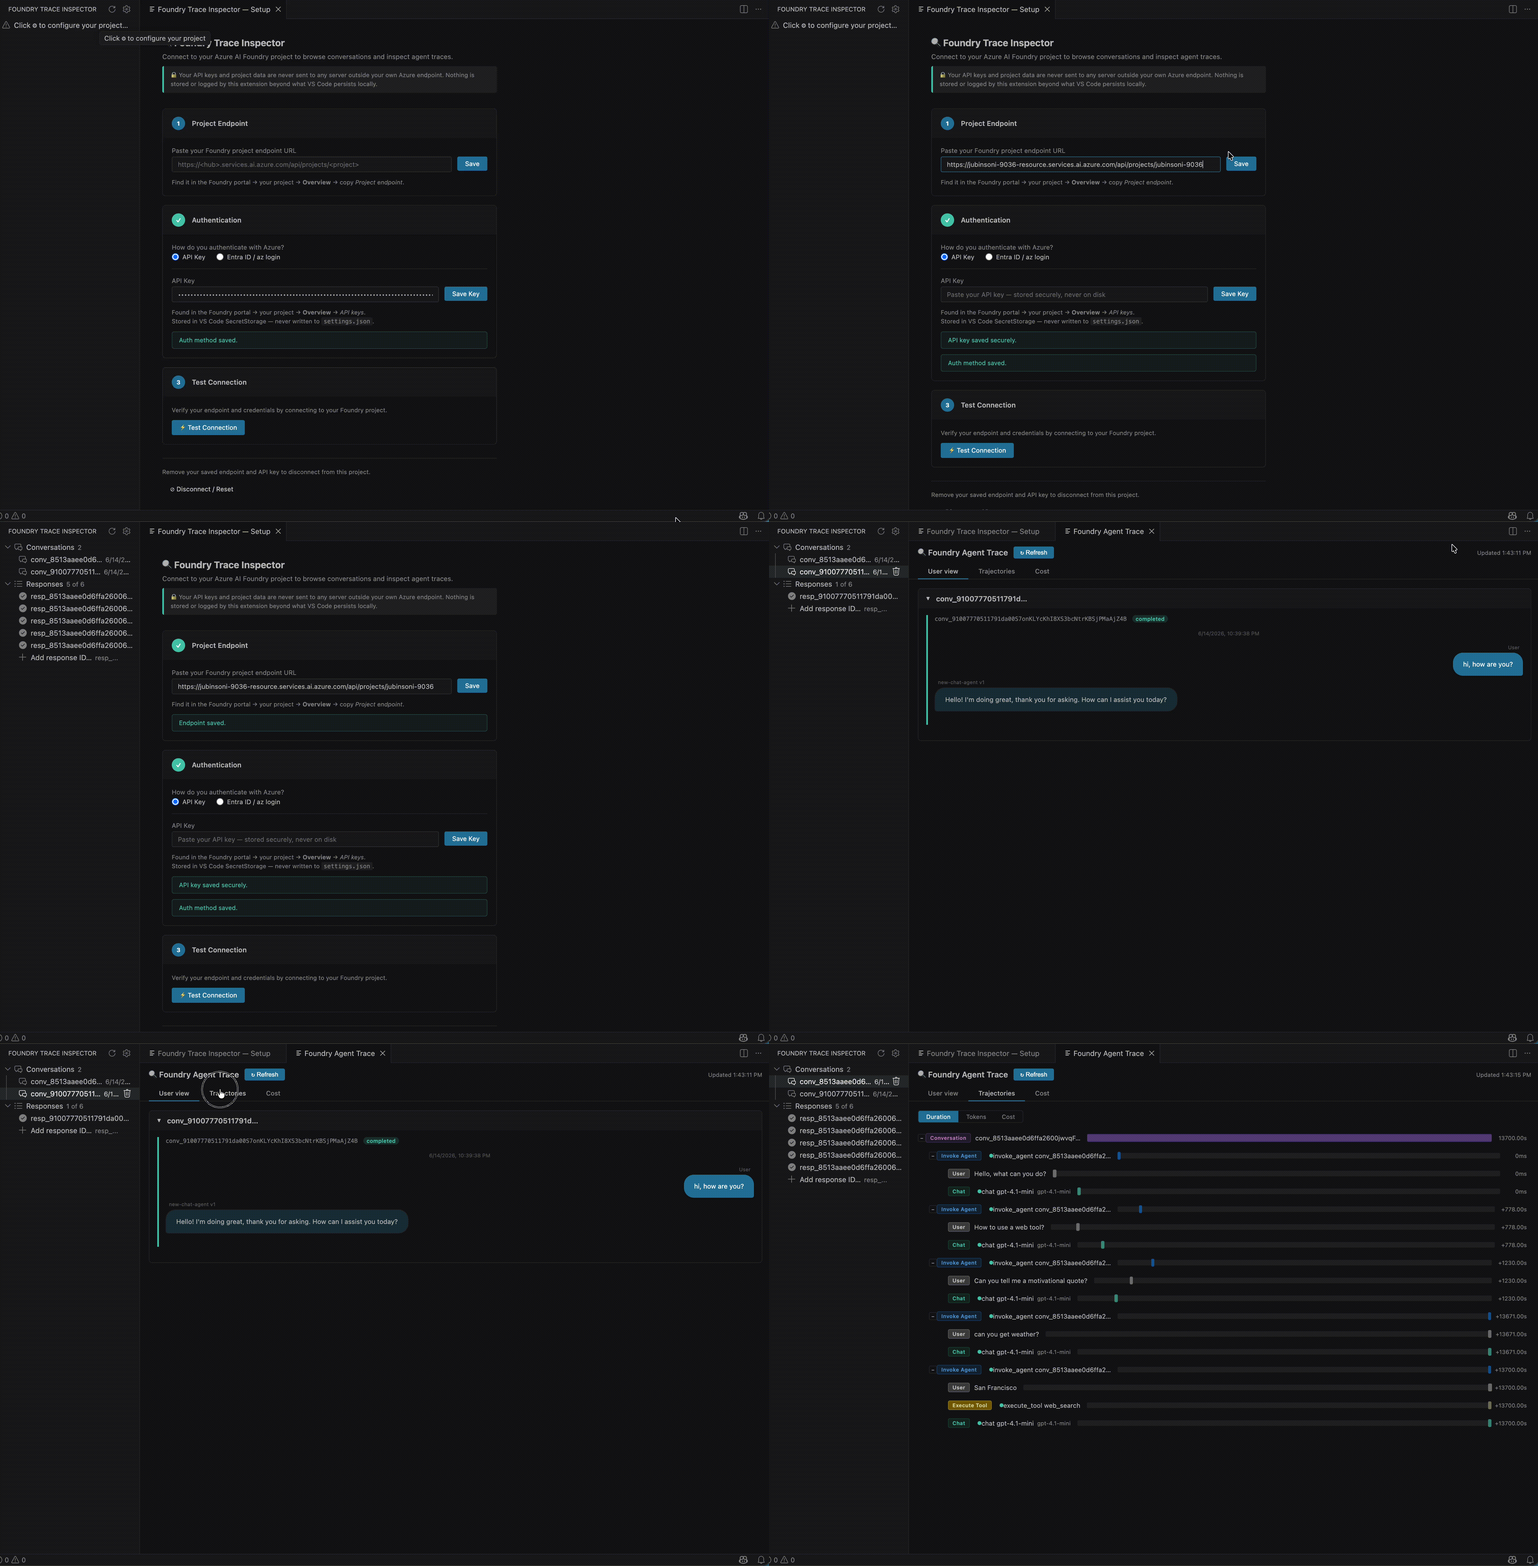
Click the Foundry Trace Inspector icon in the Activity Bar, then click the ⚙ gear button to open the setup panel.
| Setting |
Where to find it |
| Project Endpoint |
Foundry portal → your project → Overview → Project endpoint |
| Auth Method |
apiKey (recommended) or entraId (az login / managed identity) |
If using an API key, paste it in the setup panel — it is stored in VS Code's encrypted SecretStorage and never written to settings.json.
3. Track a conversation or response
Option A — Track a conversation (recommended)
- In the Foundry portal, open your agent → Traces tab → copy the
conv_... ID
- In VS Code, click + next to Conversations in the sidebar and paste it
All responses in that conversation are discovered automatically.
Option B — Track an individual response
- In the Foundry portal, open your agent → Traces tab → click a trace and copy the
resp_... ID
- In VS Code, click + next to Responses in the sidebar and paste it
4. Explore the trace
Click any response in the sidebar to open the trace panel. Switch between:
- Trajectories — span tree with timing bars
- User View — readable conversation replay with "View Trace" buttons
- Duration / Tokens / Cost — per-span breakdown charts
Screenshots
| Tokens |
Cost |
 |
 |
Commands
All actions are available from the Activity Bar panel and the Command Palette (Cmd+Shift+P / Ctrl+Shift+P → type "Foundry Trace").
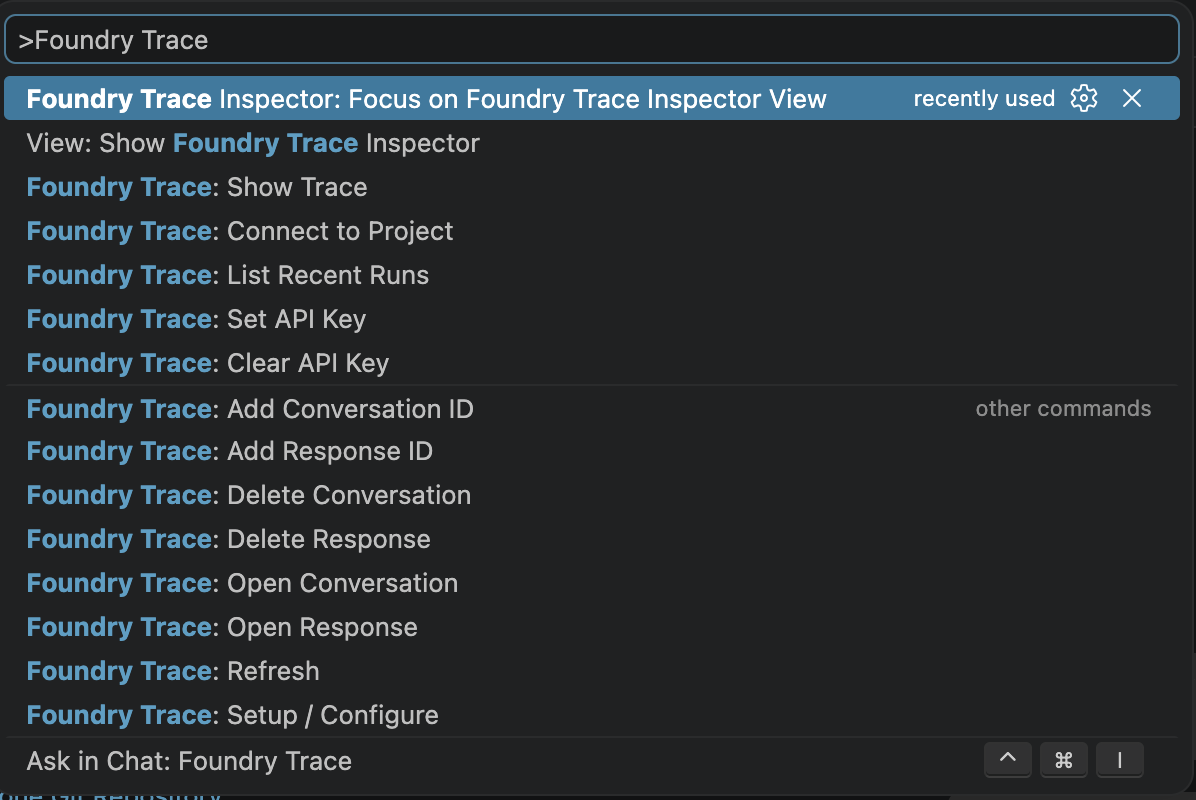
| Command |
Description |
Foundry Trace: Setup / Configure |
Open the setup panel |
Foundry Trace: Refresh |
Re-fetch all tracked data |
Foundry Trace: Add Response ID |
Track a resp_... response |
Foundry Trace: Add Conversation ID |
Track a conv_... conversation |
Foundry Trace: Delete Response |
Remove a tracked response |
Foundry Trace: Delete Conversation |
Remove a tracked conversation |
Foundry Trace: Set API Key |
Store an API key securely |
Foundry Trace: Clear API Key |
Remove the stored API key |
Privacy
This extension makes API calls only to the Microsoft Foundry endpoint you configure. No usage data, telemetry, or trace content is sent anywhere else.
Requirements
- VS Code 1.85 or later (desktop or vscode.dev)
- A Microsoft Foundry project with at least one agent
- An API key or Azure CLI (
az login) / managed identity
Beyond VS Code
The trace engine also ships as standalone npm packages, so you can inspect Foundry traces from scripts, CI, or the terminal:
npx foundry-trace-inspector-cli show resp_abc123 --endpoint <your-project-endpoint>
Contributing
Issues and pull requests are welcome at github.com/jubins/ai-foundry-agent-inspector.
License
MIT — free to use, modify, and distribute.