Claude Code Dashboard
A VS Code extension that shows you what Claude is doing on your machine — token usage, estimated costs, sessions, and insights across all your projects, right inside VS Code.
No API key required. No data leaves your machine.


Screenshots
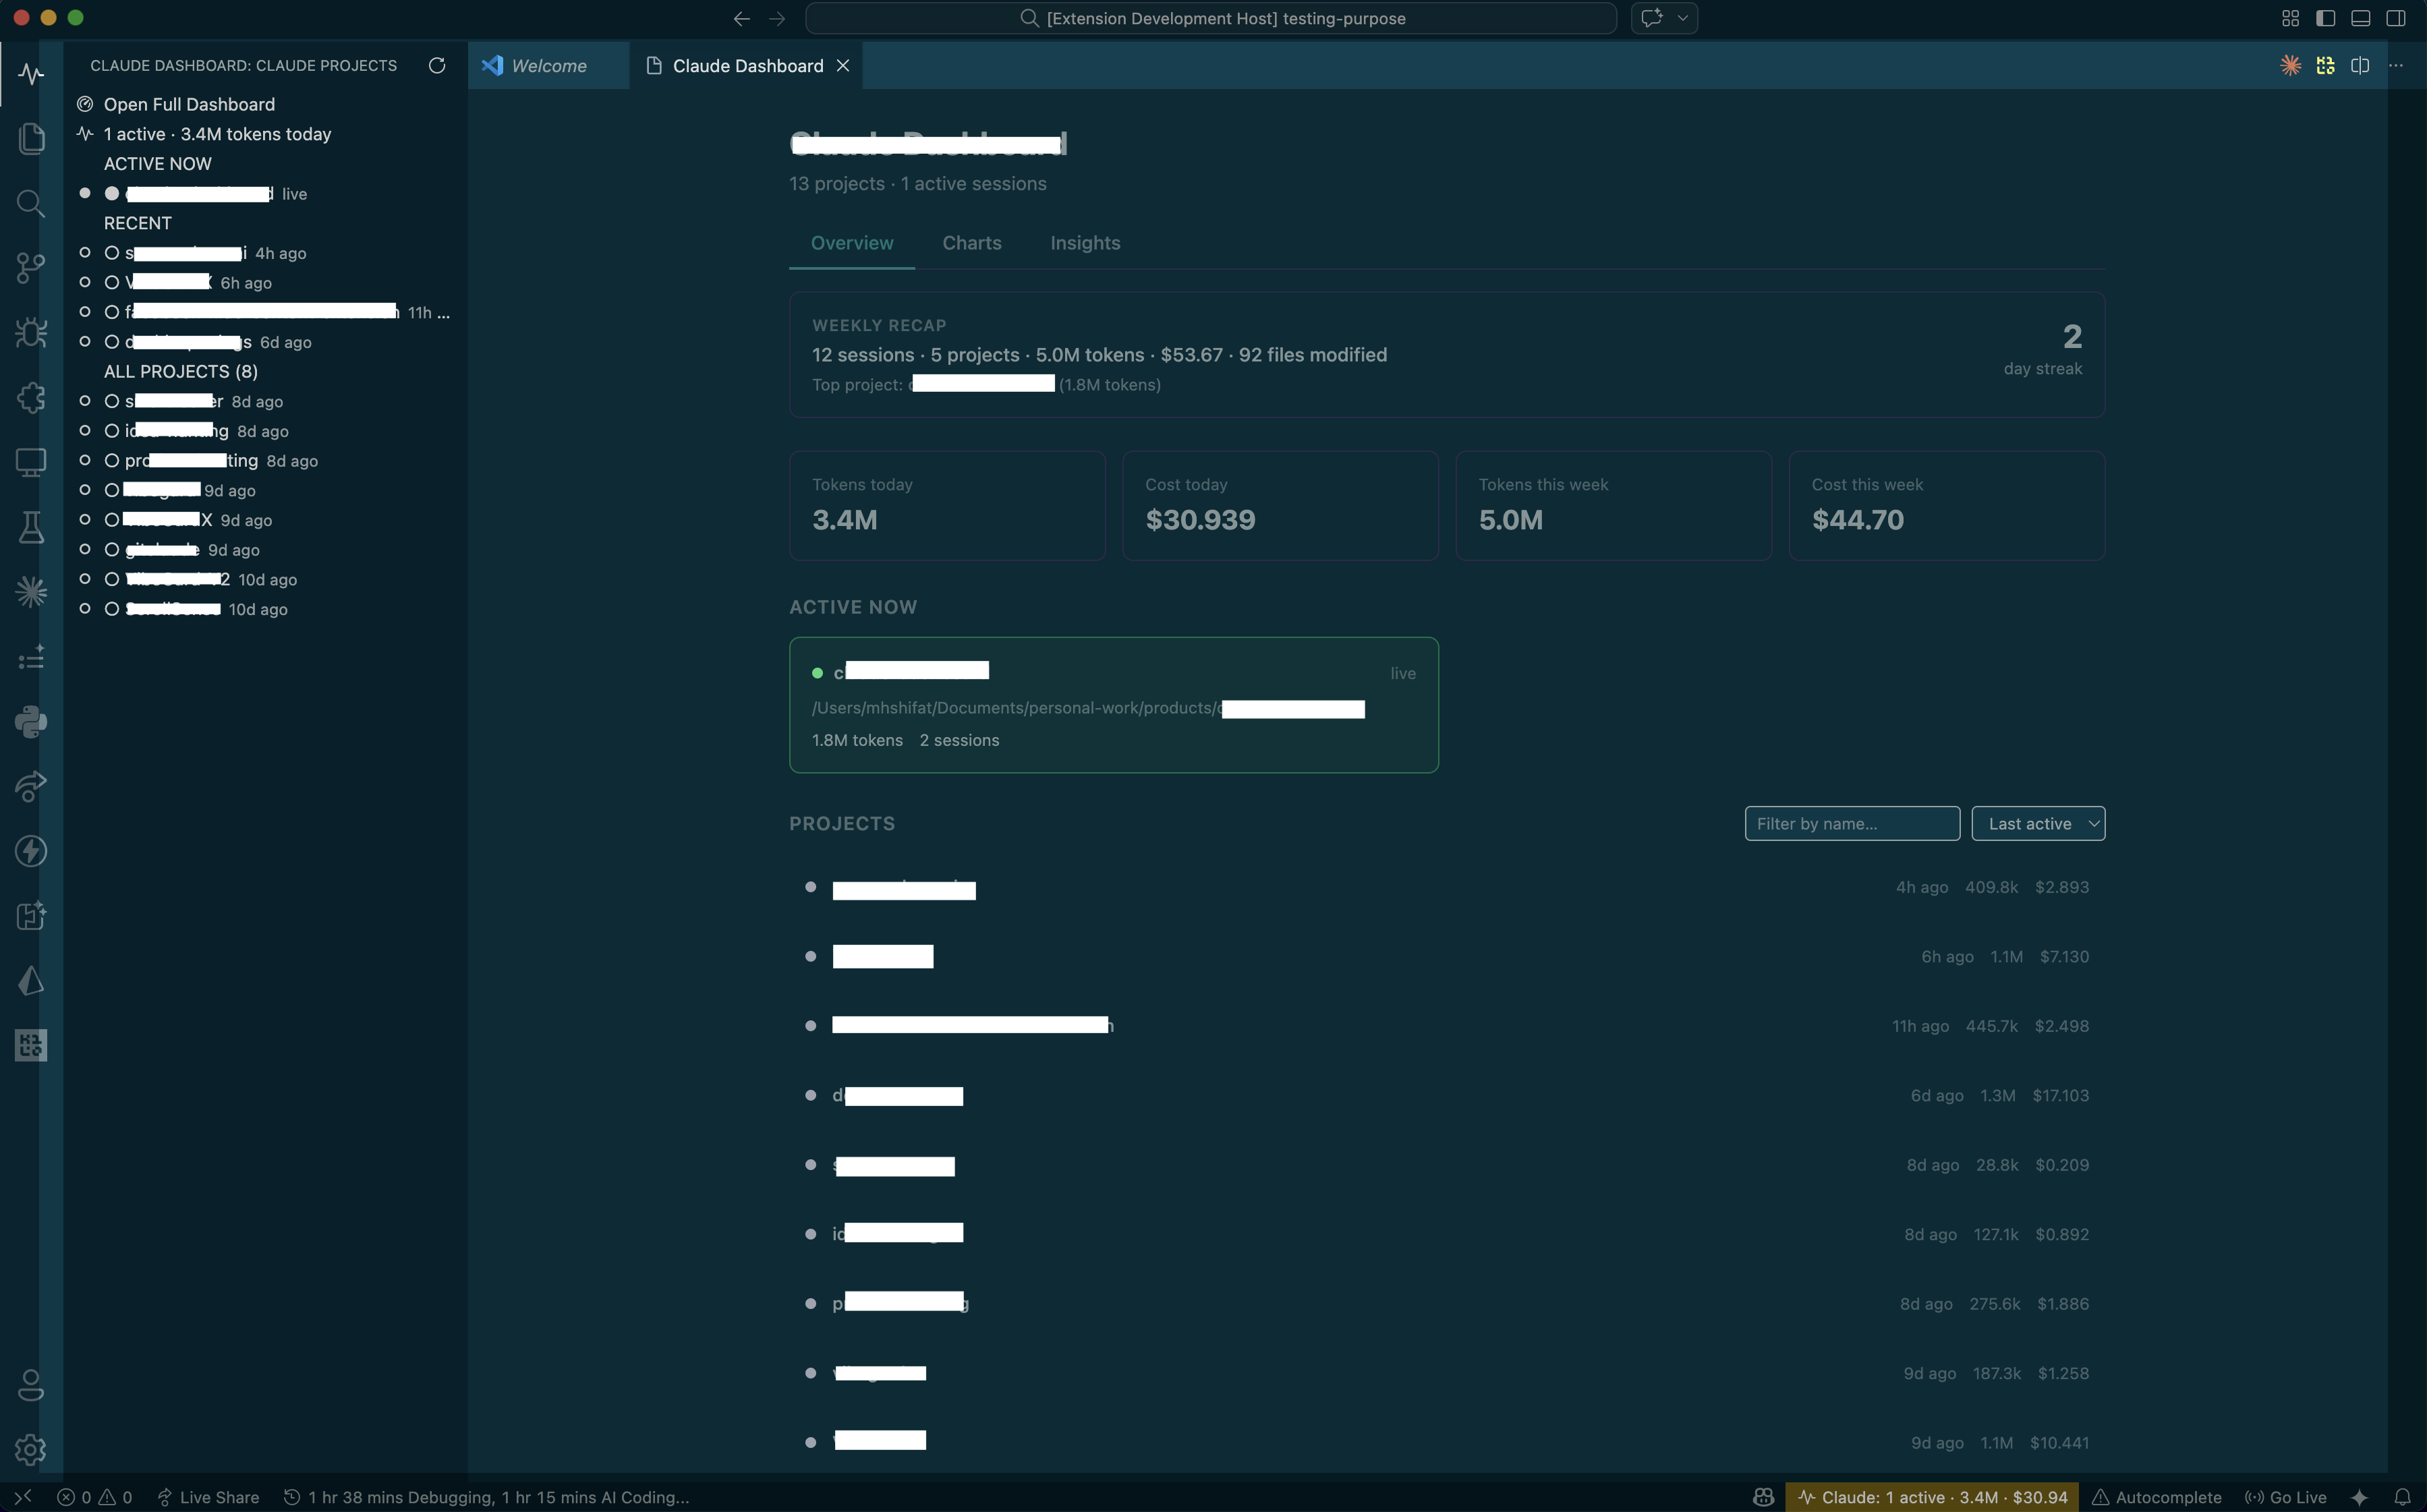 Main dashboard — projects, stats, weekly recap, and estimated cost overview
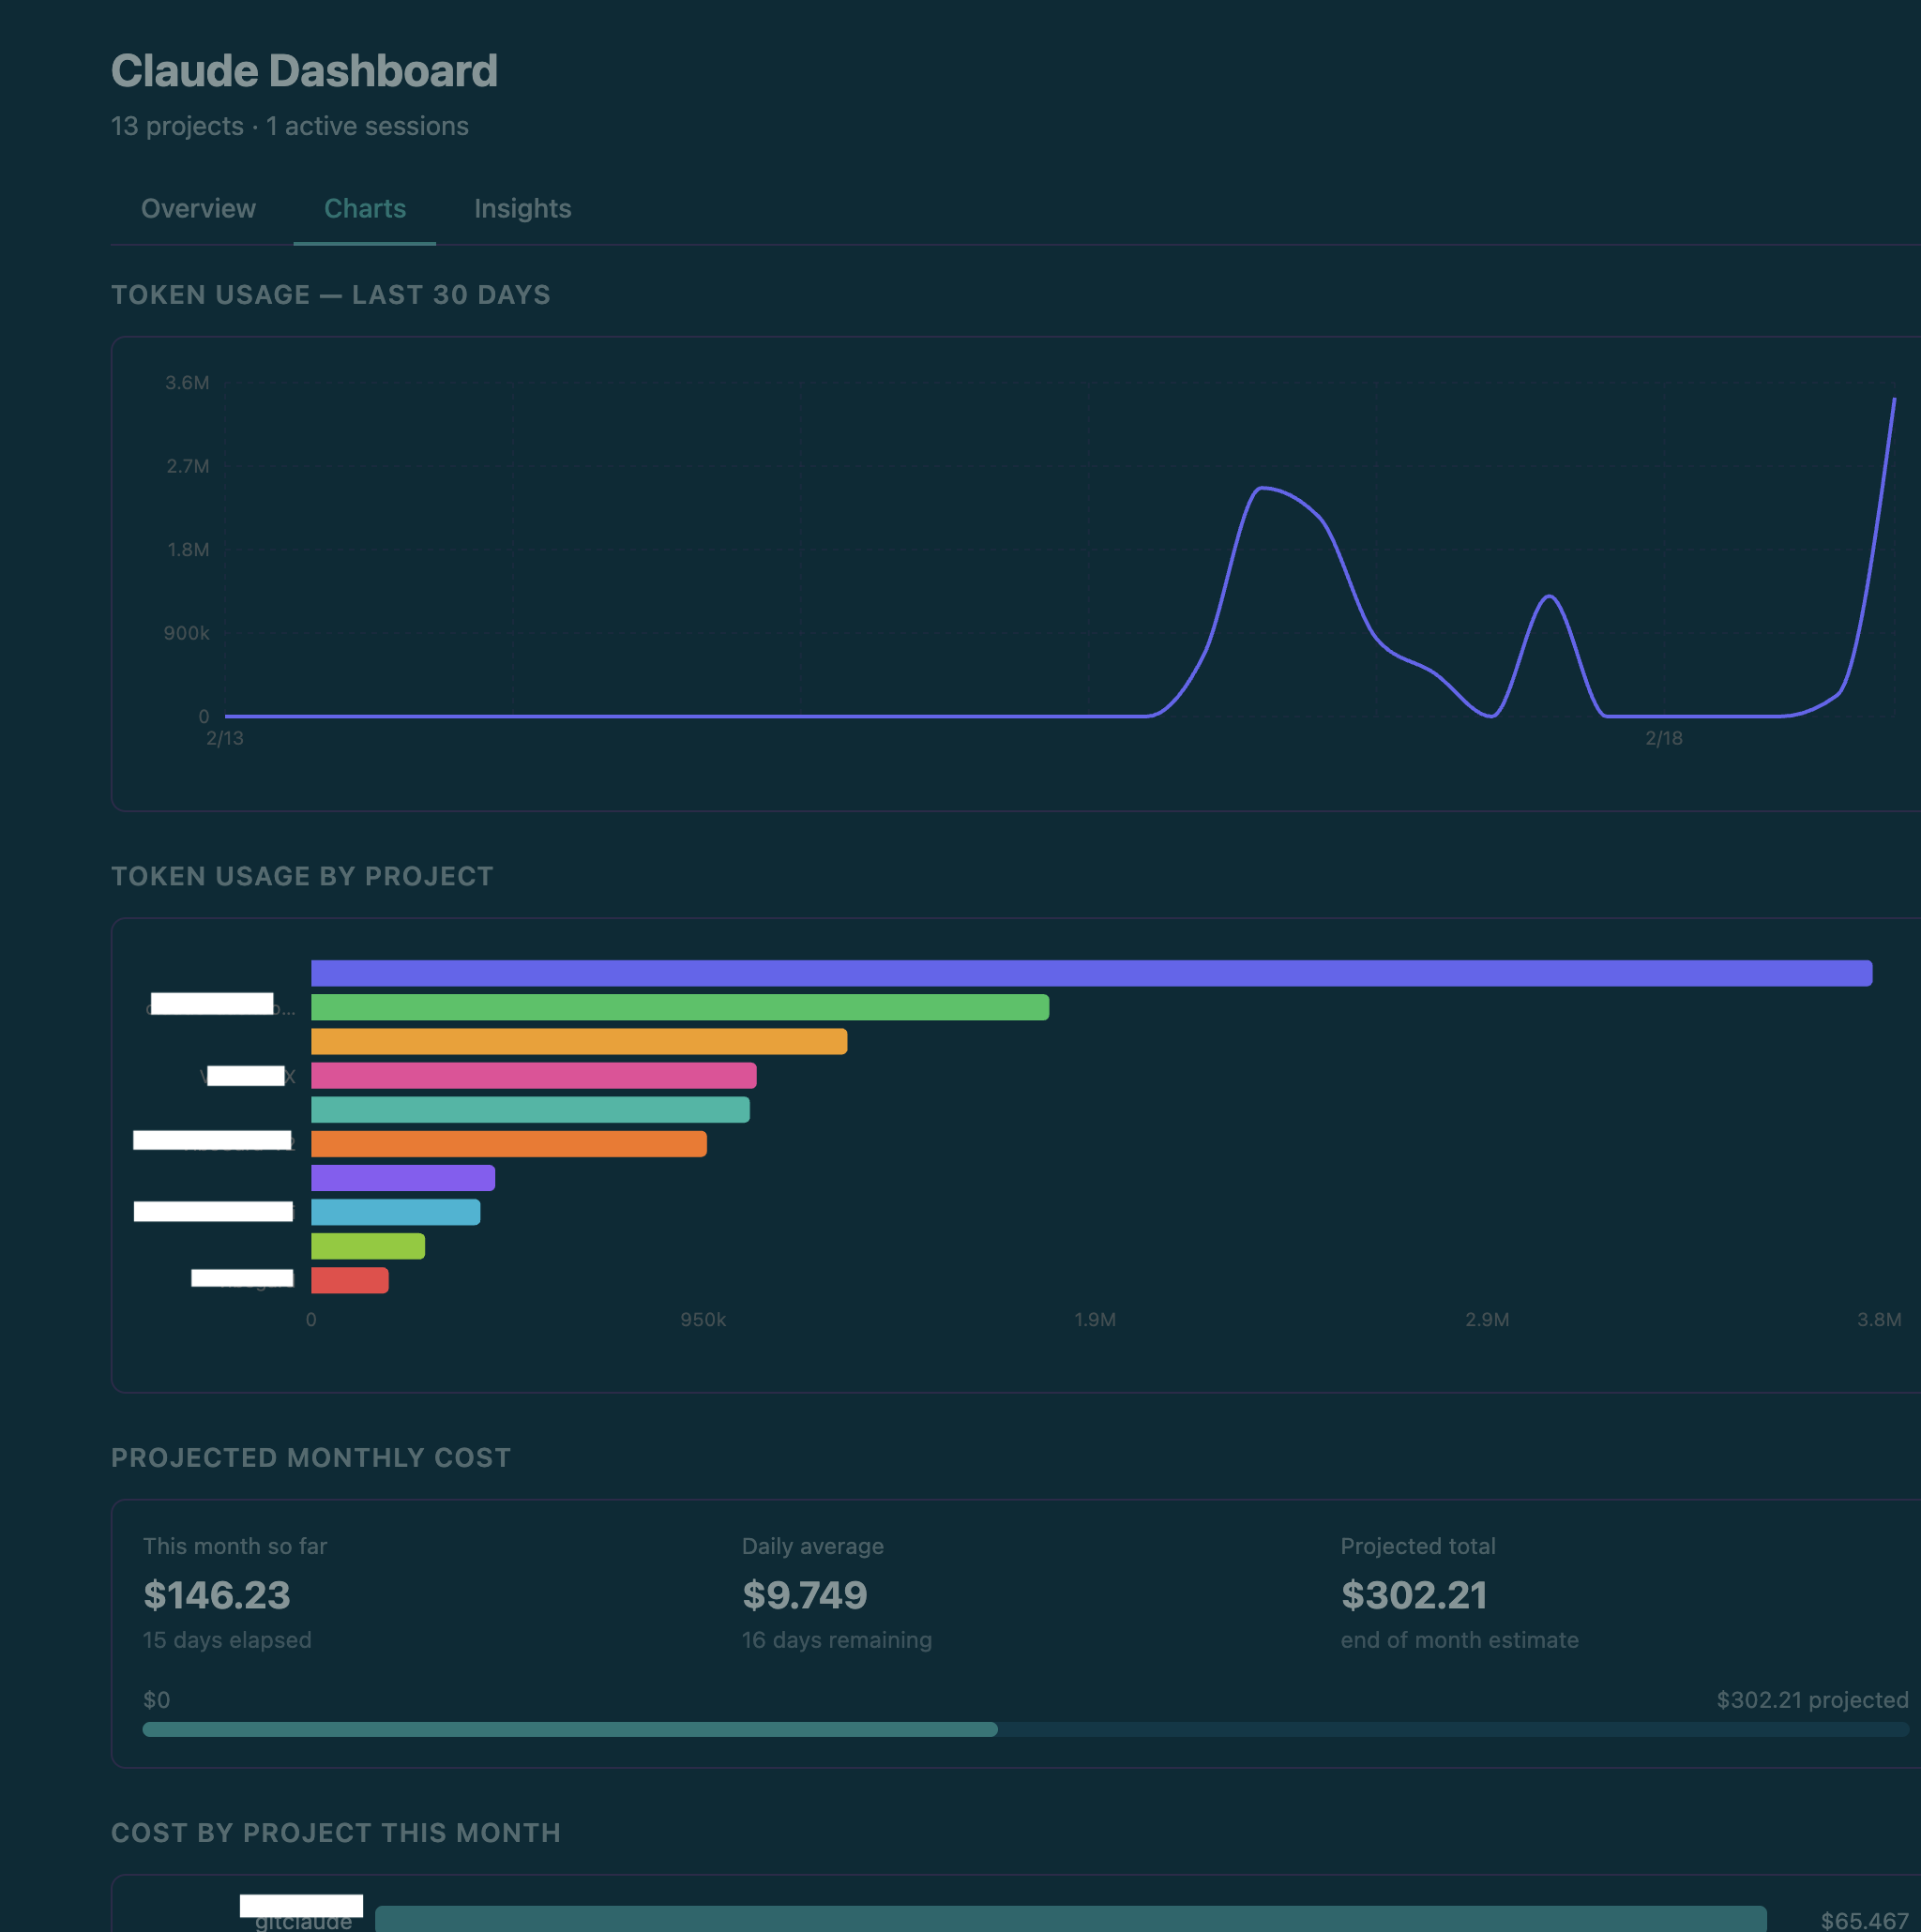 Charts tab — 30-day token trend, usage by project, projected monthly estimated cost
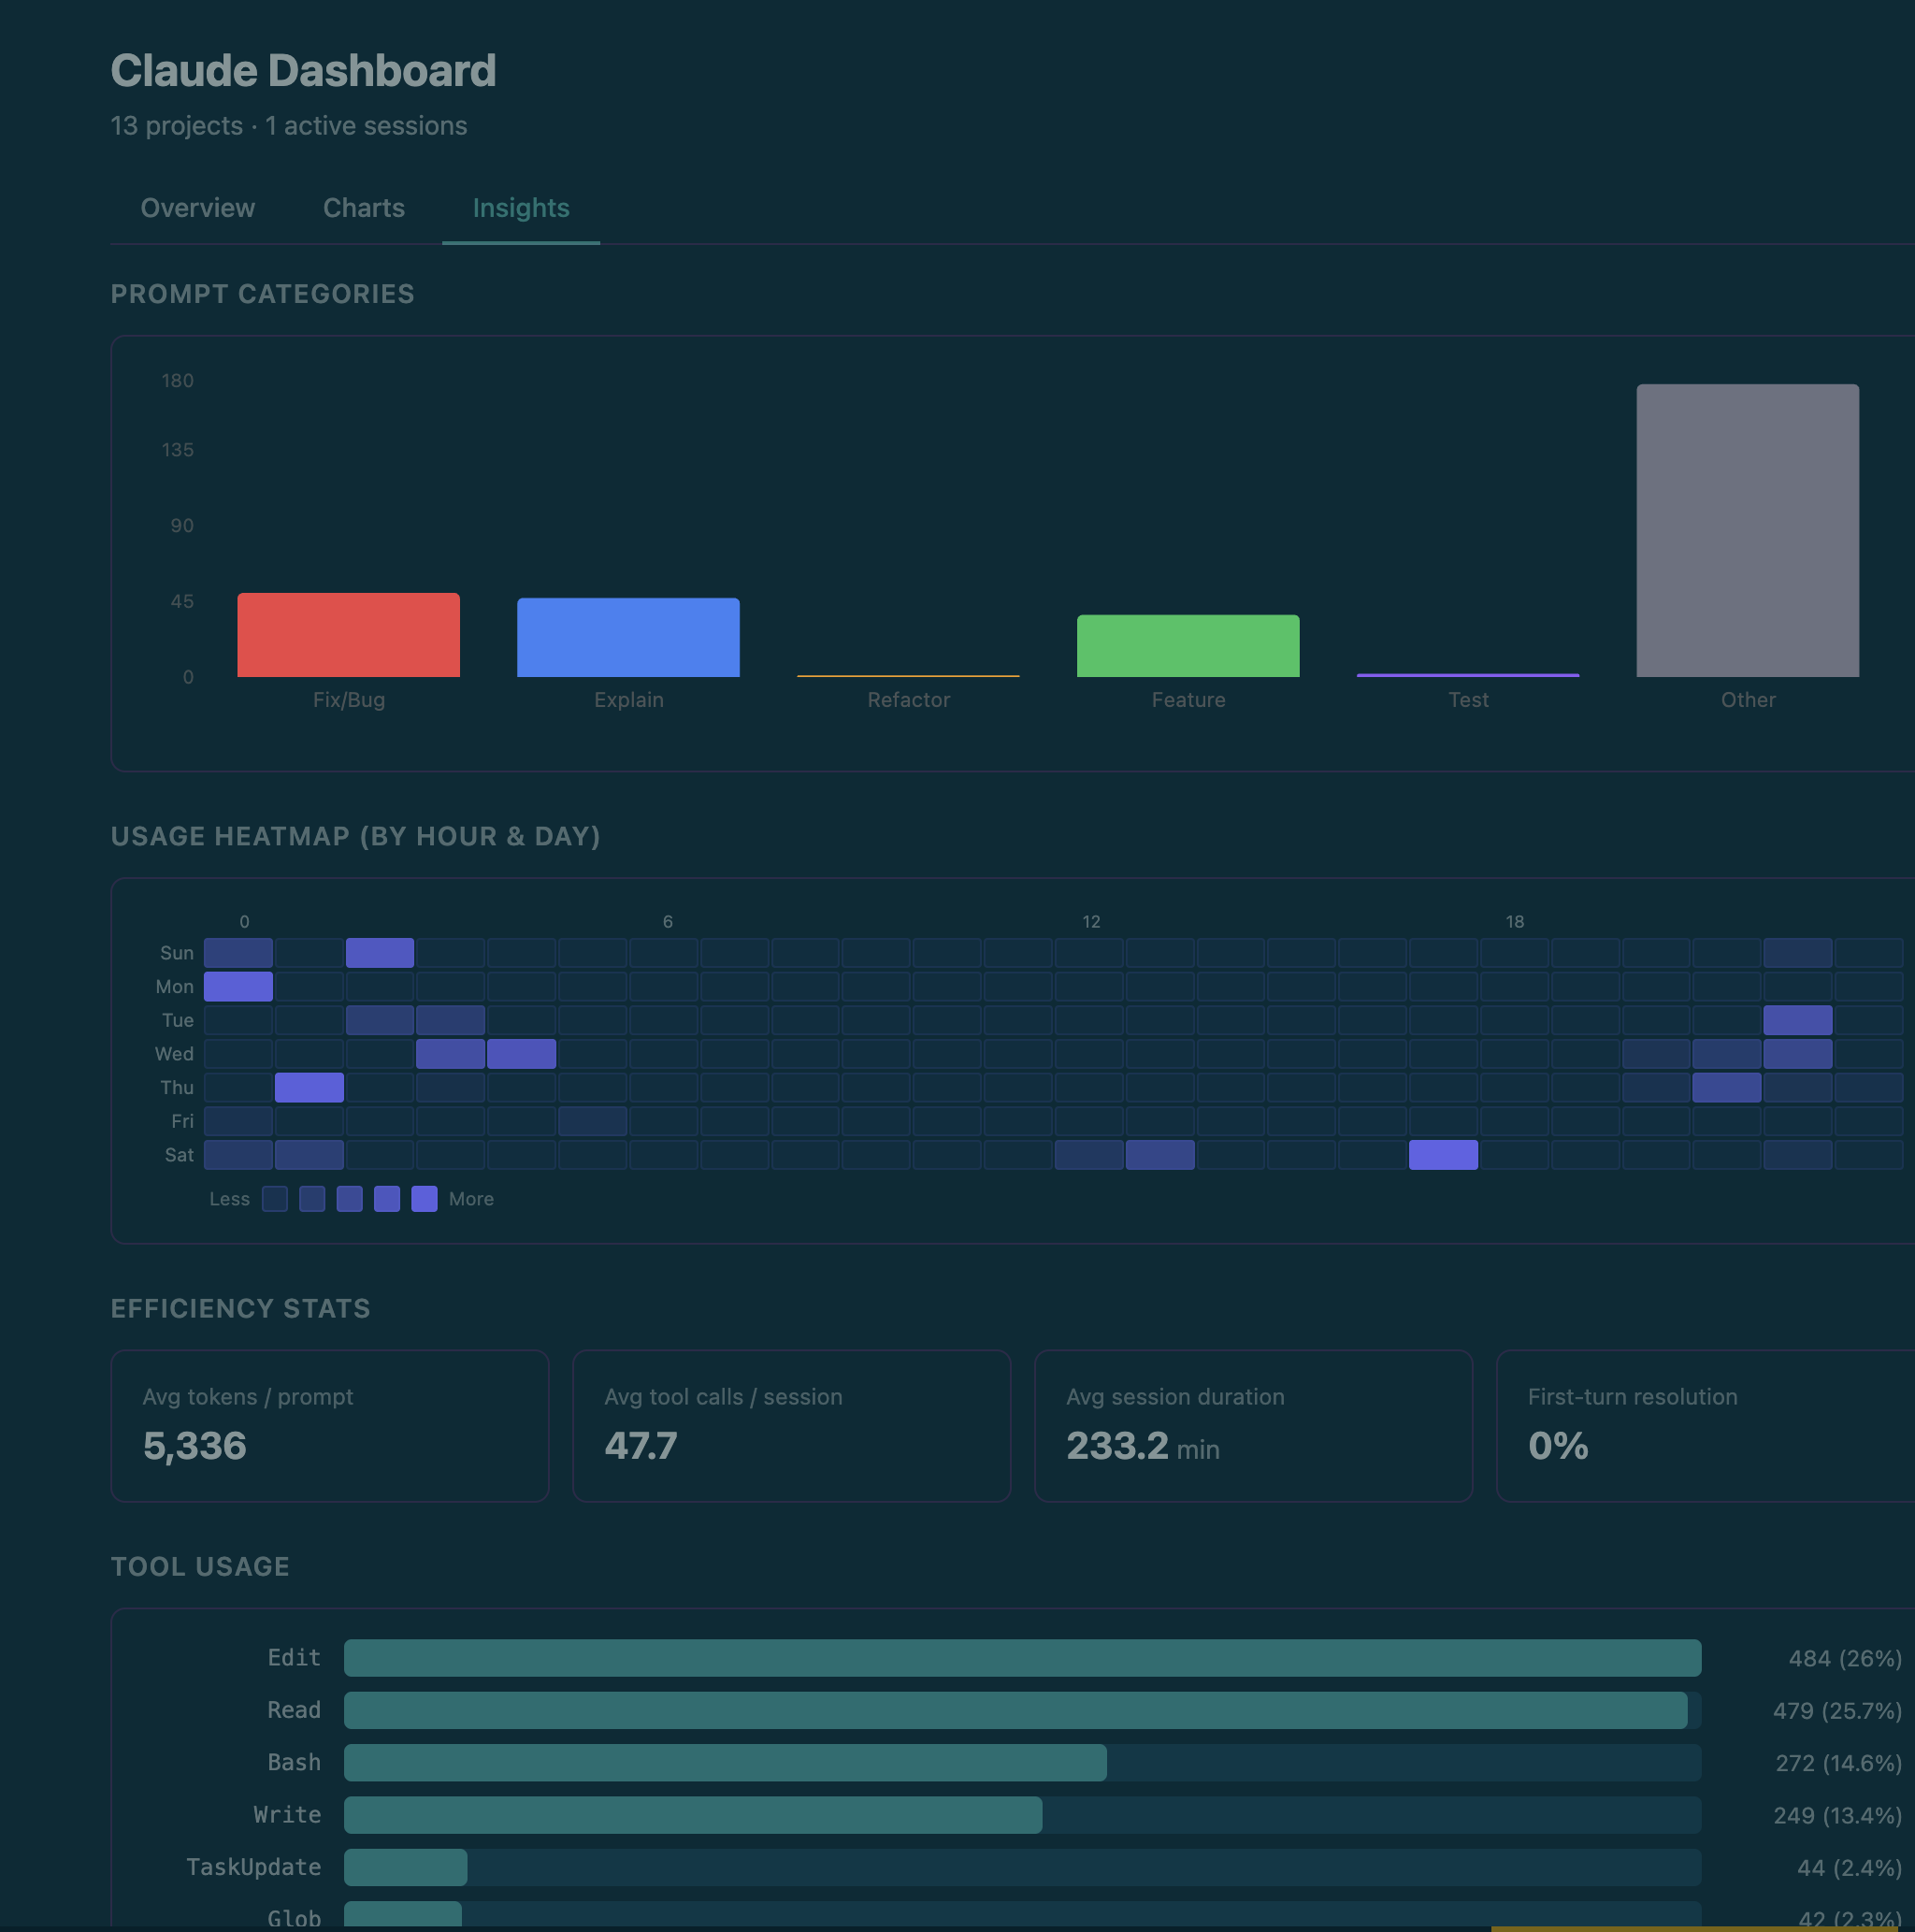 Insights tab — heatmap, tool usage, productivity by hour, hot files
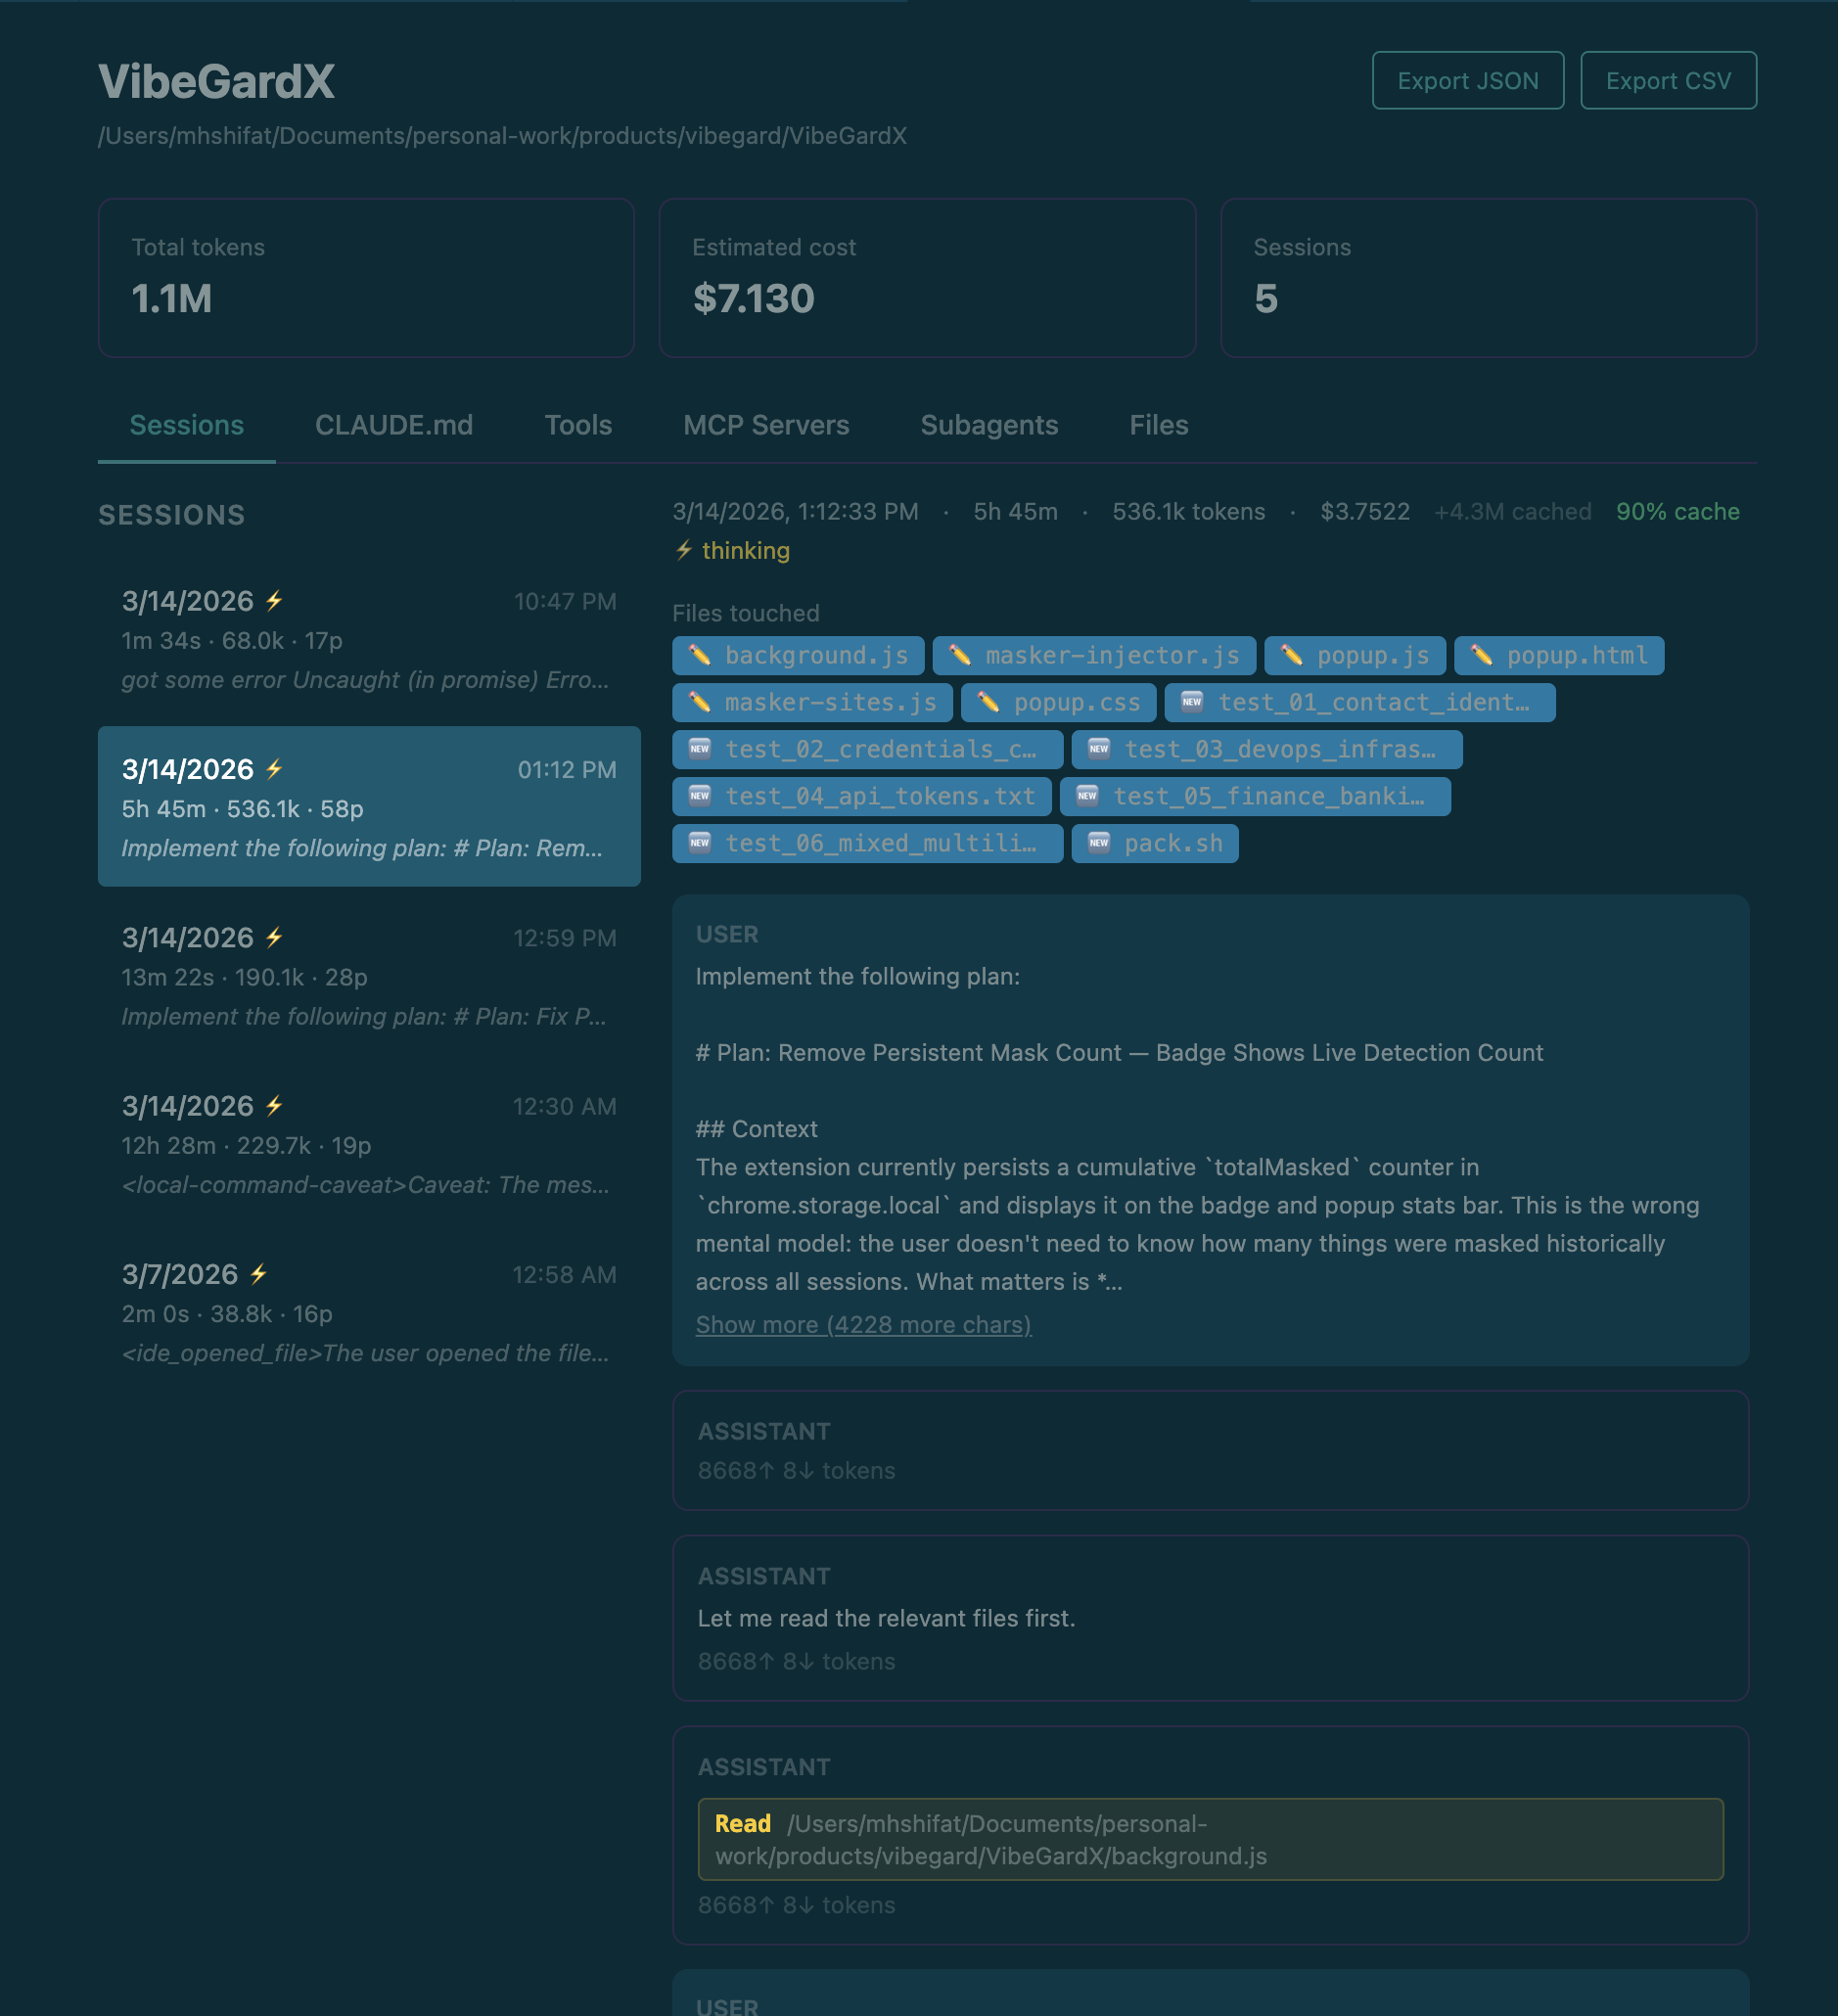 Project detail — session history with prompt previews and token breakdown
Installation
Search for Claude Code Dashboard in the VS Code Extensions panel, or install directly:
Requirements: VS Code 1.85+ and Claude Code installed and used at least once.
Getting started
- Click the pulse icon in the VS Code activity bar to open the Claude Projects sidebar.
- The full dashboard opens automatically to the right.
- On first run you'll be prompted to enable real-time hooks — choose "Yes, configure hooks" for live session tracking. A backup of
~/.claude/settings.json is made first.
Skipping hooks is fine — the dashboard still shows all historical data. You only lose the live "Claude is running" indicator.
What's inside
| Tab |
What you see |
| Overview |
Weekly recap, today's tokens & estimated cost, active sessions, full project list |
| Charts |
30-day token trend, usage by project, projected monthly estimated cost |
| Search |
Full-text search across every prompt you've ever sent to Claude |
| Insights |
Usage heatmap, tool breakdown, productivity by hour, hot files |
Project detail view — click any project to see its full session history, turn-by-turn conversation, token breakdown, estimated cost, files touched, CLAUDE.md, and MCP servers. Export to JSON or CSV any time.
Token and cost notes
- Token counts come from local Claude session logs in
~/.claude/projects/.
- Displayed
totalTokens exclude cache-read tokens, which Claude may reuse heavily across long sessions.
- Cost is a local estimate based on detected model family, a static pricing table, and parsed token usage.
- Aggregate cost views include subagent-attributed cost when Claude spawns subagents.
- Estimated cost may differ from Anthropic billing, invoices, or future pricing changes.
Configuration
Search for Claude Code Dashboard in VS Code settings (Cmd+, / Ctrl+,).
| Setting |
Default |
Description |
claudeDashboard.monthlyTokenBudget |
0 |
Monthly token cap. Set to 0 to disable. |
claudeDashboard.monthlyBudgetUsd |
0 |
Monthly estimated cost cap in USD. Alerts at 80% and 100%. Set to 0 to disable. |
Troubleshooting
No projects showing
— Verify ~/.claude/projects/ exists, then run Claude Code Dashboard: Refresh from the command palette. Check the Output panel (select "Claude Code Dashboard") for errors.
Sessions not updating in real time
— Confirm hooks were configured at first run. Check ~/.claude/settings.json for entries referencing .dashboard-events.jsonl. The file watcher fallback still updates within ~300ms.
Cost numbers look off
— Cost is estimated locally from parsed token usage, detected model family, and a static pricing table. Cache read tokens are tracked separately and excluded from totalTokens, but still contribute to estimated cost.
Corrupted settings.json after hook injection
— Restore the backup: cp ~/.claude/settings.json.bak ~/.claude/settings.json
Data privacy
The extension only reads files in ~/.claude/ and your project directories. No network requests. No telemetry. The only files it ever writes are:
~/.claude/settings.json — hook config (with your consent; backup made first)~/.claude/.dashboard-events.jsonl — live events from the injected hooks~/.claude/settings.json.bak — backup before hook injection
Contributing
Contributions are welcome! Please read the Contributing guide before opening a PR.
See SECURITY.md for how to report vulnerabilities privately.
Changelog
See CHANGELOG.md for the full version history.
License
AGPL-3.0 — free to use and modify, but any modified version must also be released under the same license. Commercial reselling is not permitted.
