Python Debug Plotter: Arrays, Tensors & GraphsDebug and plot NumPy arrays, PyTorch tensors, images, and NetworkX graphs instantly. Lightweight & dependency-free. Installation Launch VS Code Quick Open ( Ctrl+P), paste the following command, and press enter.Copied to clipboard |

Python Debug PlotterVisualize NumPy, PyTorch, and Graphs while debugging — no extra dependencies required.
Features • Usage • Supported Variable Types FeaturesView 2D single and three channel arrays as images, Nx2 and Nx3 arrays as point clouds, networkx graphs as interactive 3D plots and 1D arrays as histograms.
You can explore any ND array or tensor by first creating one of the primitives above in the debug console. A Bx3xHxW tensor can be shown by first typing
The visualization is automatically updated while steping through the code.
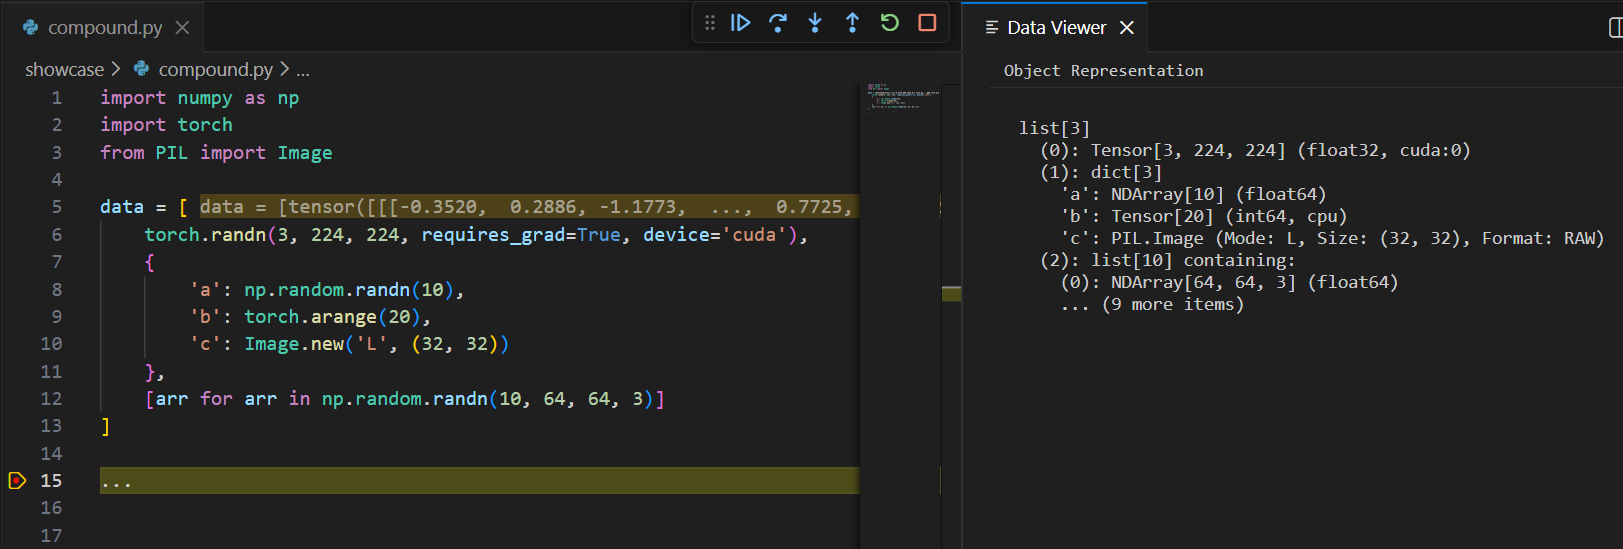
Compound data that cannot be plotted is printed with rich information. For instance, a list with a torch tensor on the GPU, a dictionary with an array, a tensor and a pillow image and a list of 10 arrays is shown as
Requirements
Usage
Supported Variable TypesThe extension uses a smart heuristic to automatically detect the best visualization for your data.
Change LogSee CHANGELOG.md for full release history. |