
Runtime DevTools for React, Next.js, Angular and Vue — opens in your browser, wired to VS Code.
Browser DevTools show you the DOM. Inspectro shows you the components: which
one rendered this element, where it lives in your source, what props it was
given, which of them just changed, and what it is holding in state. Plus real
breakpoints in server-side code, which the browser cannot reach at all.
See it
|
|
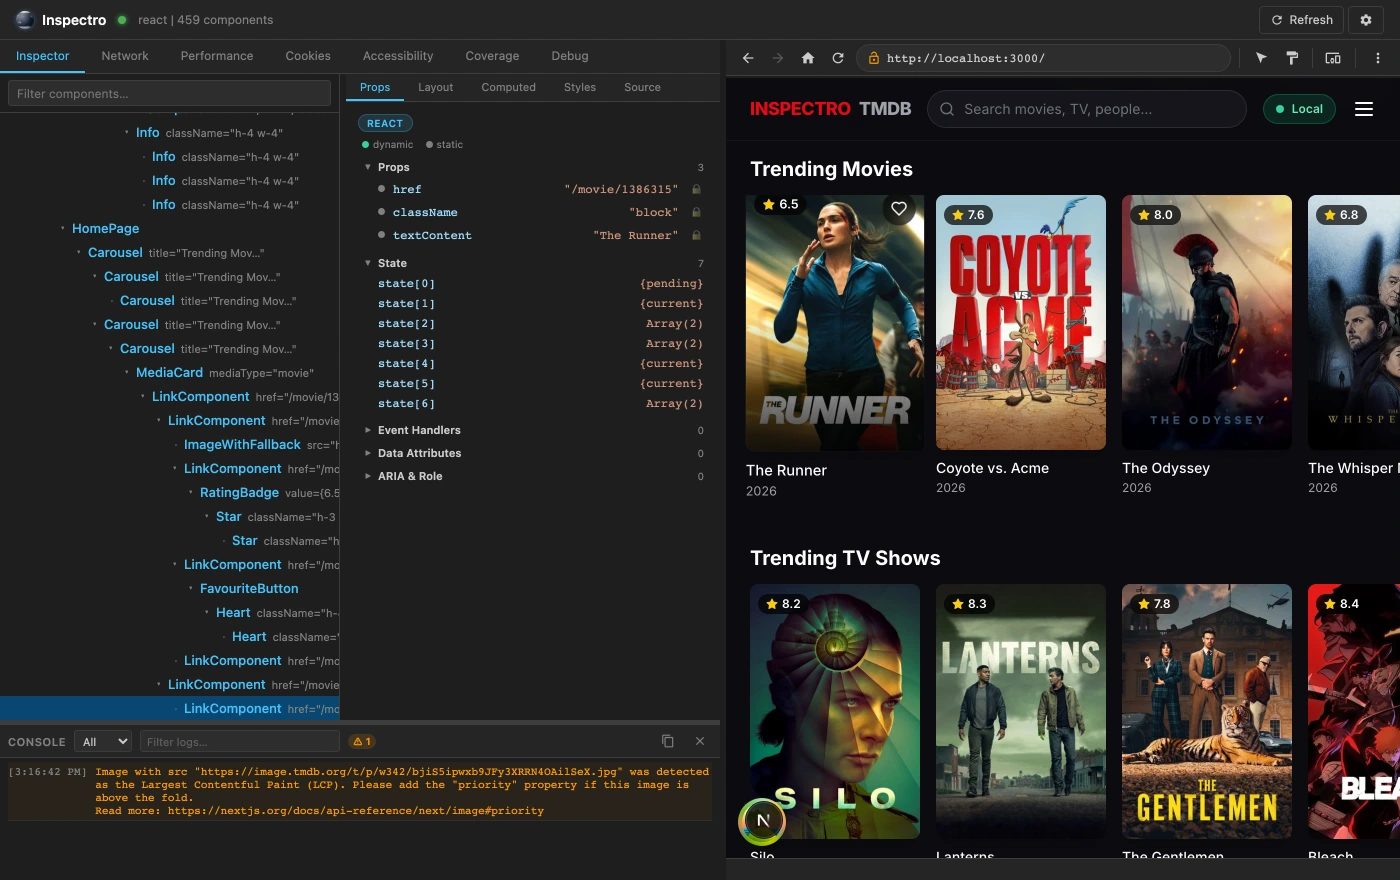
| Inspector — component tree, live props, highlighted preview |
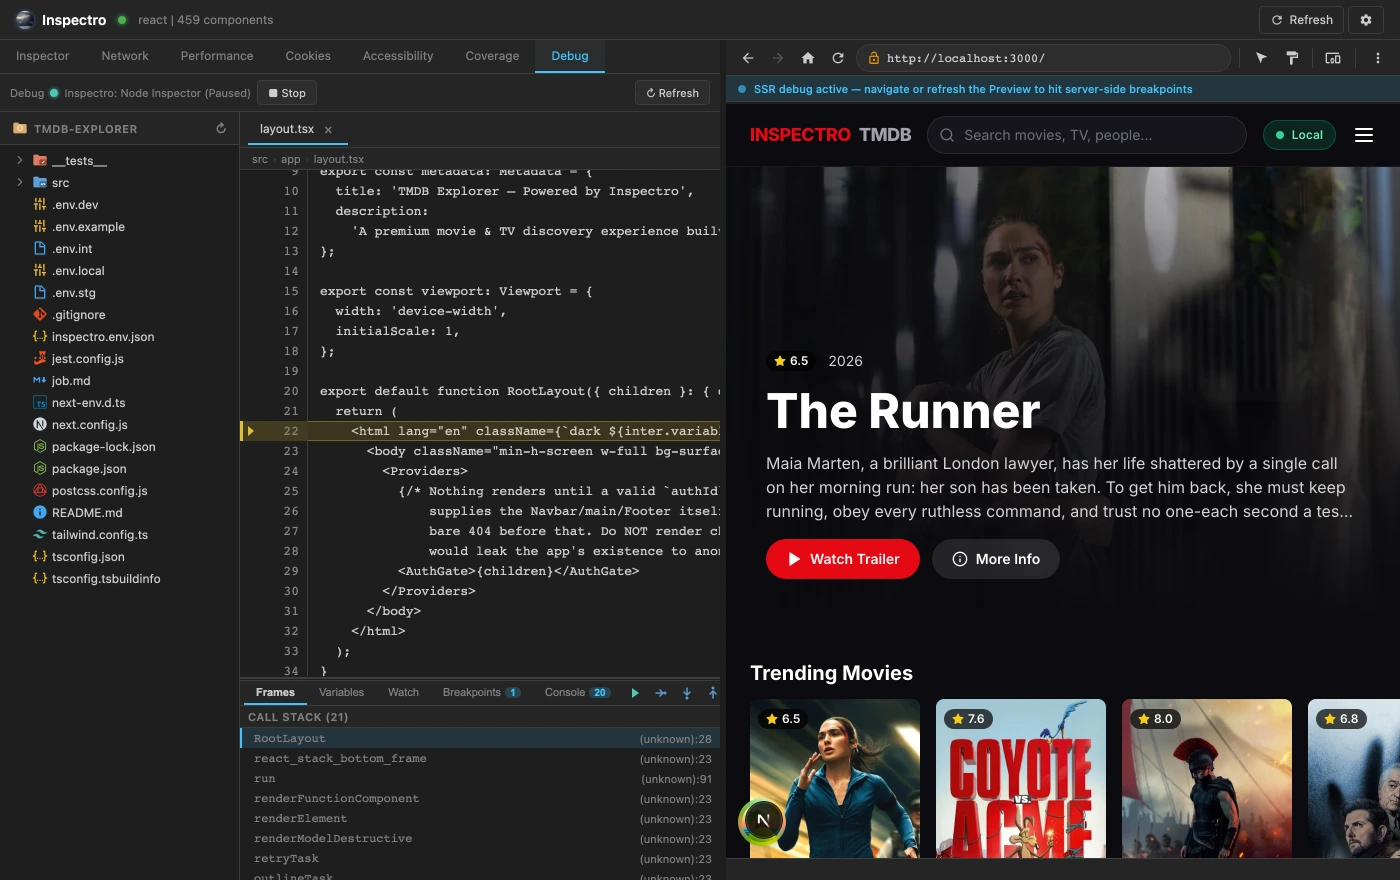
SSR debugging — real breakpoints in server-side code |
 |
 |
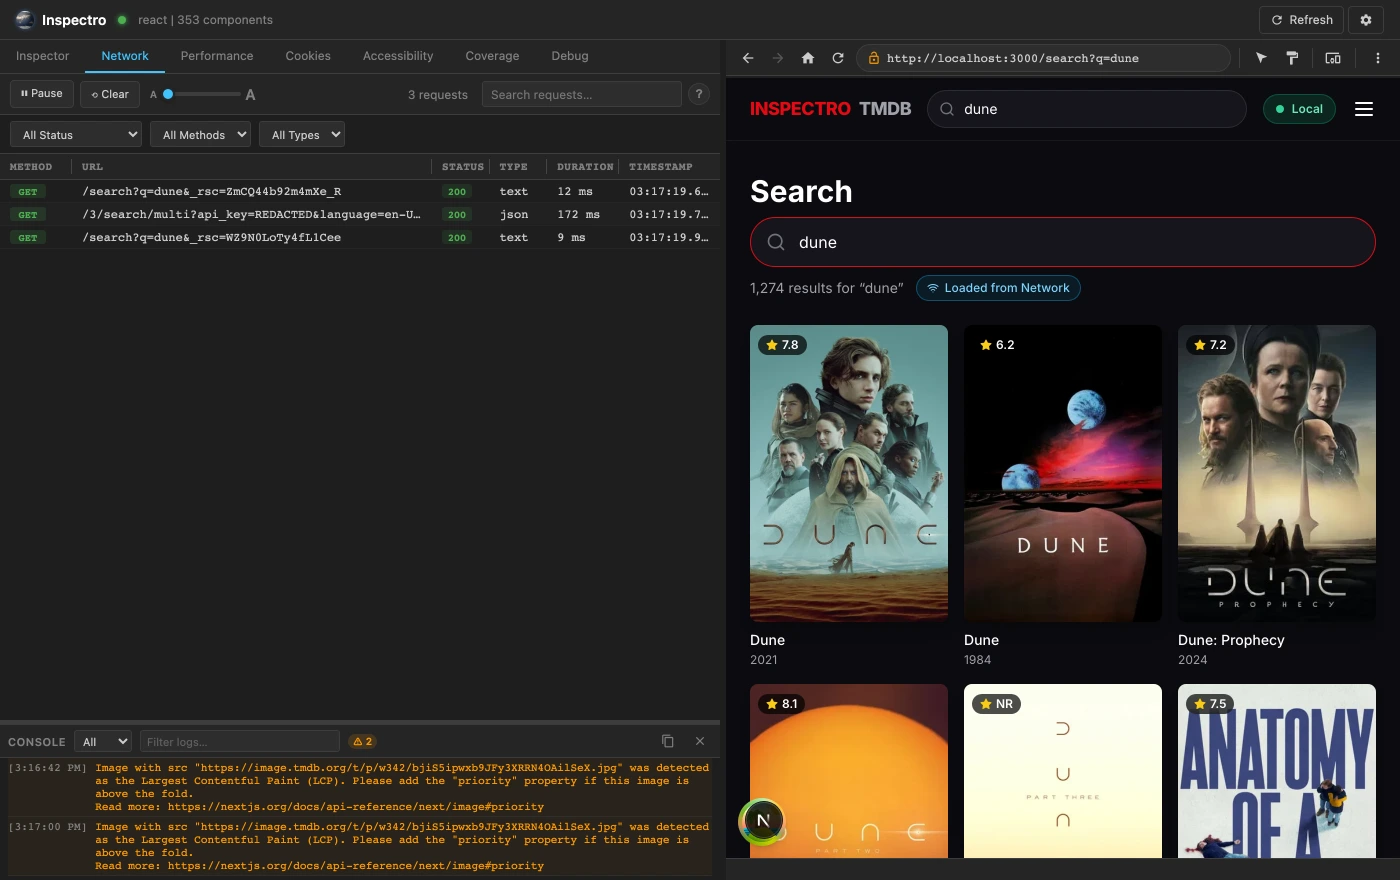
| Network — every fetch and XHR, with bodies and timing |
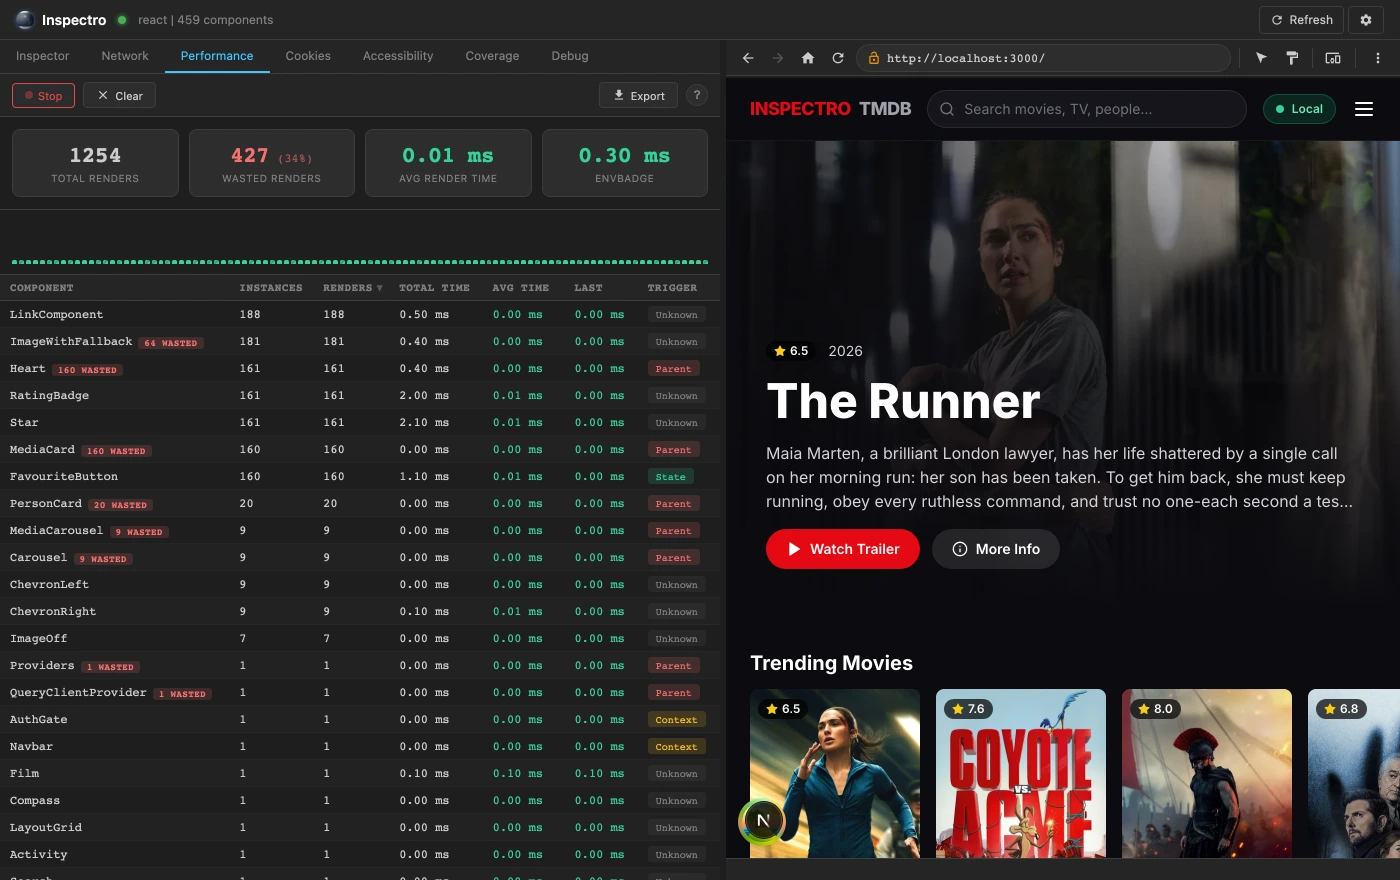
Performance — render counts, timings and wasted renders |
 |
 |
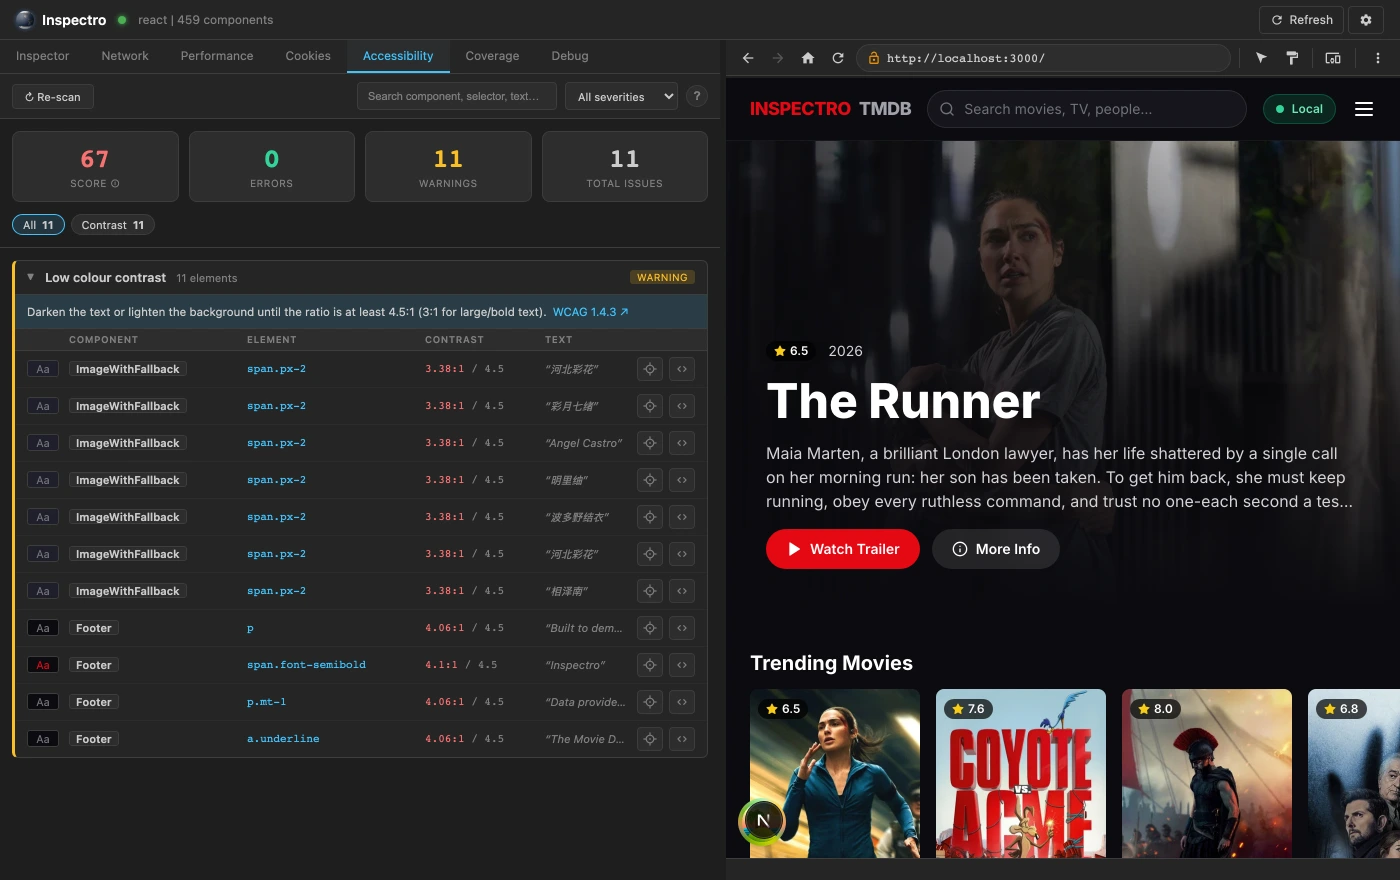
| Accessibility — contrast, ARIA, labels, heading order |
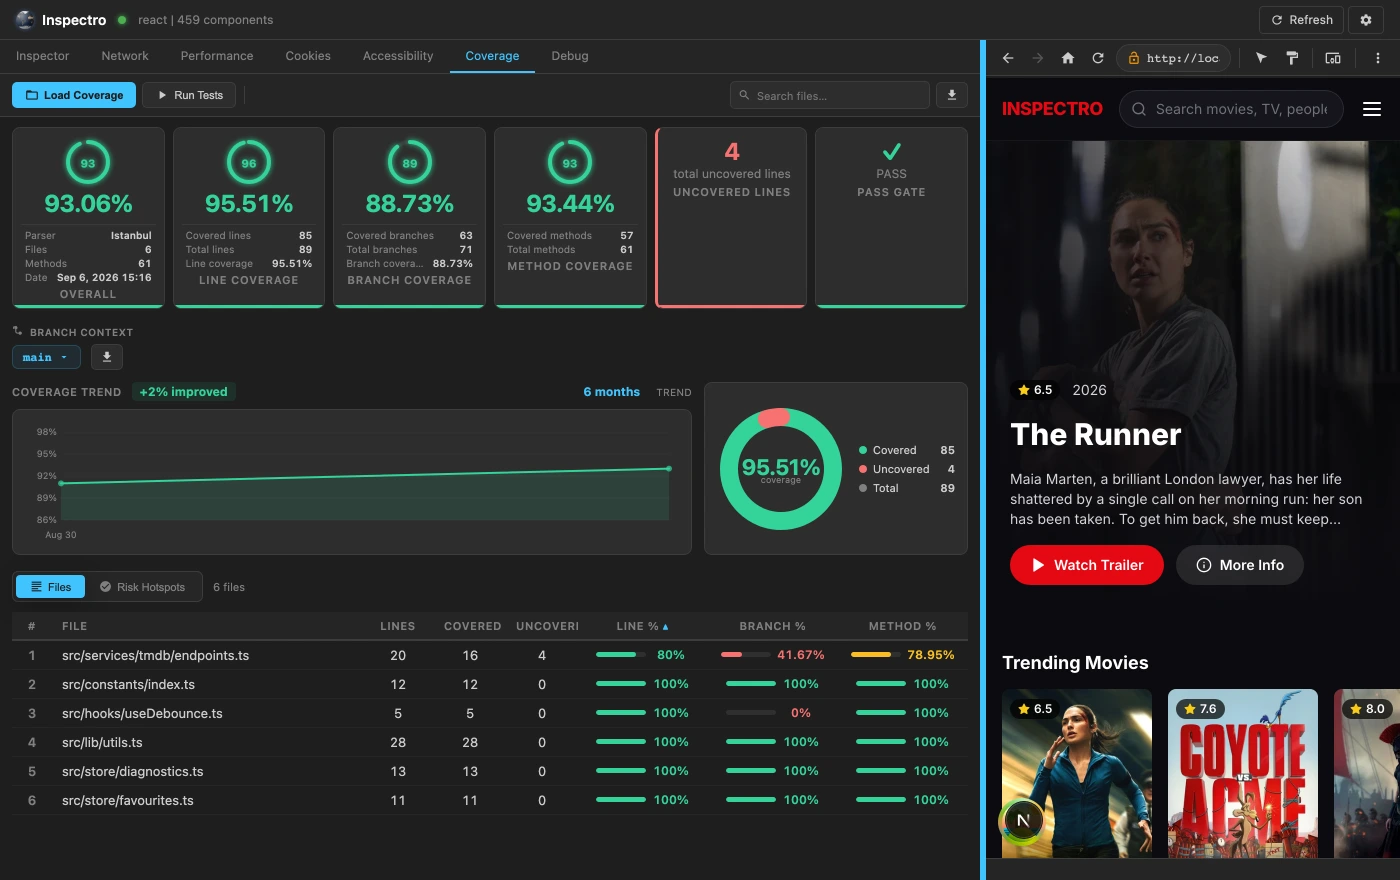
Coverage — per-file line, branch and function metrics |
 |
 |
Six panels, one table. Debug paint, the layout inspector, cookies,
the console and the embedded preview are easier to see than to describe
— install it and point it at your own app.
What you get
Find your way around a running app
- Component tree in the Inspector tab, live. Click a node to open its file
in VS Code. Selecting an element in your app reveals it in the tree, and the
reverse.
- Click-to-source. Point at anything in your app and open the code that
rendered it.
Ctrl+right-click opens a deeper inspection menu.
- Hover inspector. Tag, size, colour, font and spacing, like the browser —
then the part the browser cannot know: the component's file and line, its
props, which props changed on the last render, its state and its handlers.
React state is labelled with your own variable names, read from your source.
- Debug paint. Every component the framework owns, outlined and measured at
once, so the structure of a page is visible without clicking through it.
Change things and see the result
- Live prop editing for strings, numbers and booleans — applied immediately,
no save, no reload.
- Layout inspector — the box model with live computed values:
display,
position, flex and grid tracks, z-index and the rest.
- Embedded preview with its own navigation, so the app and the tools sit
side by side in one window.
Catch what you would otherwise miss
- Accessibility dashboard — contrast, alt text, ARIA, form labels, heading
order and document language, scored, with findings pushed to VS Code's
Problems panel.
- Performance profiling — render counts, total and average render time, and
renders that changed nothing.
- Network inspector — every
fetch and XMLHttpRequest, with headers,
bodies, status and timing.
- Code coverage — Istanbul, LCOV and Cobertura, per file and per folder,
with git branch awareness.
- Cookies and console — read and edit cookies; dev-server output and browser
console.* in one place.
Debug the server, not just the browser
- SSR debugging. Real breakpoints in server-side code over the Node inspect
port. Browser DevTools cannot attach there, so
'use client' boundaries,
loaders and server components stay opaque to them.
Supported frameworks
| Framework |
Version |
| React |
16+ |
| Next.js |
13+ (App and Pages Router), including SSR execution |
| Angular |
17+, including signals |
| Vue |
2 and 3 |
Detection is automatic. There is nothing to configure.
Getting started
- Install from the Marketplace,
or run
code --install-extension hemasai.inspectro.
- Sign in, or create a free account, from the Inspectro panel in the activity
bar. An account is required — Open DevTools and Run Dev Server ask
you to sign in before they do anything.
- Open a React, Next.js, Angular or Vue project.
- Start your dev server as usual — Inspectro detects it.
- The status bar turns green and shows your framework and component count.
Click it, or run Inspectro: Open DevTools.
Requirements: VS Code 1.85+, a running dev server, and a Chromium browser
for the DevTools panel and browser debug runtime. Click-to-source and SSR
debugging work in VS Code itself; the DevTools UI opens in your browser.
Commands
| Command |
What it does |
| Inspectro: Open DevTools |
Open the DevTools panel |
| Inspectro: Run Dev Server |
Detect and start your project's dev server |
| Inspectro: Toggle Debug Paint |
Show or hide component outlines |
| Inspectro: Toggle Select Component Mode |
Click-to-inspect in the browser |
| Inspectro: Refresh Component Tree |
Force a re-scan |
| Inspectro: Go to Source |
Open the selected component's file |
| Inspectro: Sign In / Create Free Account |
Account access |
Settings
| Setting |
Default |
What it does |
inspectro.debug.runtime |
node |
Which runtime the Debug tab attaches to: node for server-side code, browser for client-side, dual for both |
inspectro.debugPort |
9222 |
Chrome remote-debugging port |
inspectro.freshCookiesPerProject |
true |
Start each session with a clean cookie jar |
inspectro.proxyPort / inspectro.wsPort |
0 |
Pin the proxy or WebSocket port (0 = automatic) |
inspectro.telemetry.enabled |
true |
Anonymous usage analytics — see below |
Further advanced settings (verbose debug logging, extra debug-explorer
directories, telemetry endpoint overrides) are listed in the Settings UI under
Inspectro.
Security and privacy
Inspectro runs a local proxy in front of your dev server and injects an agent
script into your running app, so it is fair to ask what it touches.
Everything stays on your machine.
- The WebSocket server binds to
127.0.0.1 only. It is not reachable from your
network.
- Every connection must present the current session's token, so a tab left open
from an earlier run cannot reattach.
- Only
localhost, 127.0.0.1 and ::1 origins are accepted — an external
page is refused even if it somehow learned the token.
- The agent is injected only into responses from the dev server Inspectro is
proxying. It never reaches a production site.
Your source is never transmitted. Files are read and edited locally through
VS Code. Nothing about your components, props, paths or network payloads is sent
anywhere.
Telemetry is anonymous, opt-out, and structurally limited. It is off unless
both VS Code's global telemetry setting and inspectro.telemetry.enabled are
on. Events pass an allow-list at their single exit point — booleans, finite
numbers and short token-like strings — and everything else is replaced with
[redacted]. A file path, component name, prop value or URL therefore cannot
be sent even by accident, because the filter permits rather than strips.
Full details: privacy policy. To report a
security issue, email support@inspectro.dev.
How it works
Inspectro starts a transparent HTTP proxy in front of your dev server and
injects a small agent script into the pages it serves. The agent talks to the
extension over a local WebSocket: it reads the framework's own component data,
draws the overlays, and applies your edits. For server-side debugging it
attaches directly to the dev server's Node inspect port, which is why
breakpoints work in code the browser never runs.
Inspectro adds nothing to your project on its own. Only the environment
switcher writes anything — inspectro.env.json and a self-ignoring
.inspectro/ folder at the workspace root — and those survive an uninstall, so
delete them yourself if you no longer want them. Live prop and style edits go
to your own source files, through VS Code, as you make them.
Author
Designed and built by Hema Sai Charan Kothamasu — inspectro.dev
License
Copyright (c) 2026 Hema Sai Charan Kothamasu. All rights reserved.
Inspectro is proprietary, commercially licensed software — not open source.
Installing it gives you a personal, non-exclusive, non-transferable right to
use Inspectro on your own development work. Redistributing, reselling,
sublicensing or reverse-engineering it is not permitted.
Full terms: inspectro.dev/terms. The complete
End User License Agreement ships as LICENSE.txt inside the extension and
appears on the Marketplace listing's License tab.

