HeapLens — Java & Android Heap Dump Analyzer
The fastest way to understand Java heap dumps — right inside VS Code.


Why HeapLens?
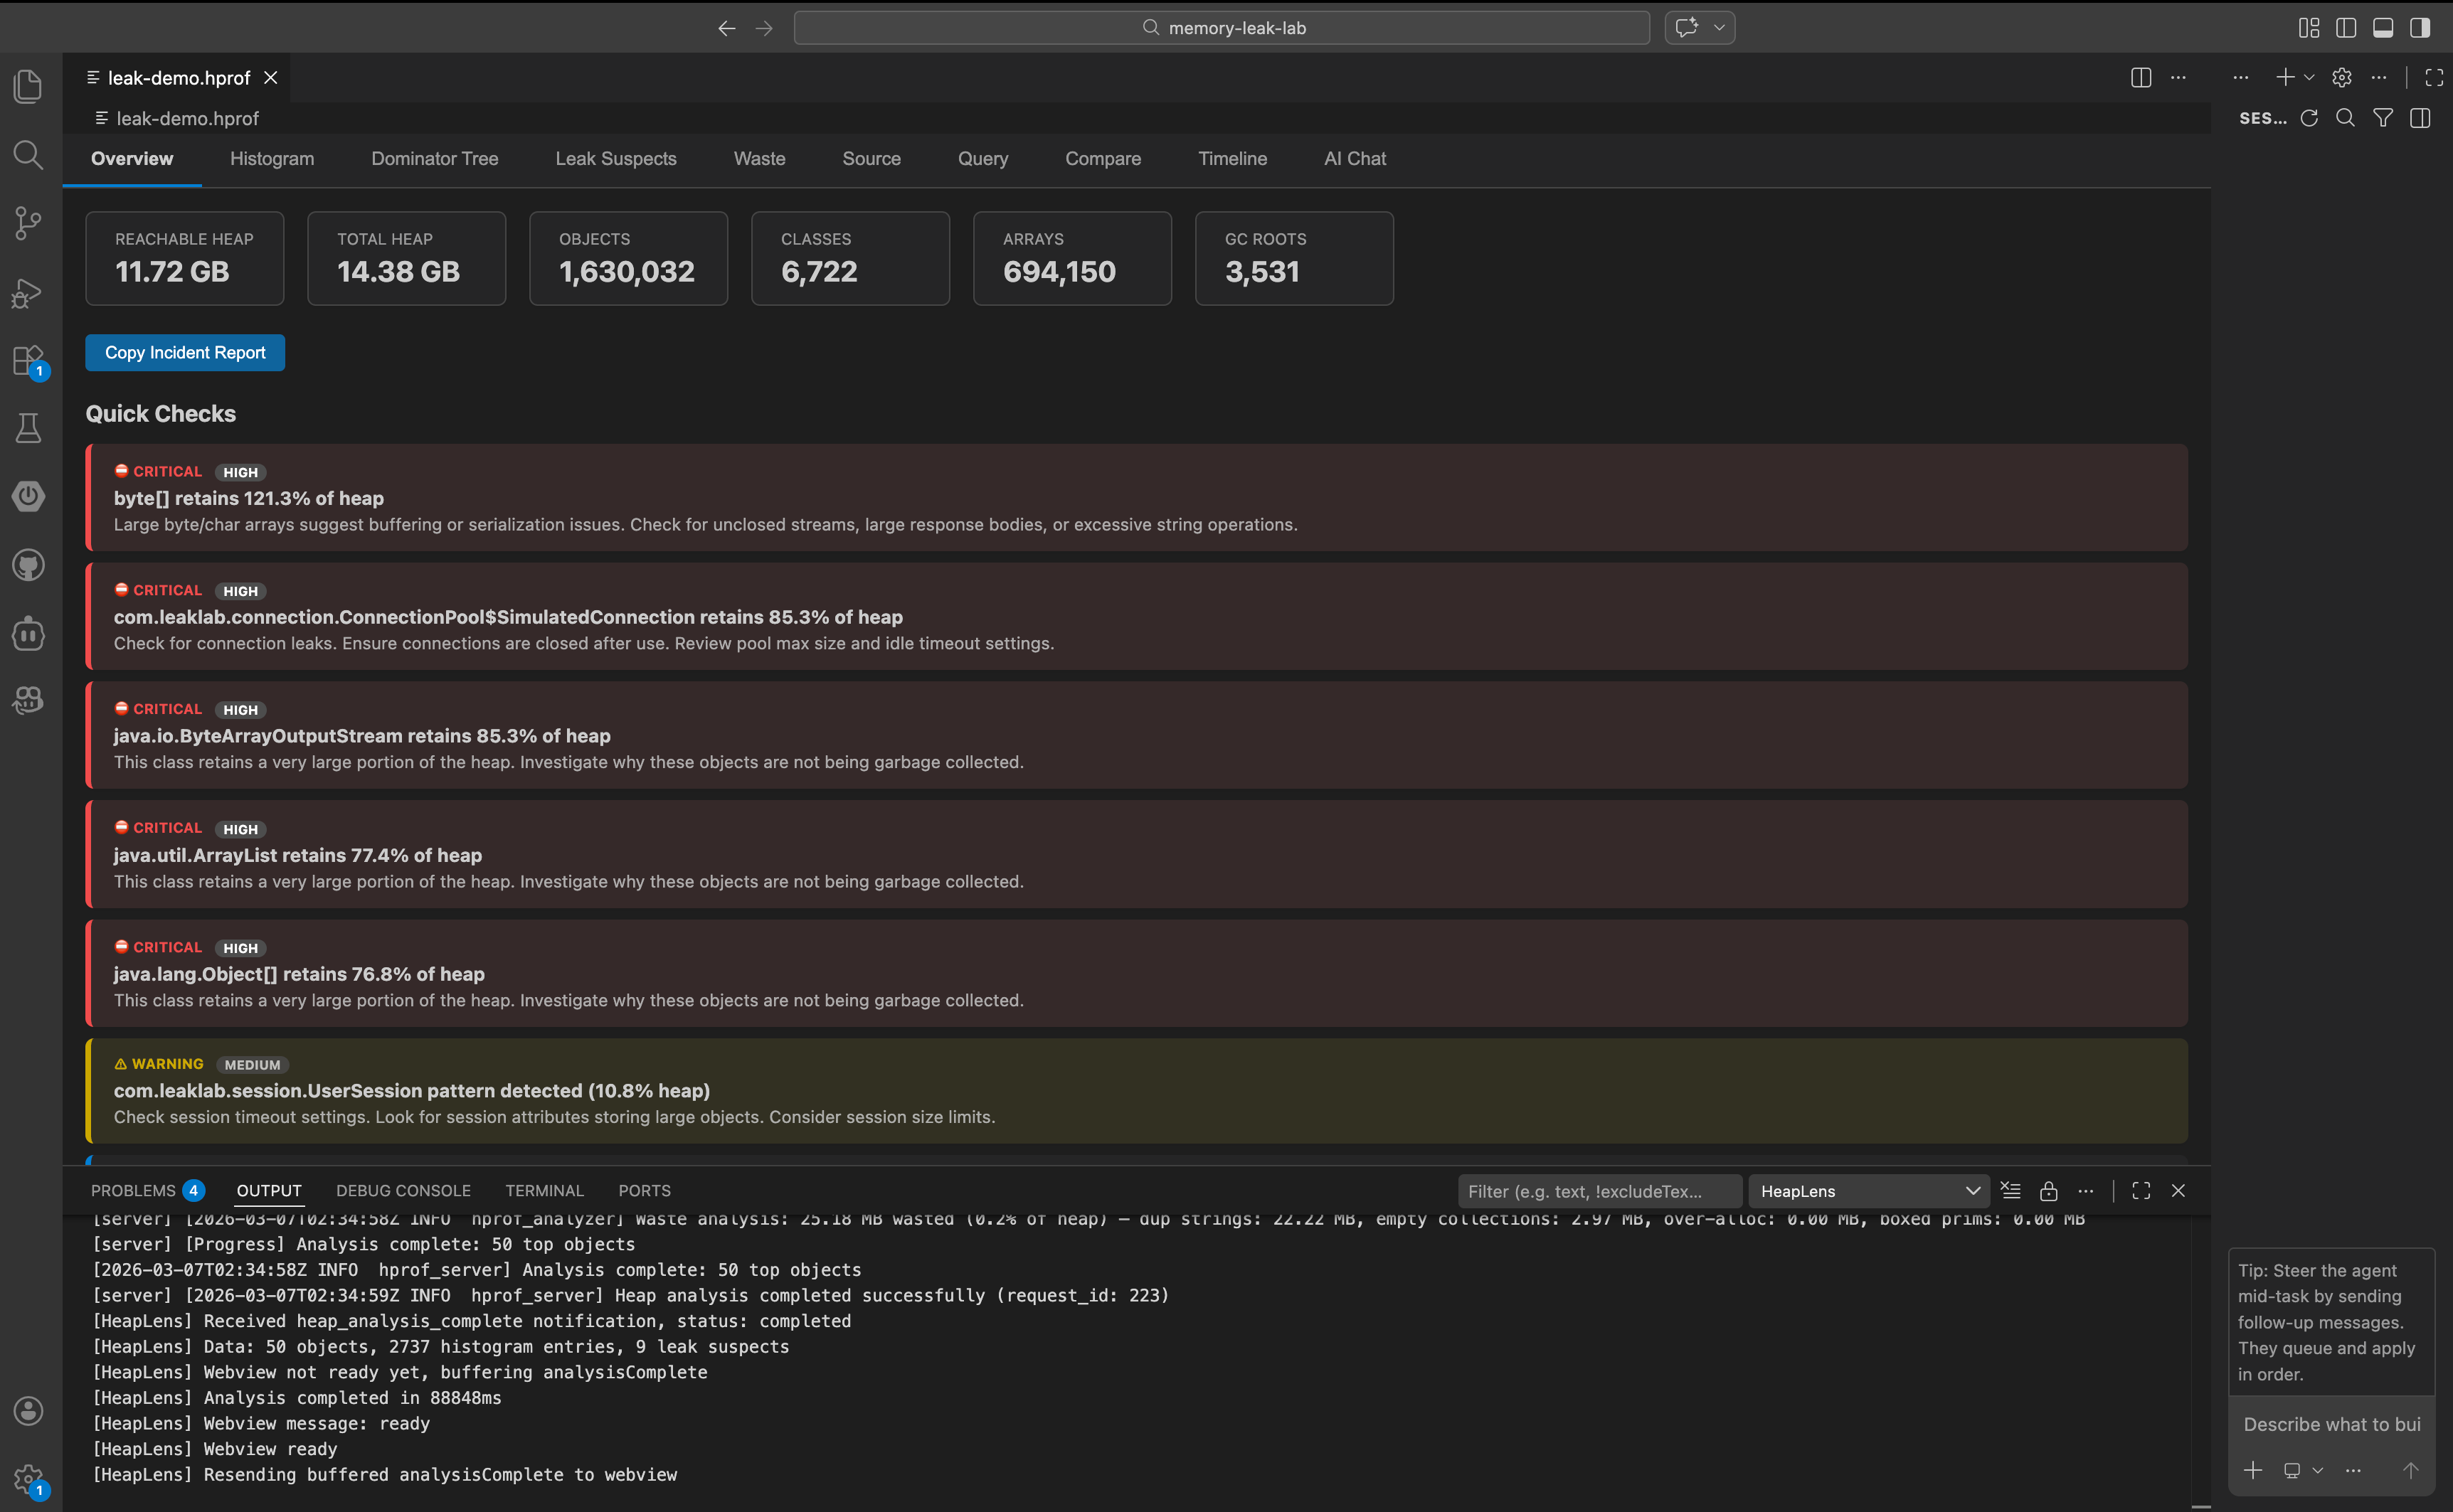
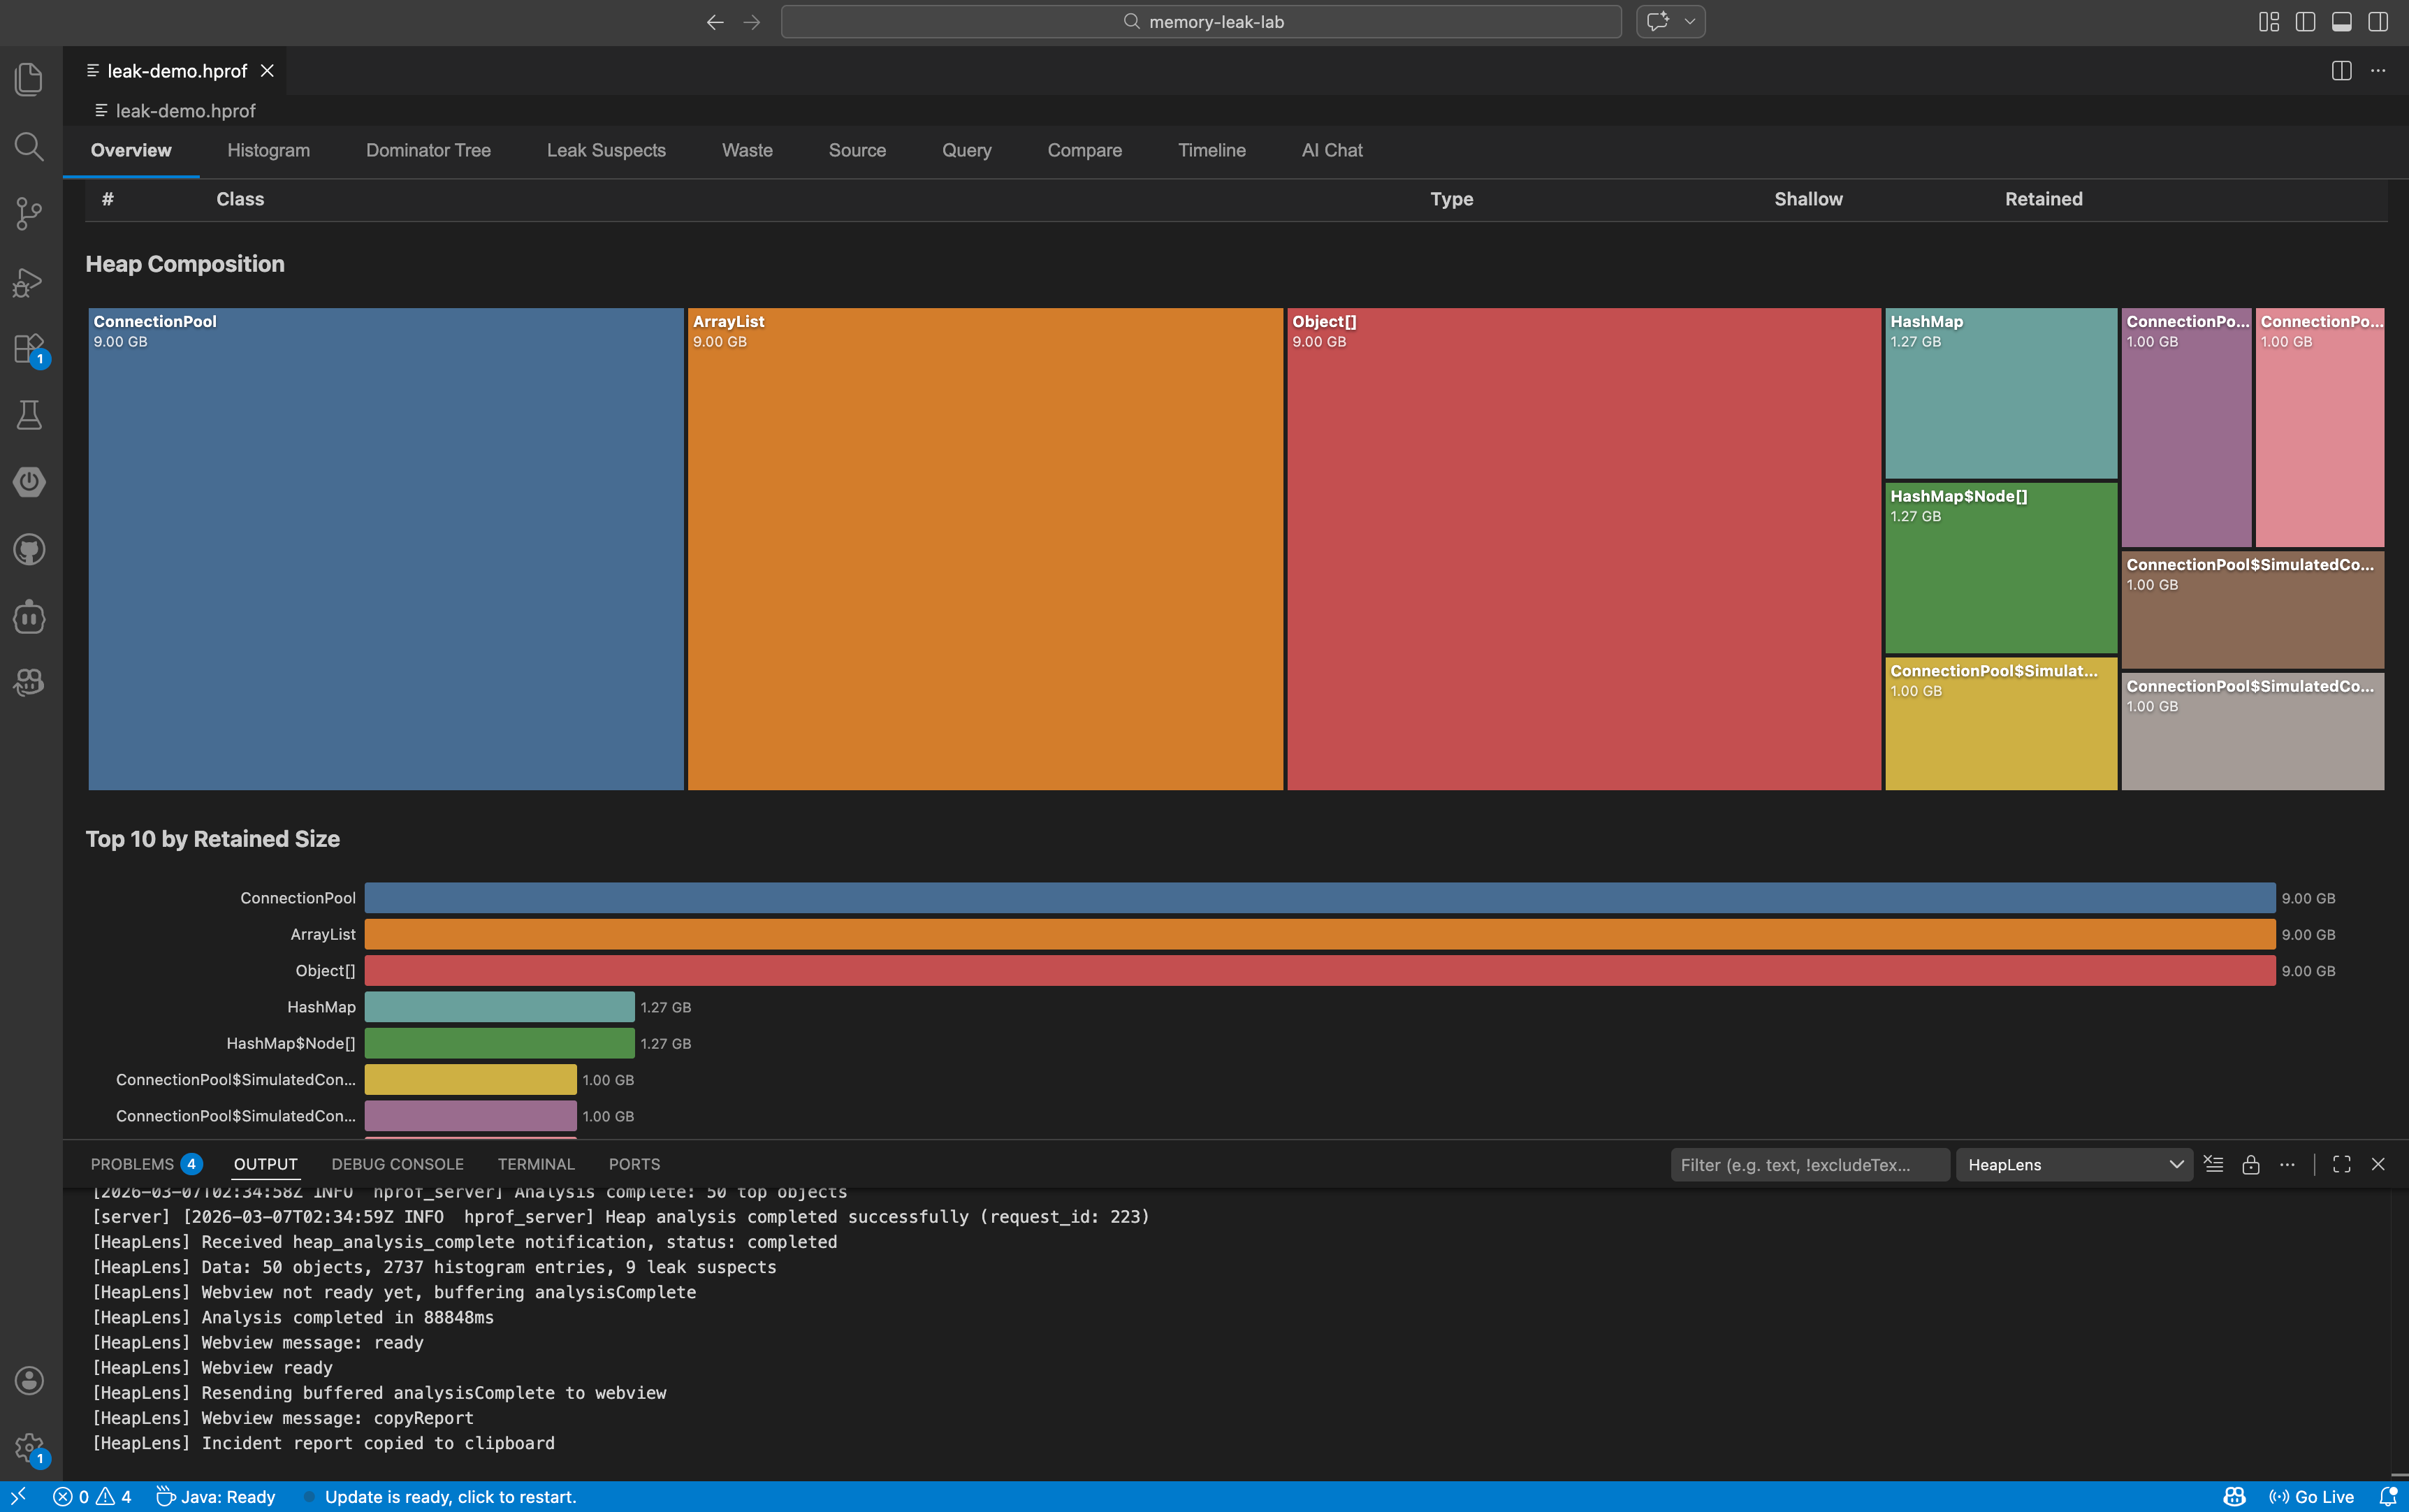
HeapLens brings Java and Android heap dump analysis into VS Code. Open any .hprof file and instantly explore memory usage through 10 interactive views — dominator trees, class histograms, leak suspects, waste detection, and more. No separate tools. No context switching. No uploading to cloud services.
HeapLens includes a built-in AI assistant that explains heap analysis findings in plain English and suggests code-level fixes. Ask questions like "Why is my app using 2 GB of memory?" or "What's causing this OutOfMemoryError?" and get actionable answers powered by your choice of 10 LLM providers including local models via Ollama.
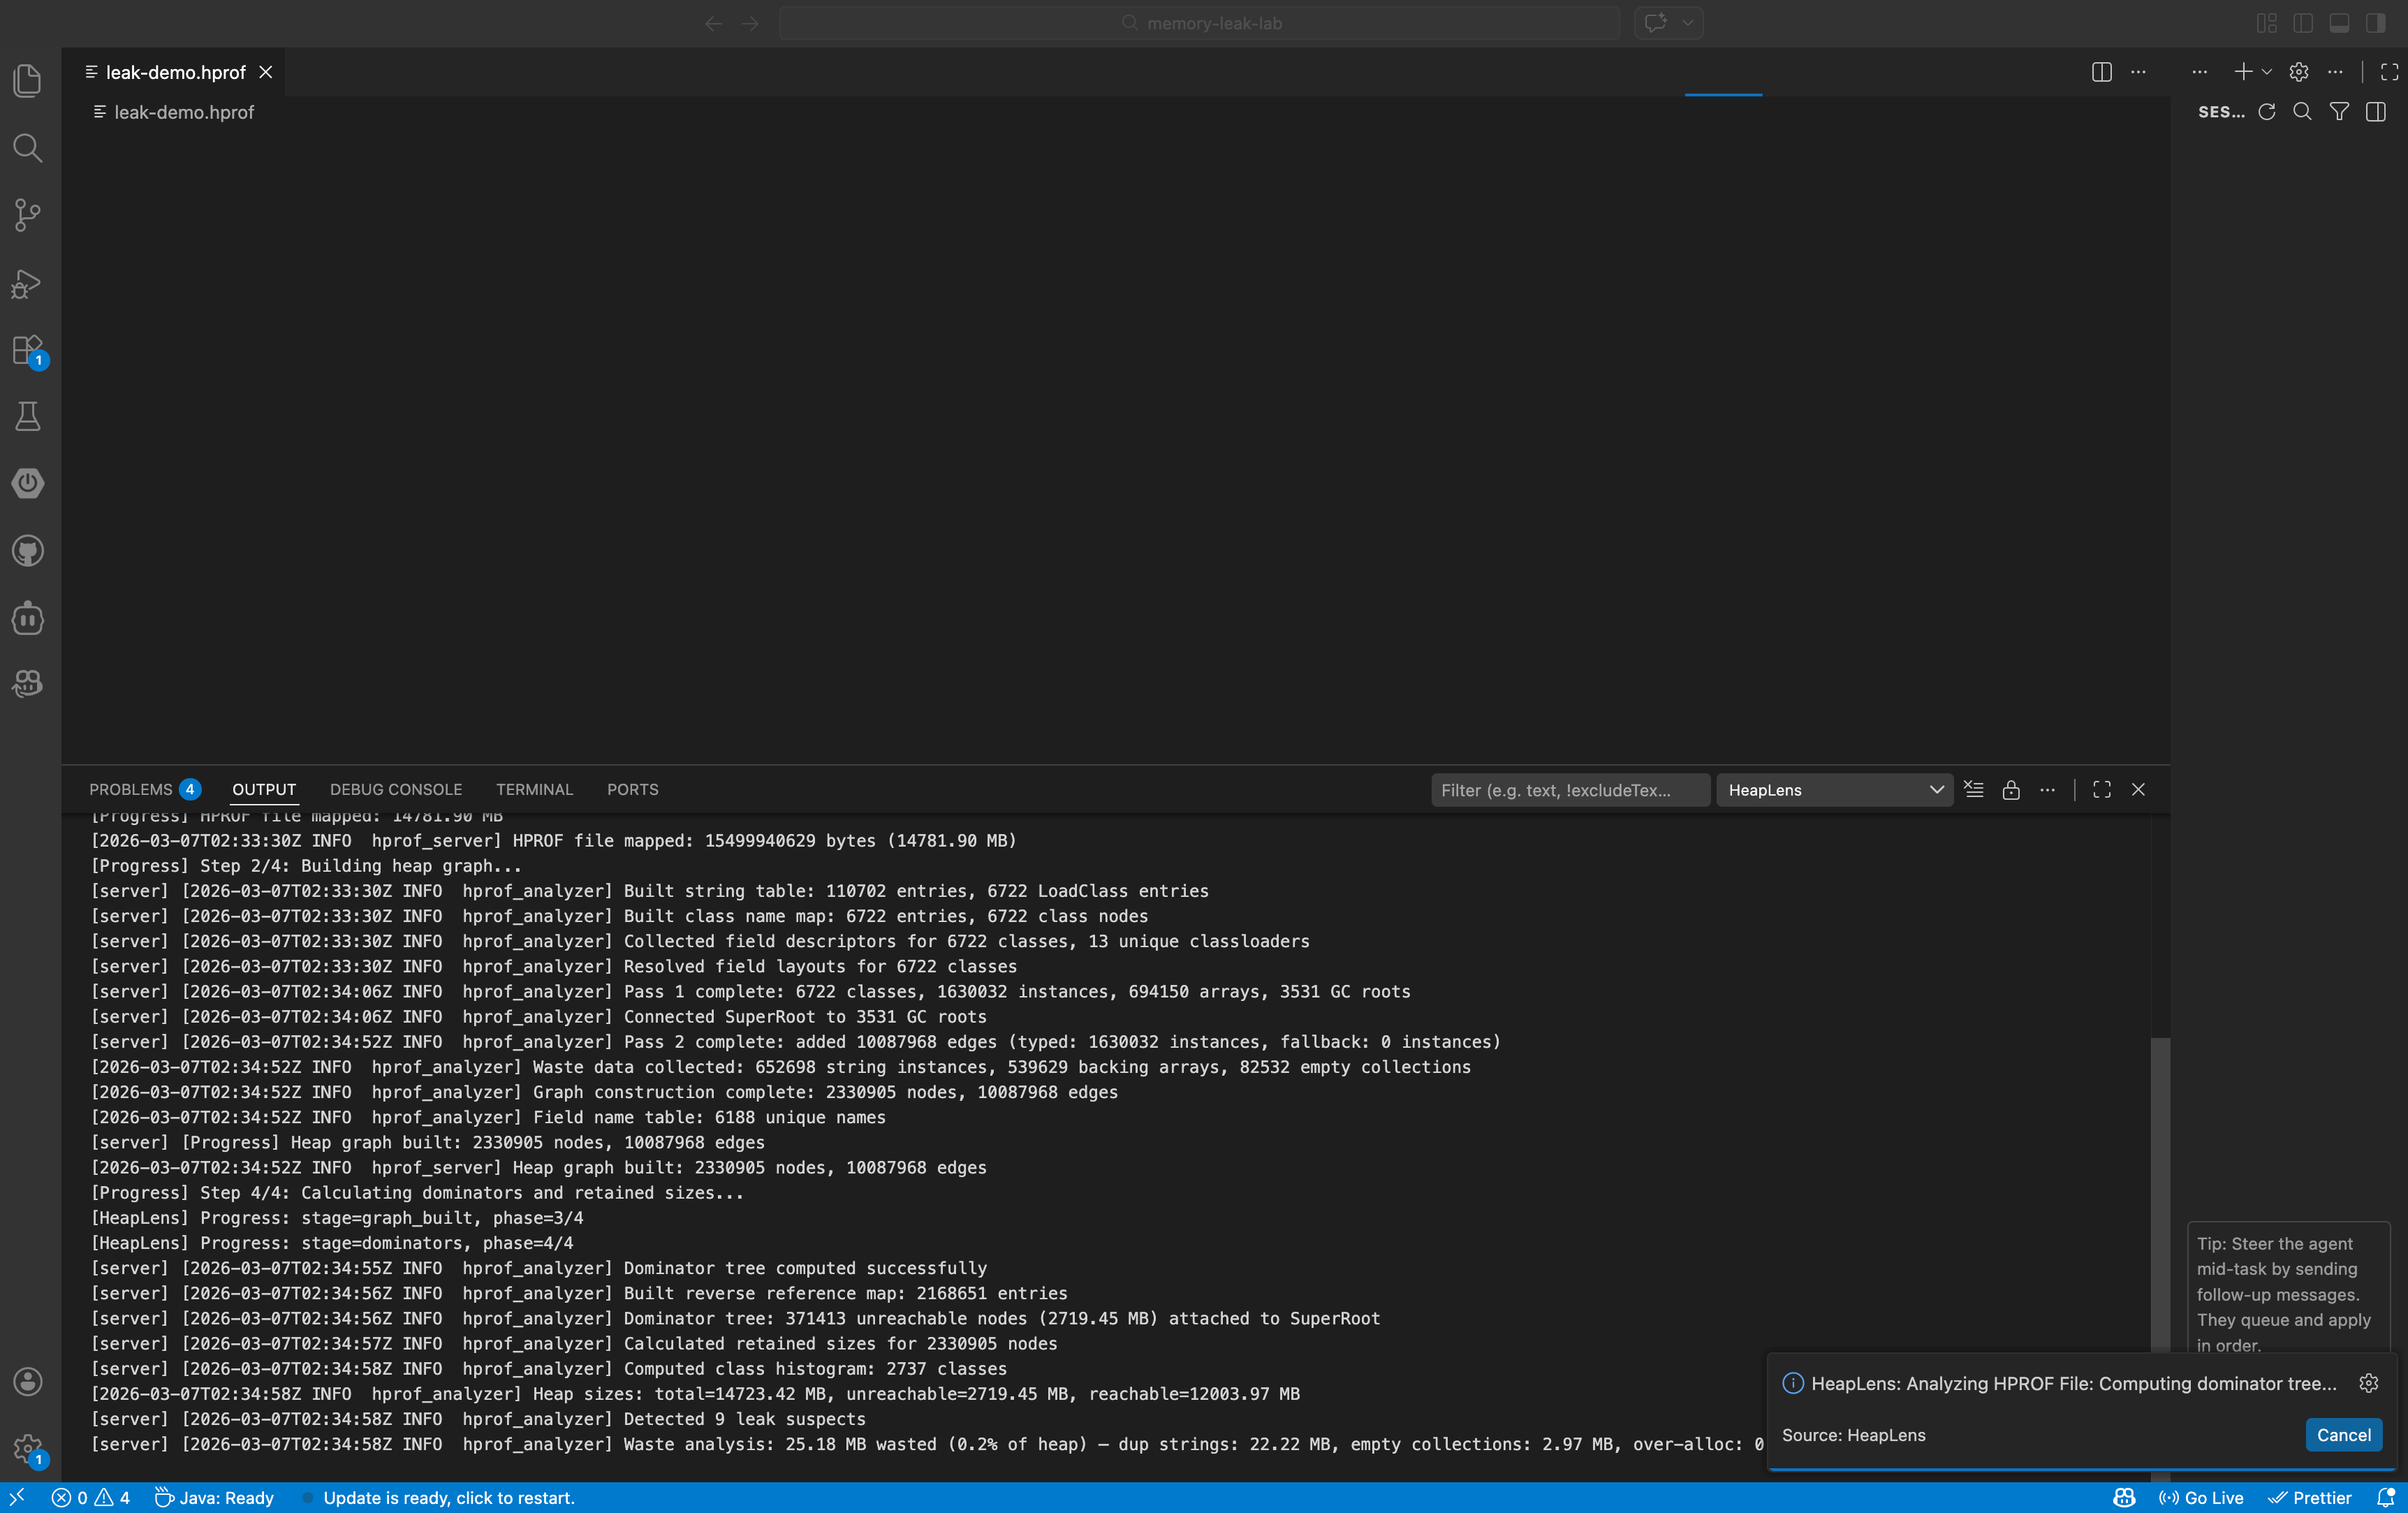
Built on a native Rust engine using zero-copy mmap parsing with a two-phase CSR architecture, HeapLens handles production-sized heap dumps with ease. A 1.5 GB heap dump analyzes in about 1 second; a 14.8 GB dump completes in 10 seconds on an Apple M2 Max (1,400+ MB/s throughput). HeapLens also introduces HeapQL, a SQL-like query language purpose-built for heap analysis — query any object, filter by retained size, join across tables, and export results, all without leaving your editor.
Features
10 Interactive Tabs
| Tab |
What it does |
| Overview |
Heap stats, top objects, D3.js pie & bar charts |
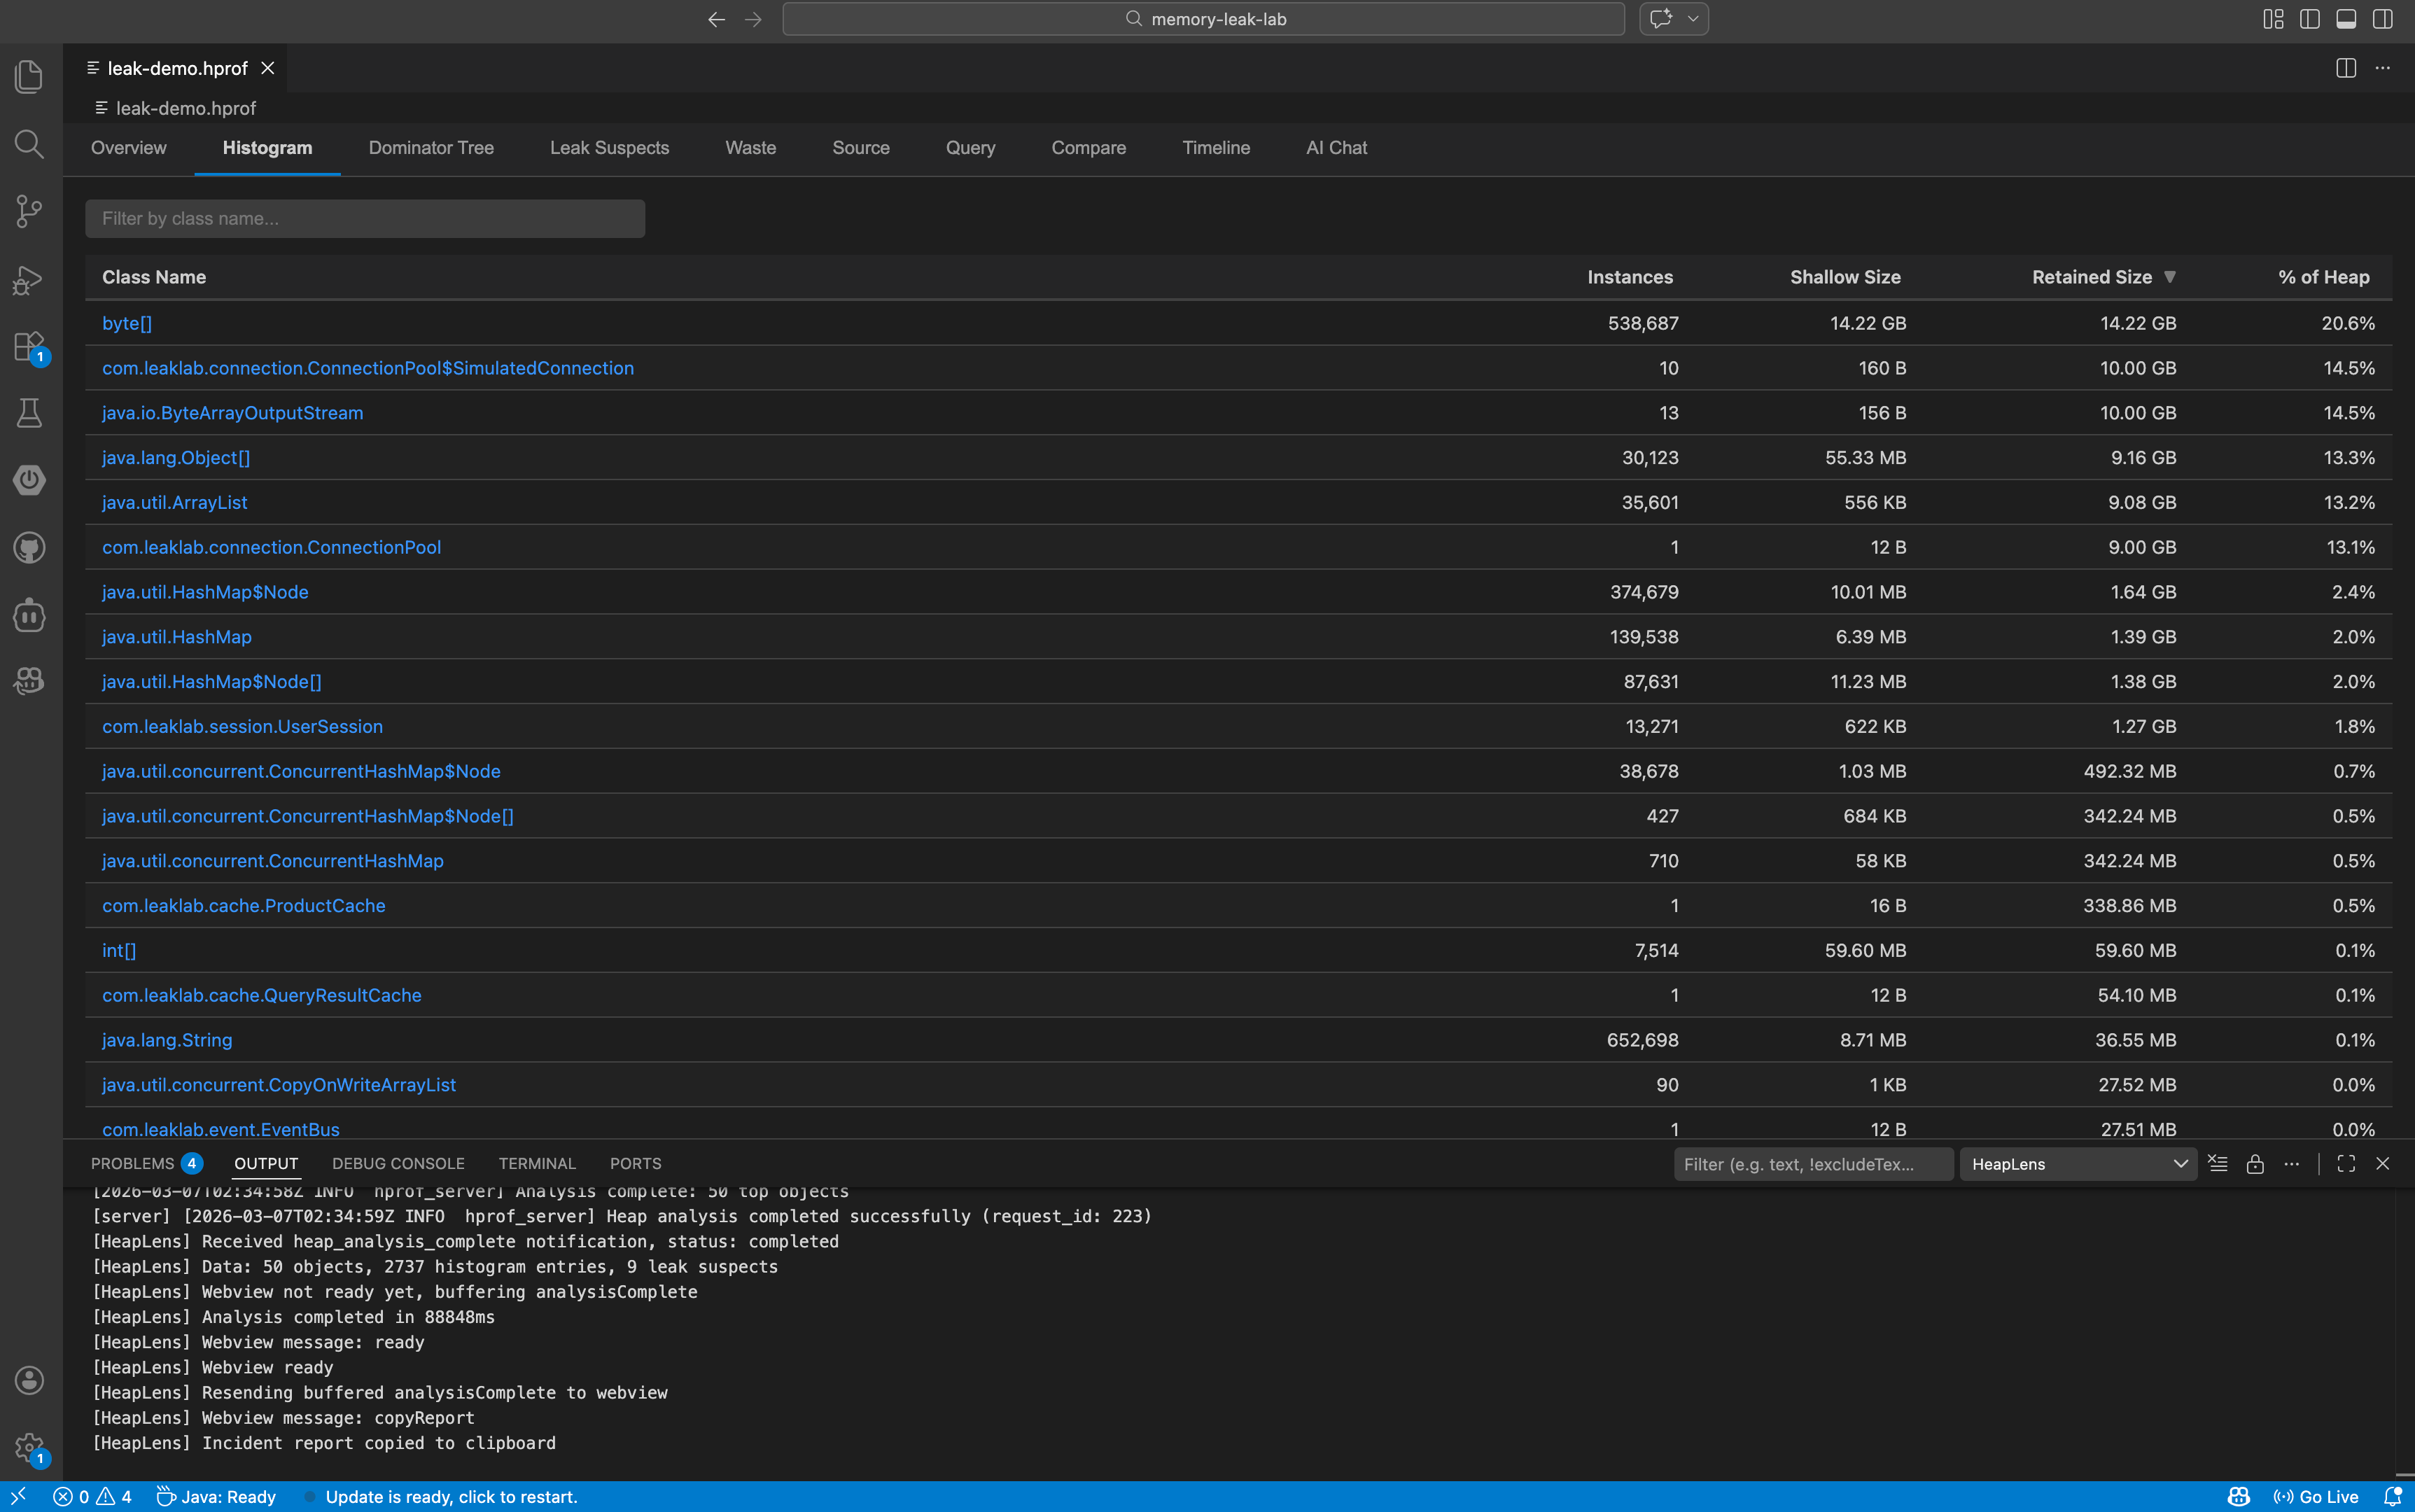
| Histogram |
Sortable class table with instance counts and sizes — click a class to list all instances |
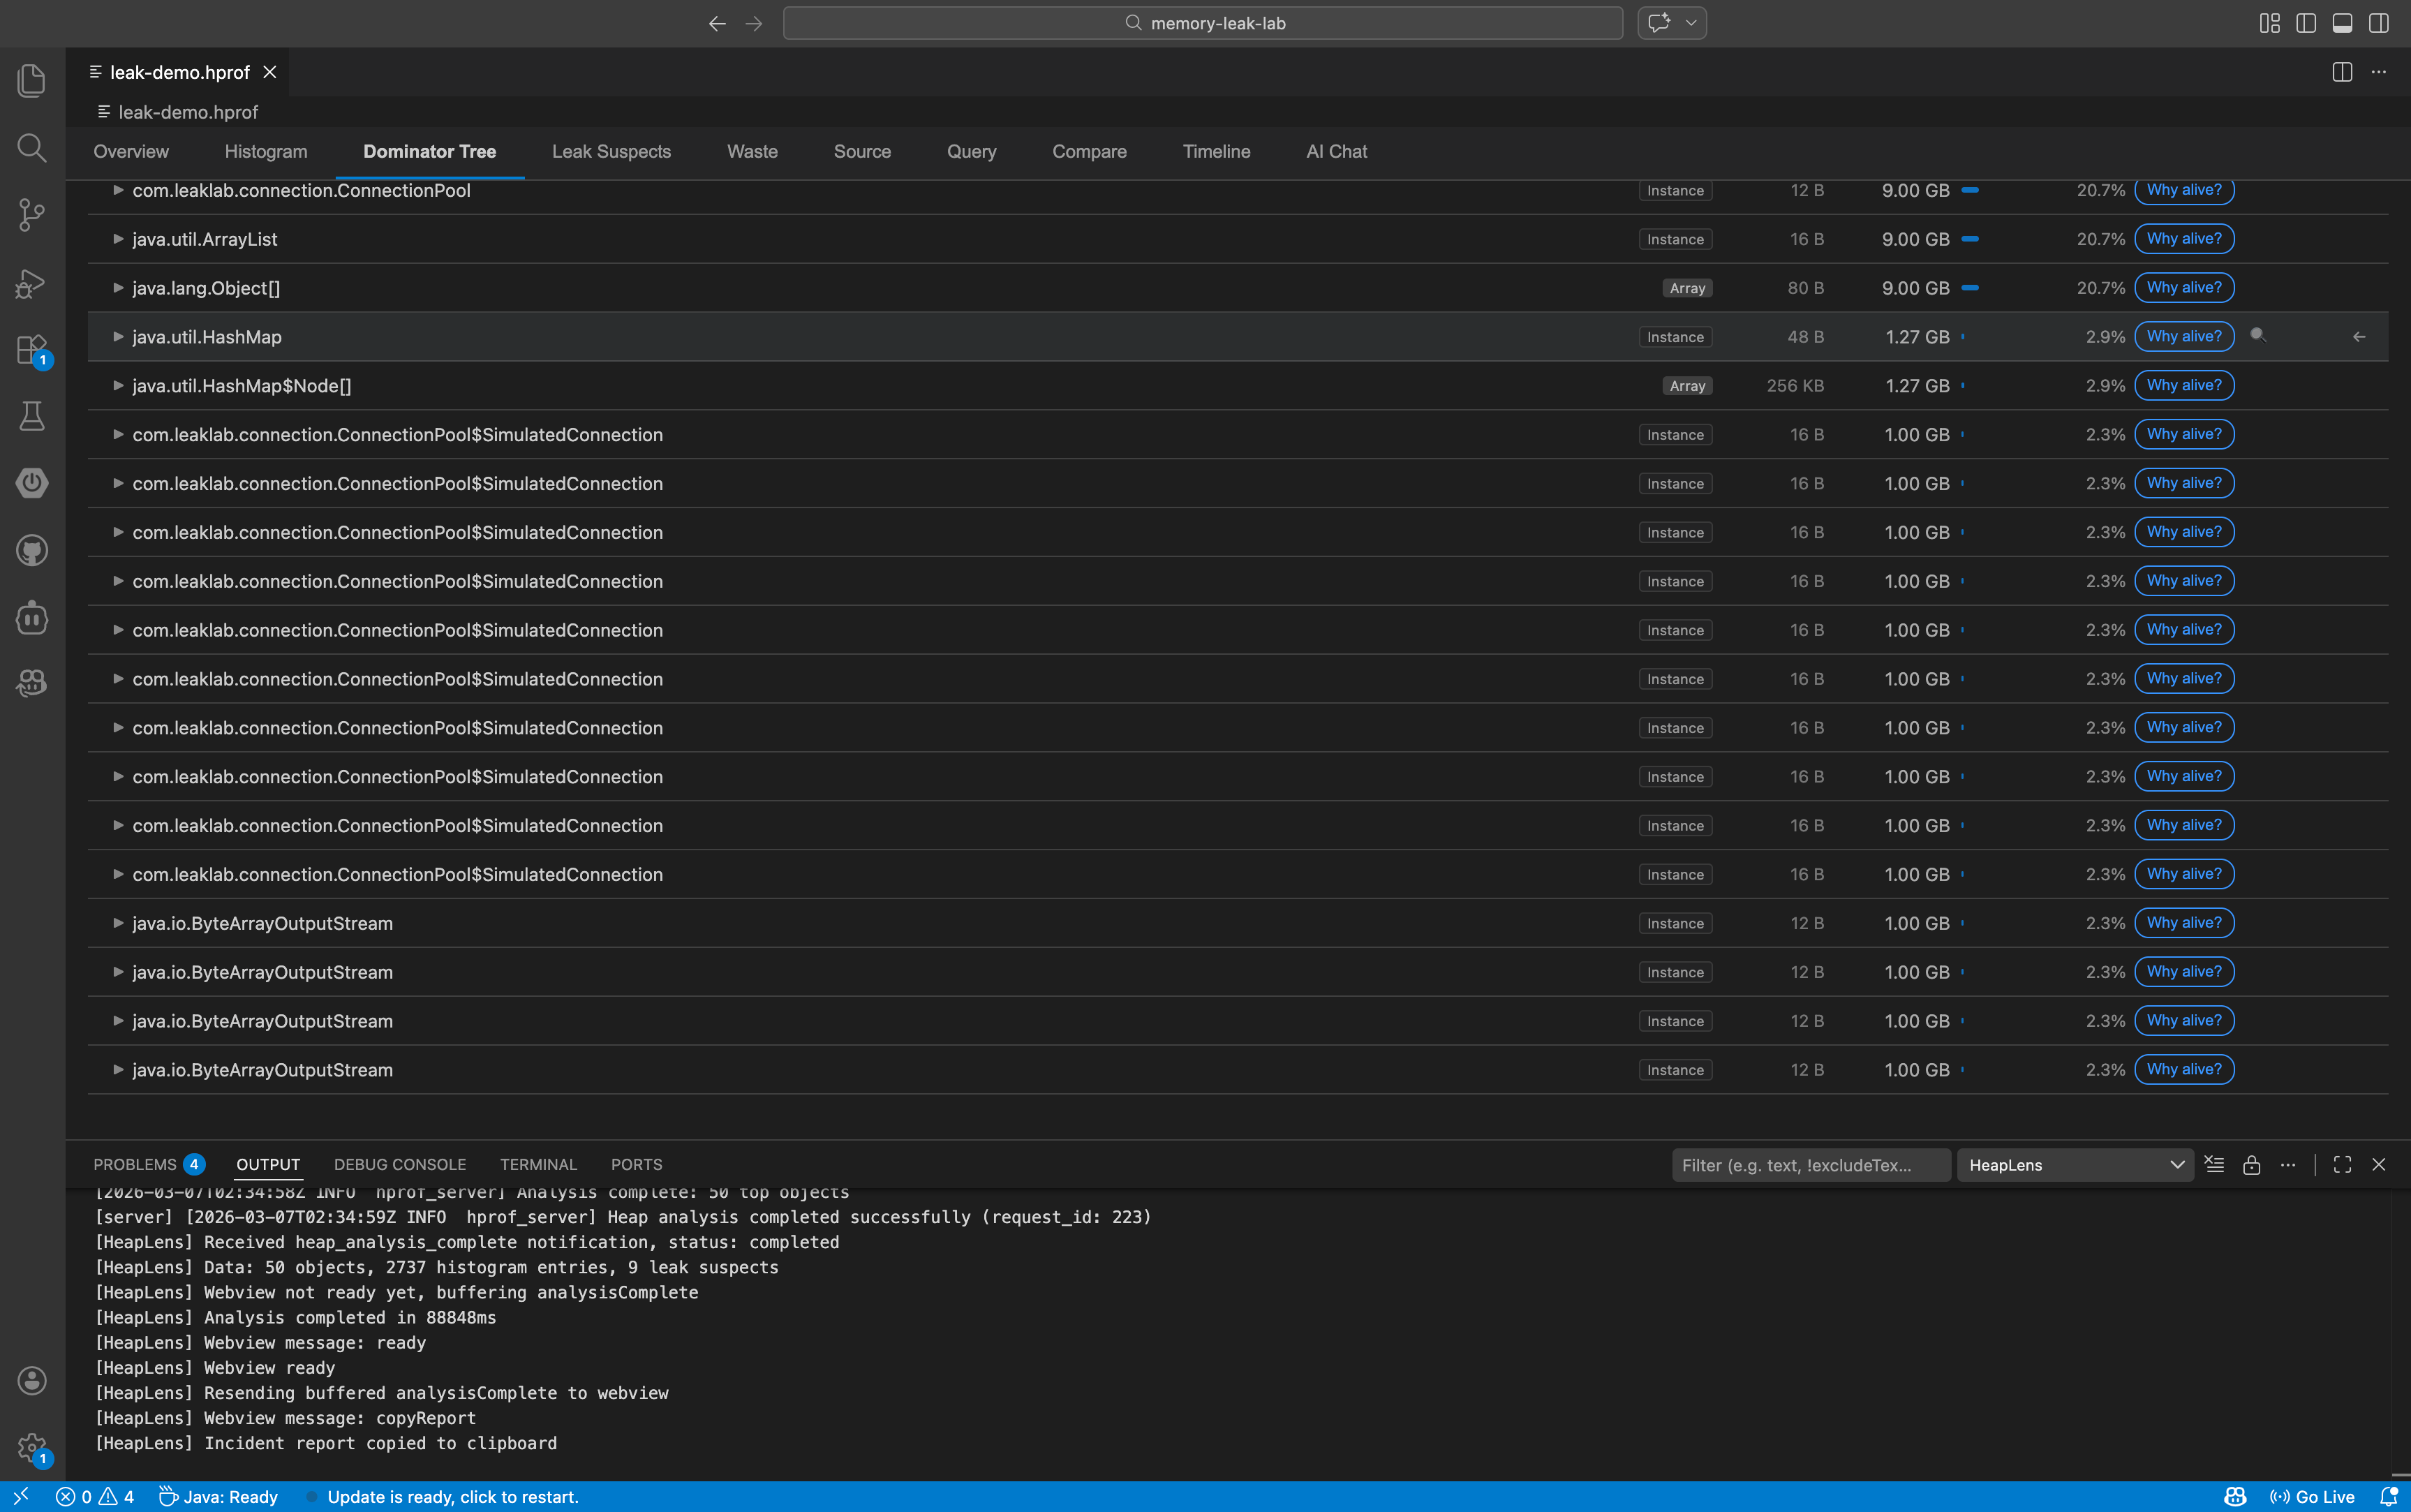
| Dominator Tree |
Expandable lazy-loaded tree with retained size bars, field names, and action buttons |
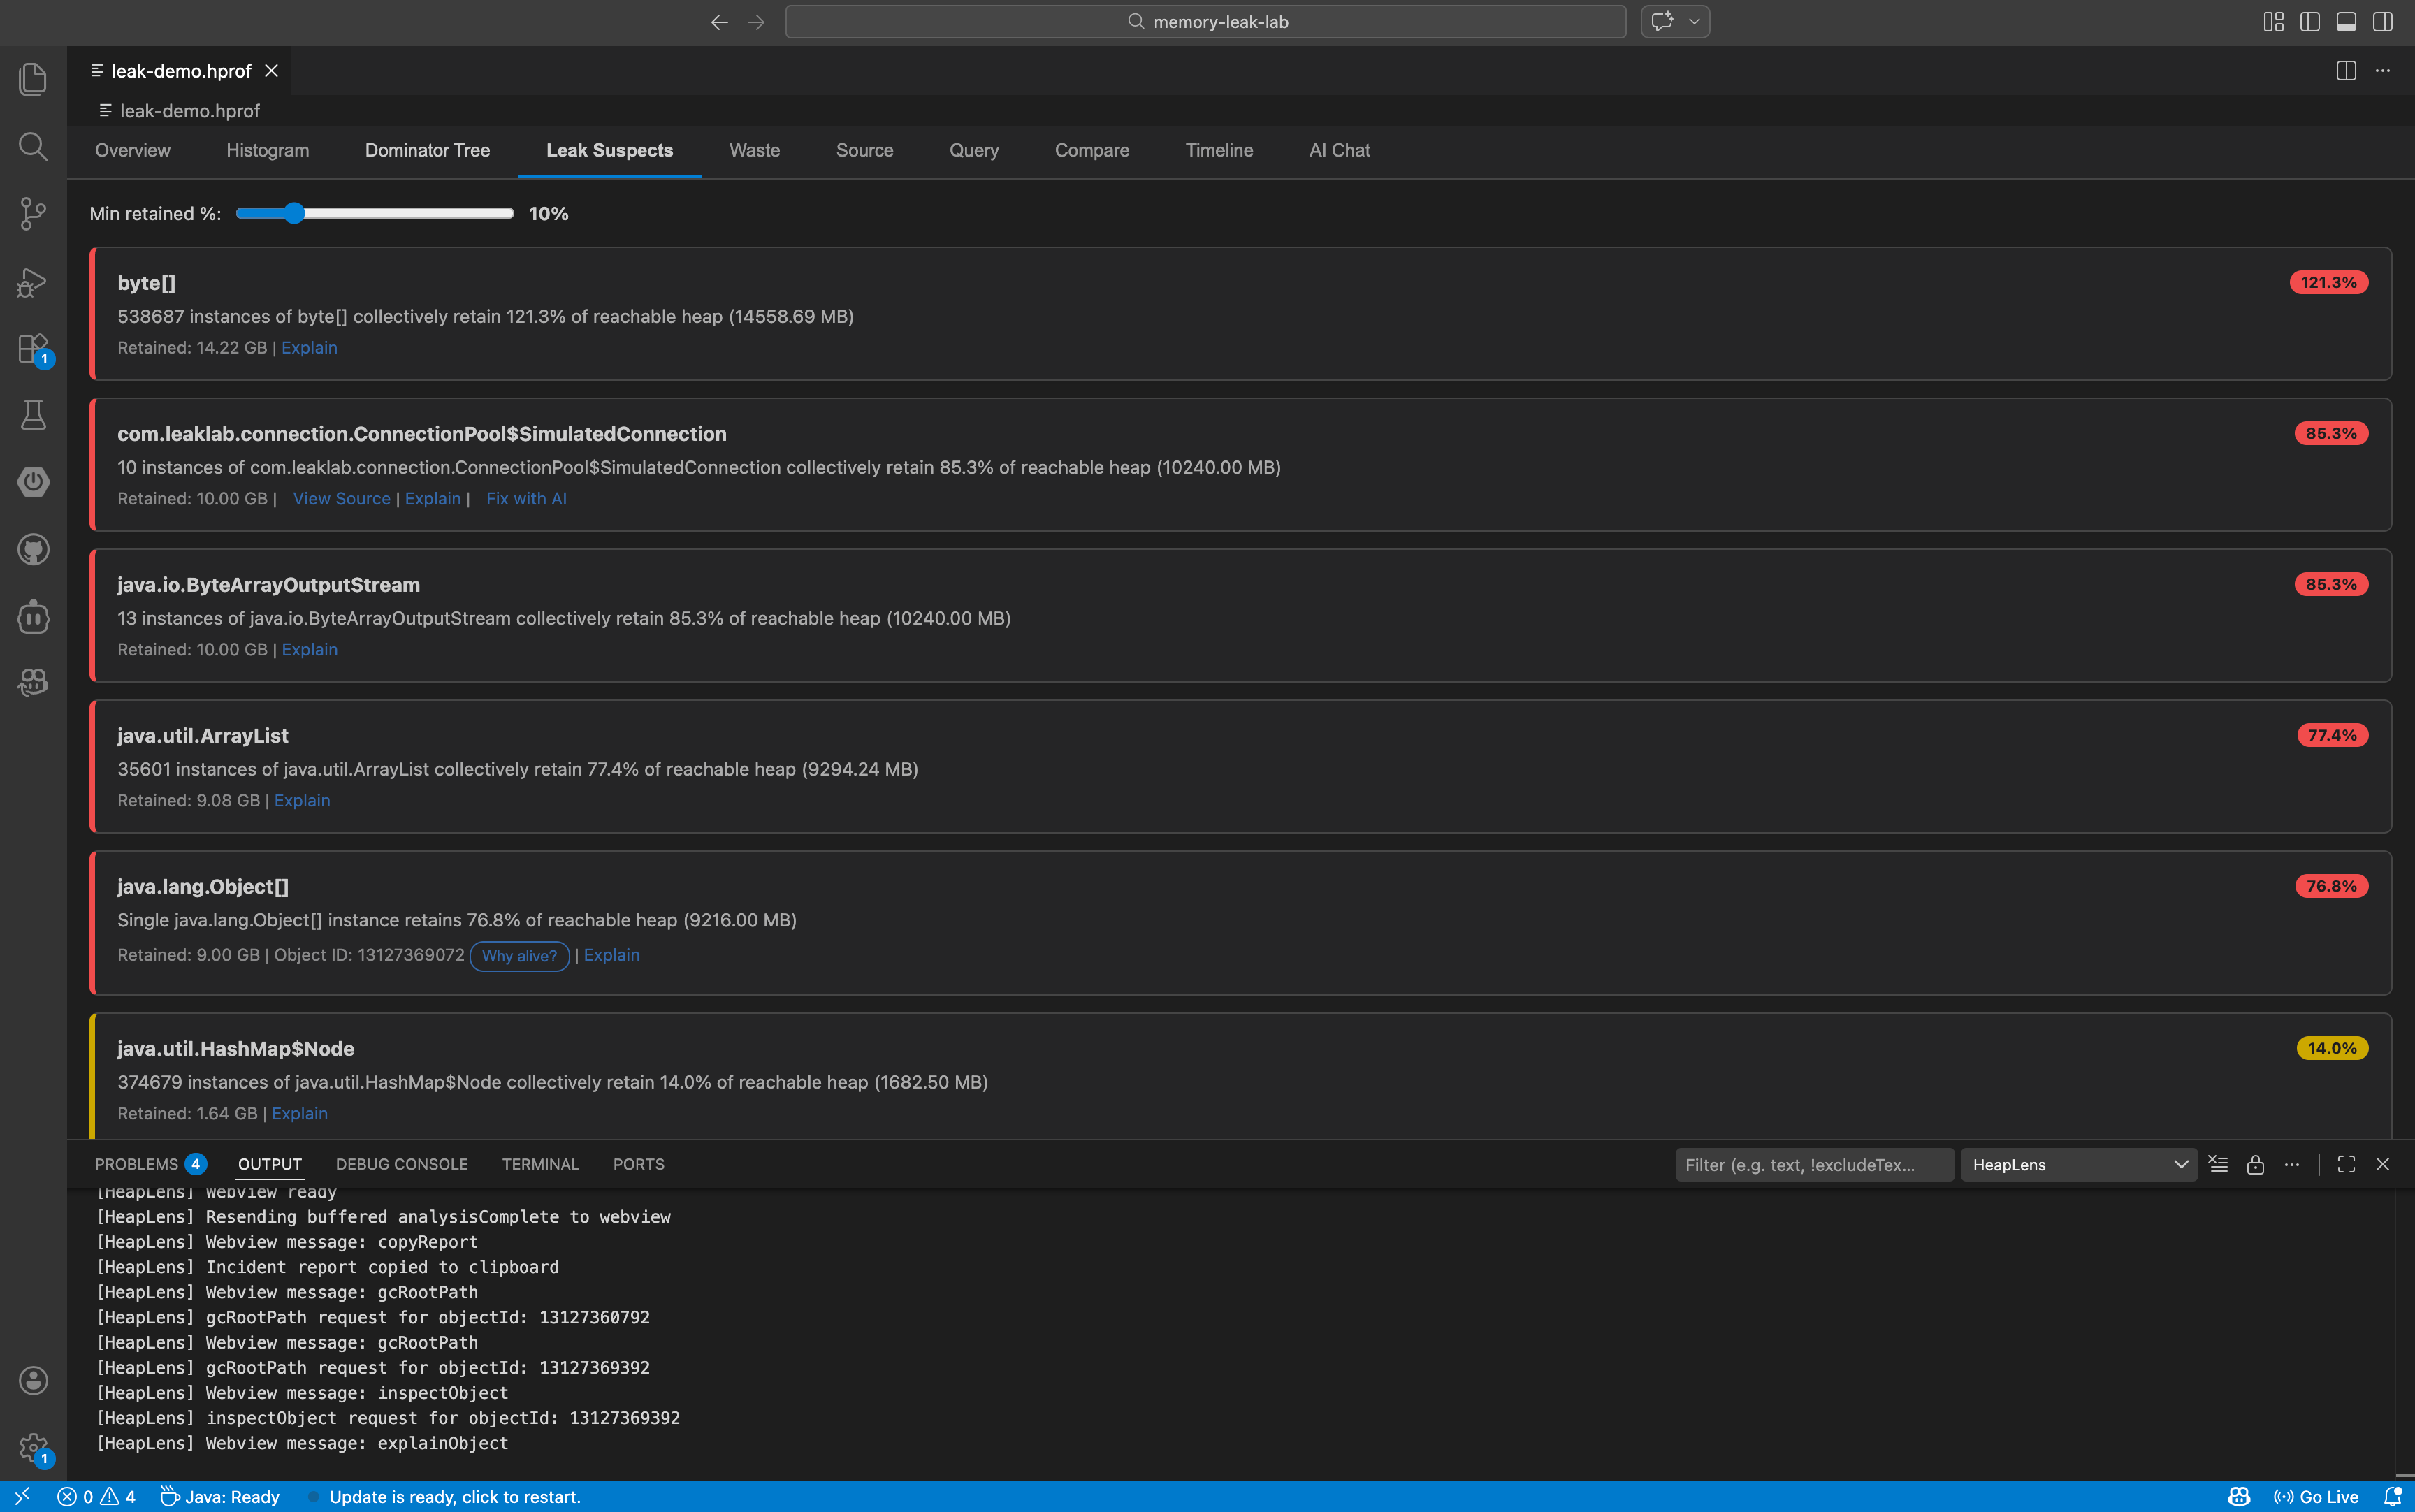
| Leak Suspects |
Objects/classes retaining >10% of heap, with adjustable threshold slider |
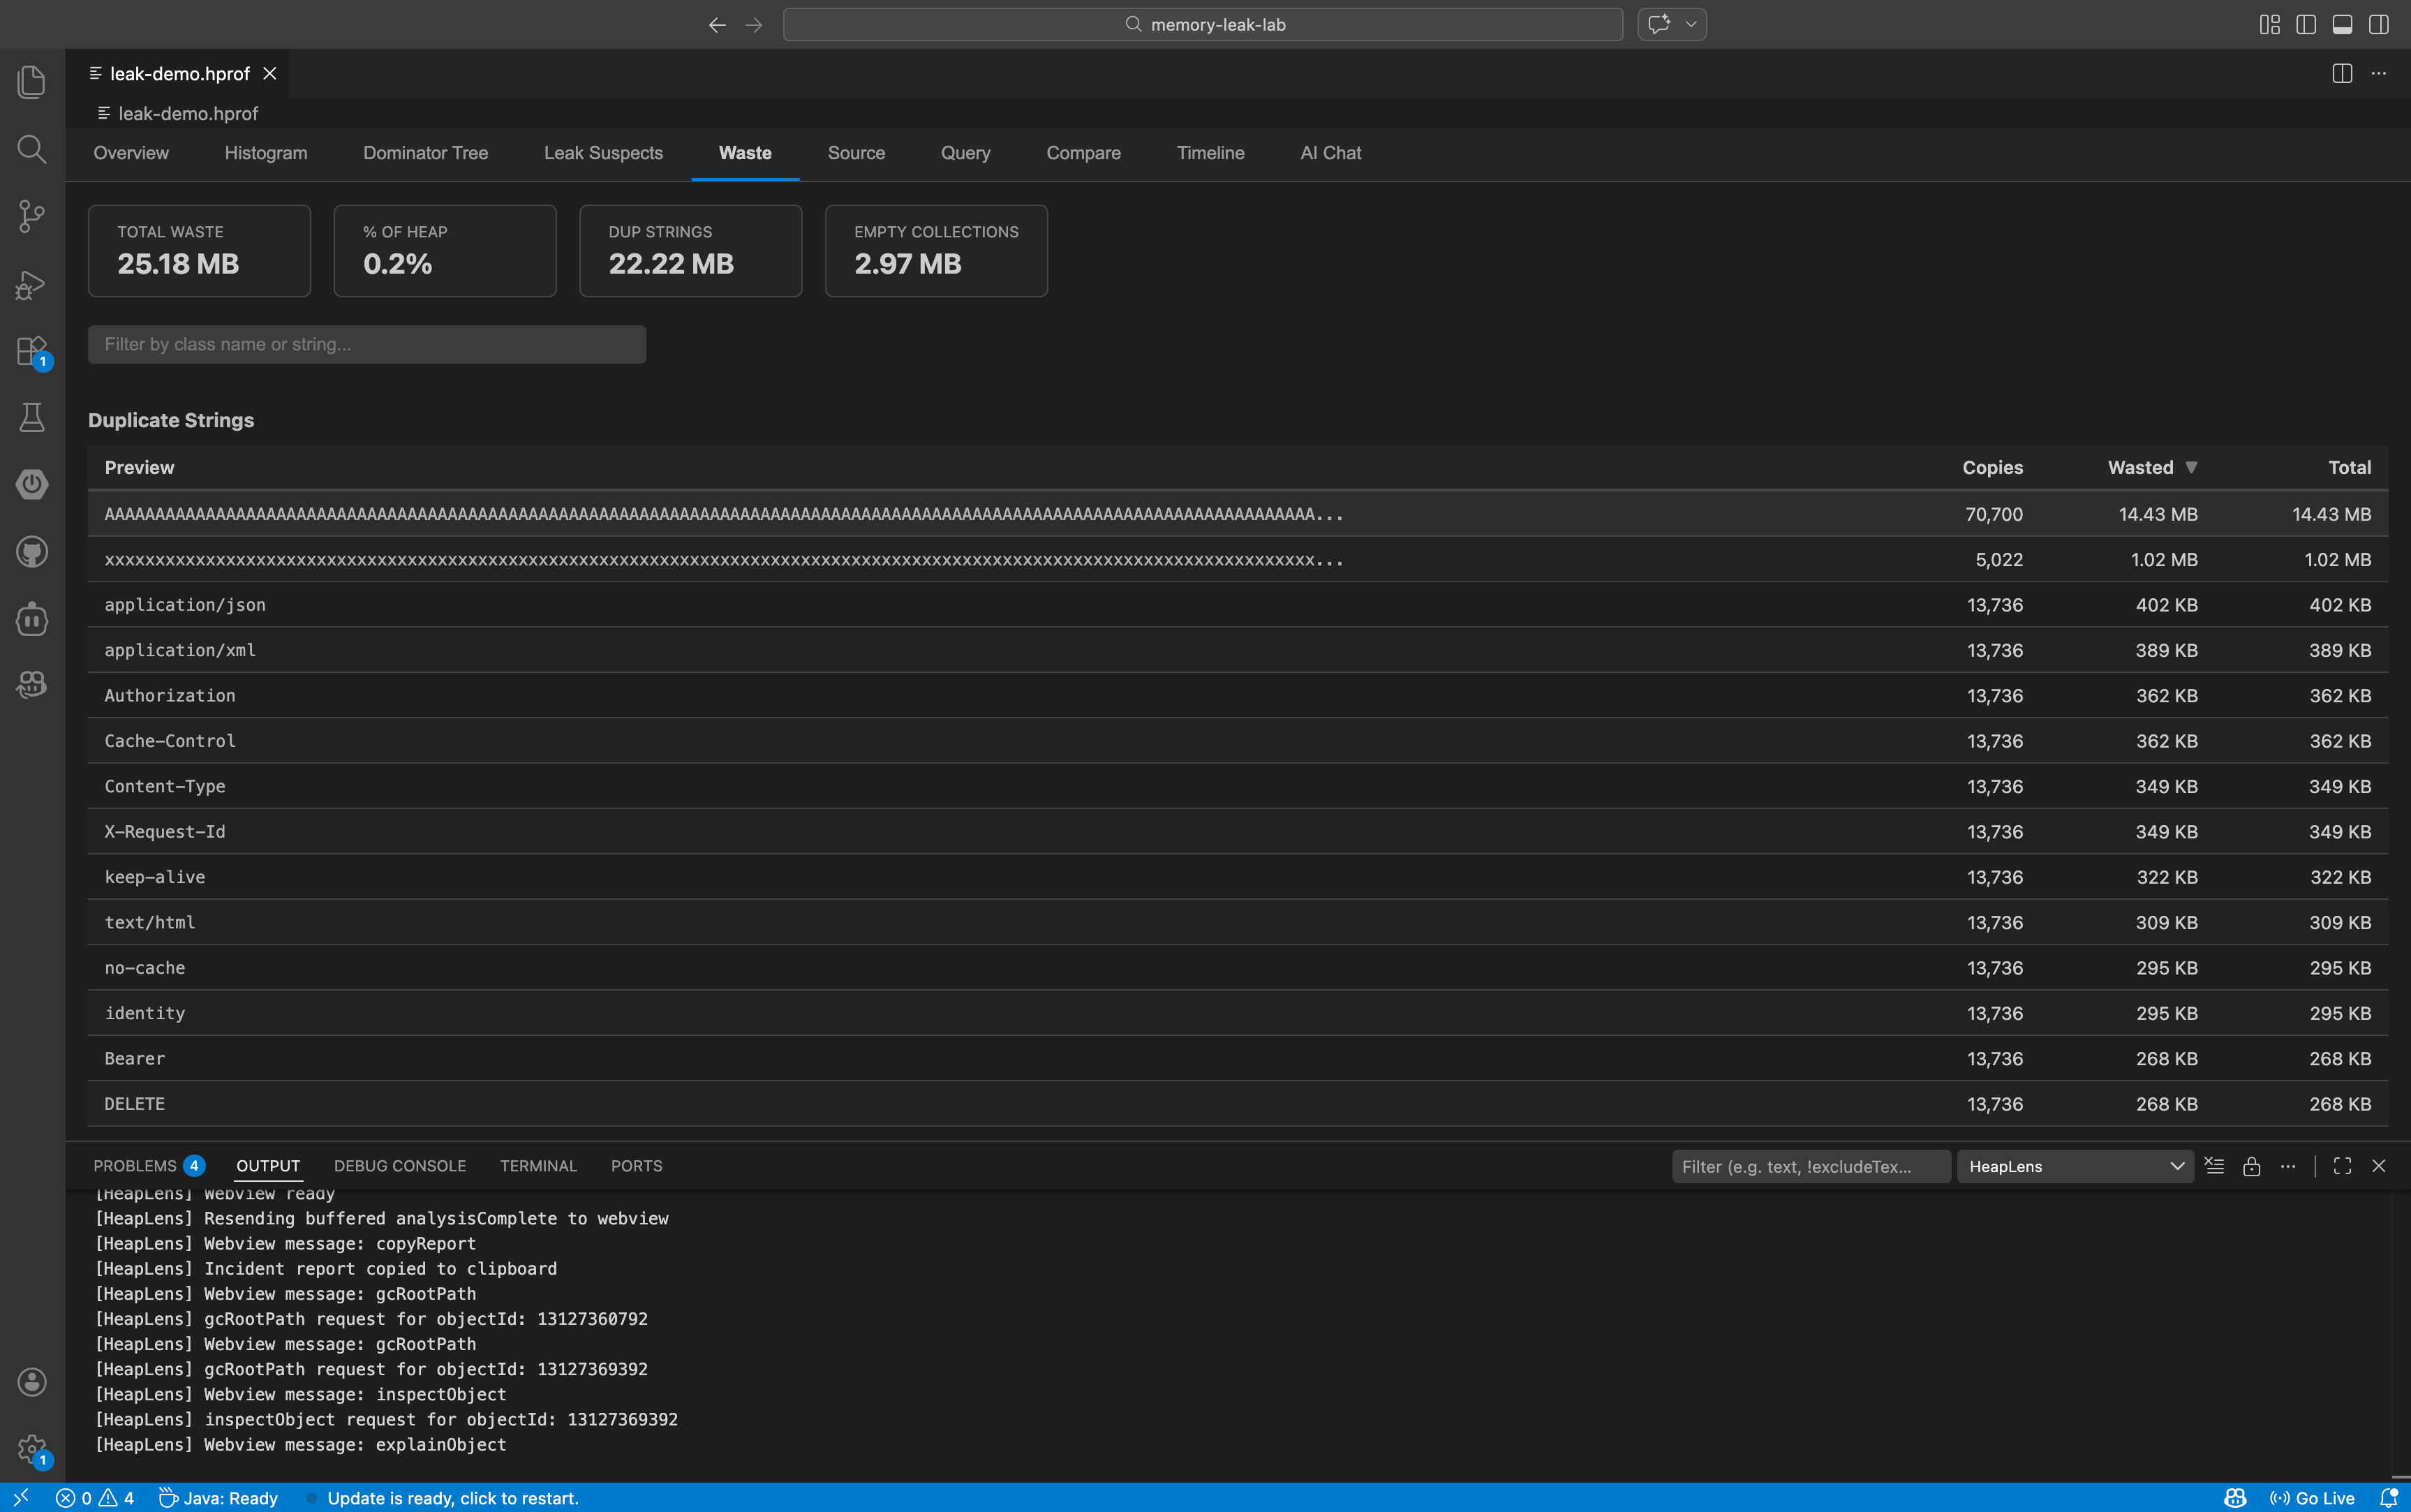
| Waste |
Duplicate strings, empty collections, over-allocated arrays, boxed primitives |
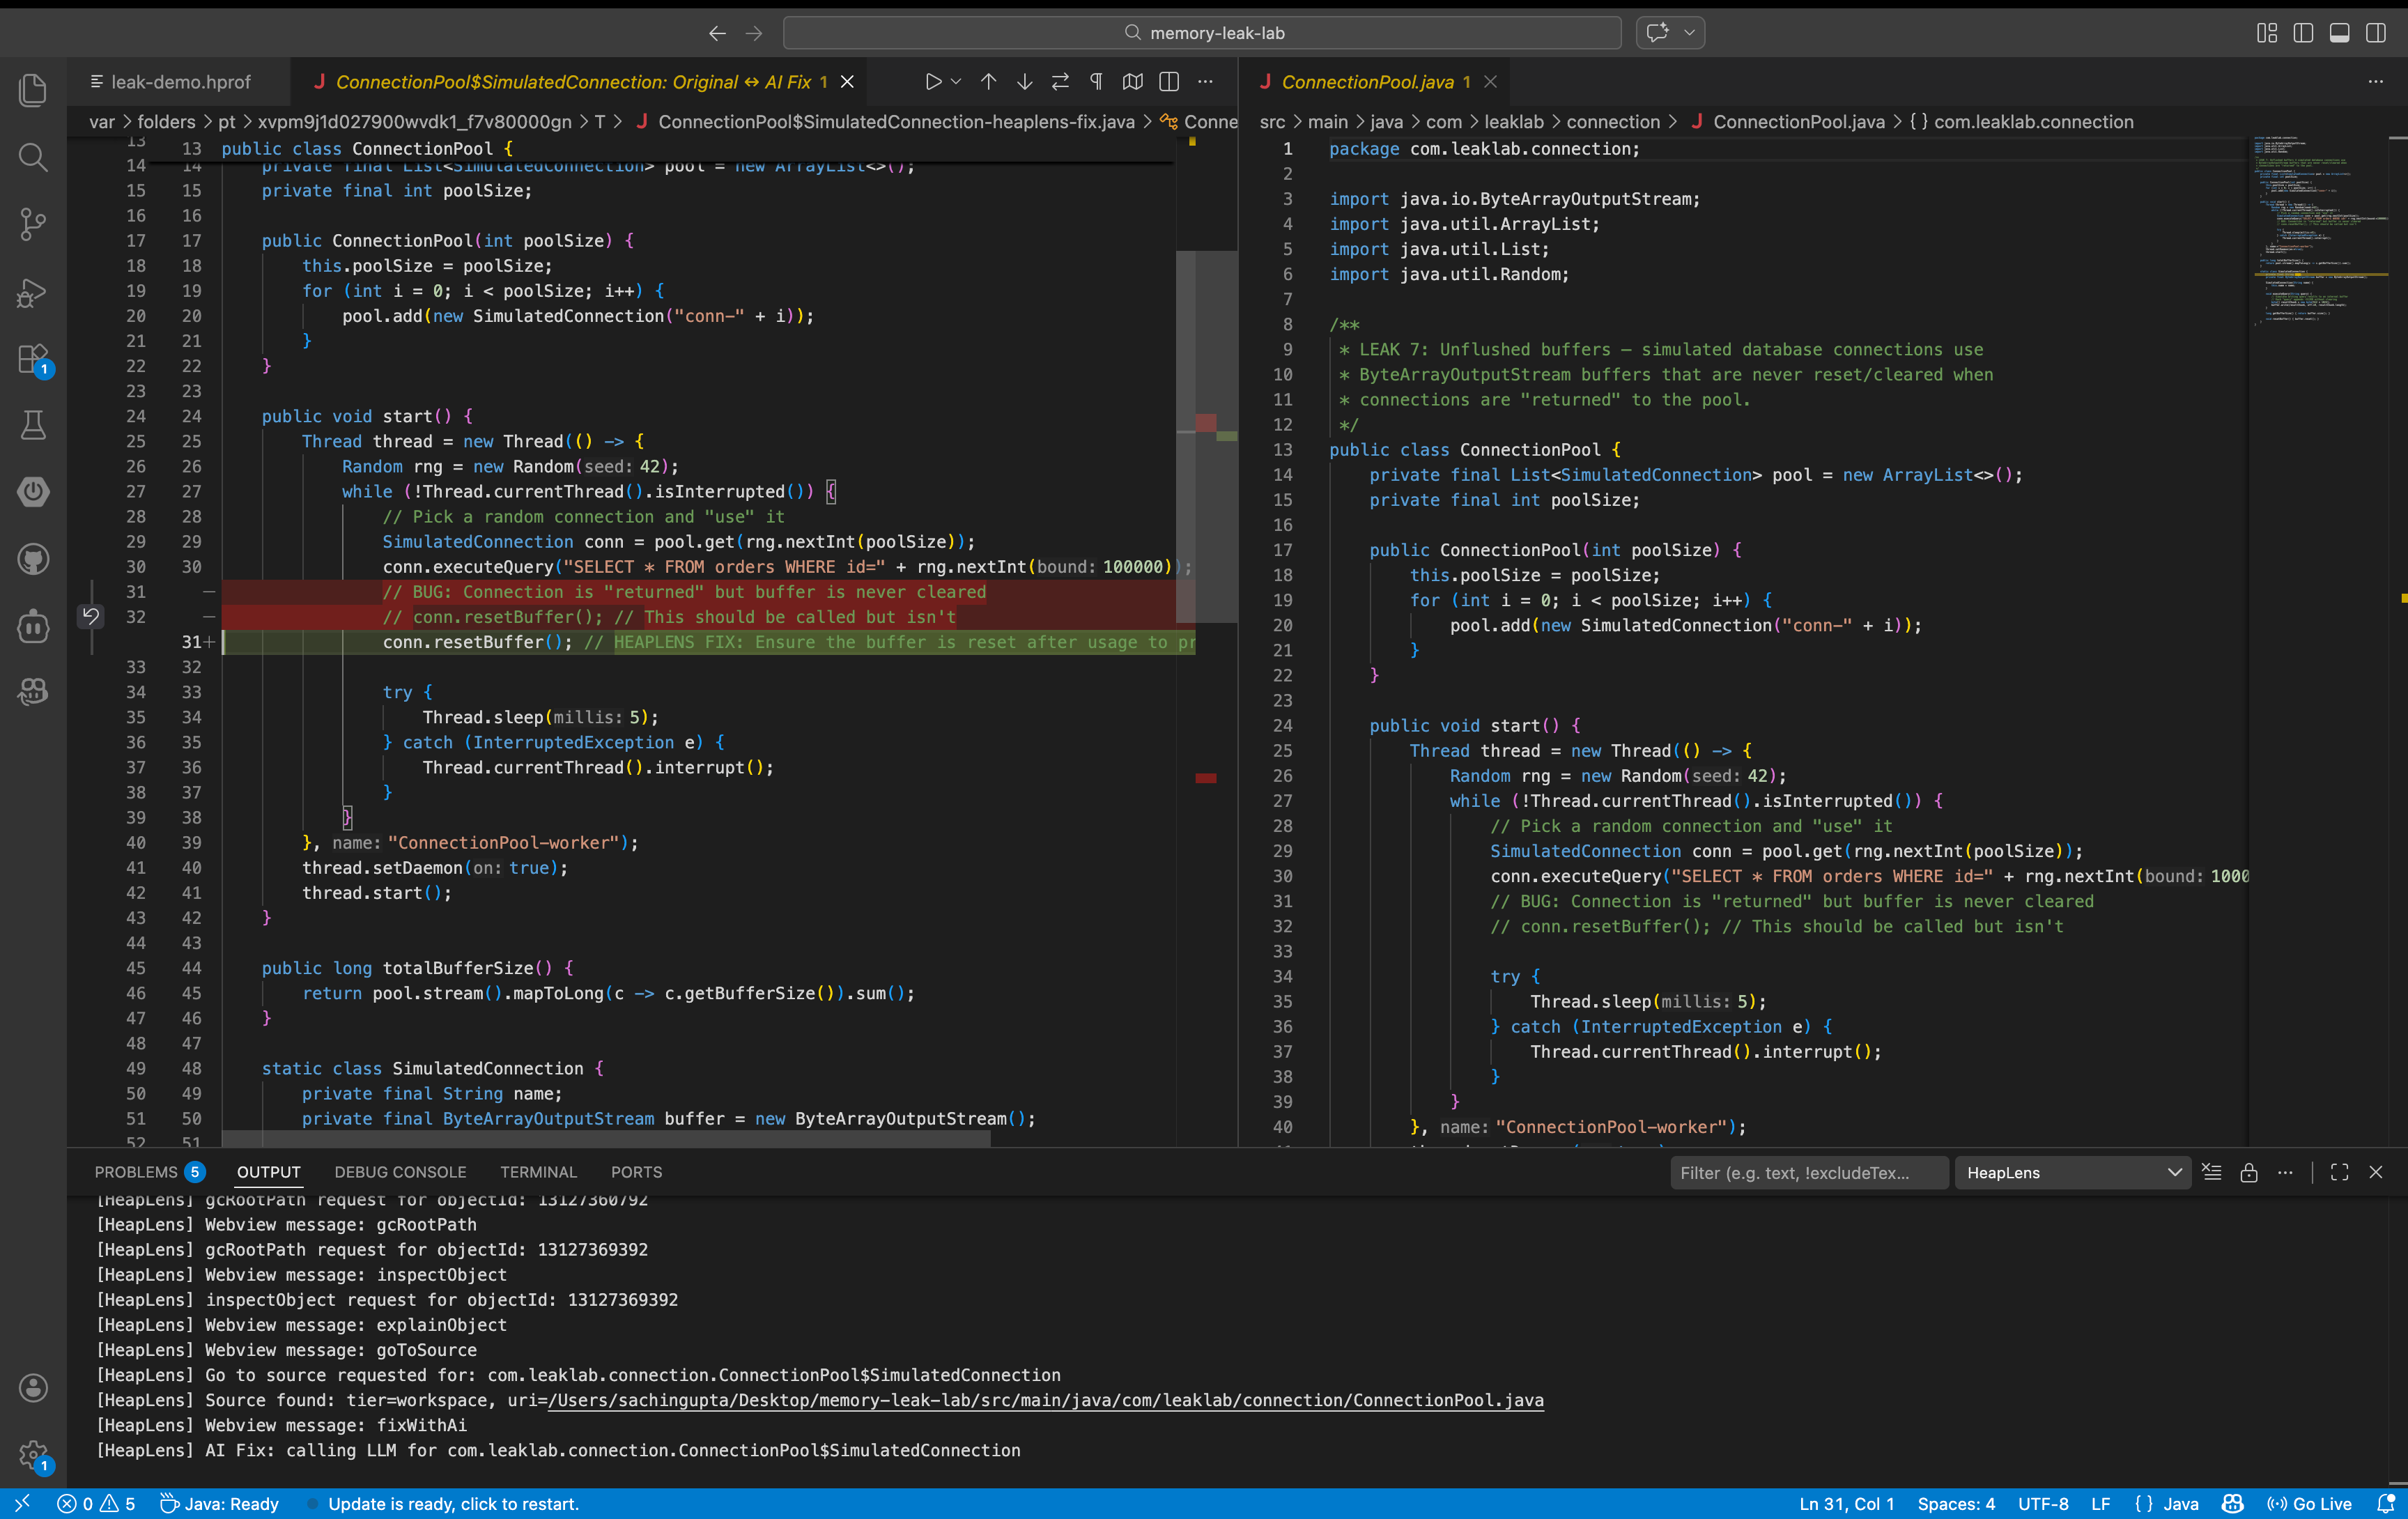
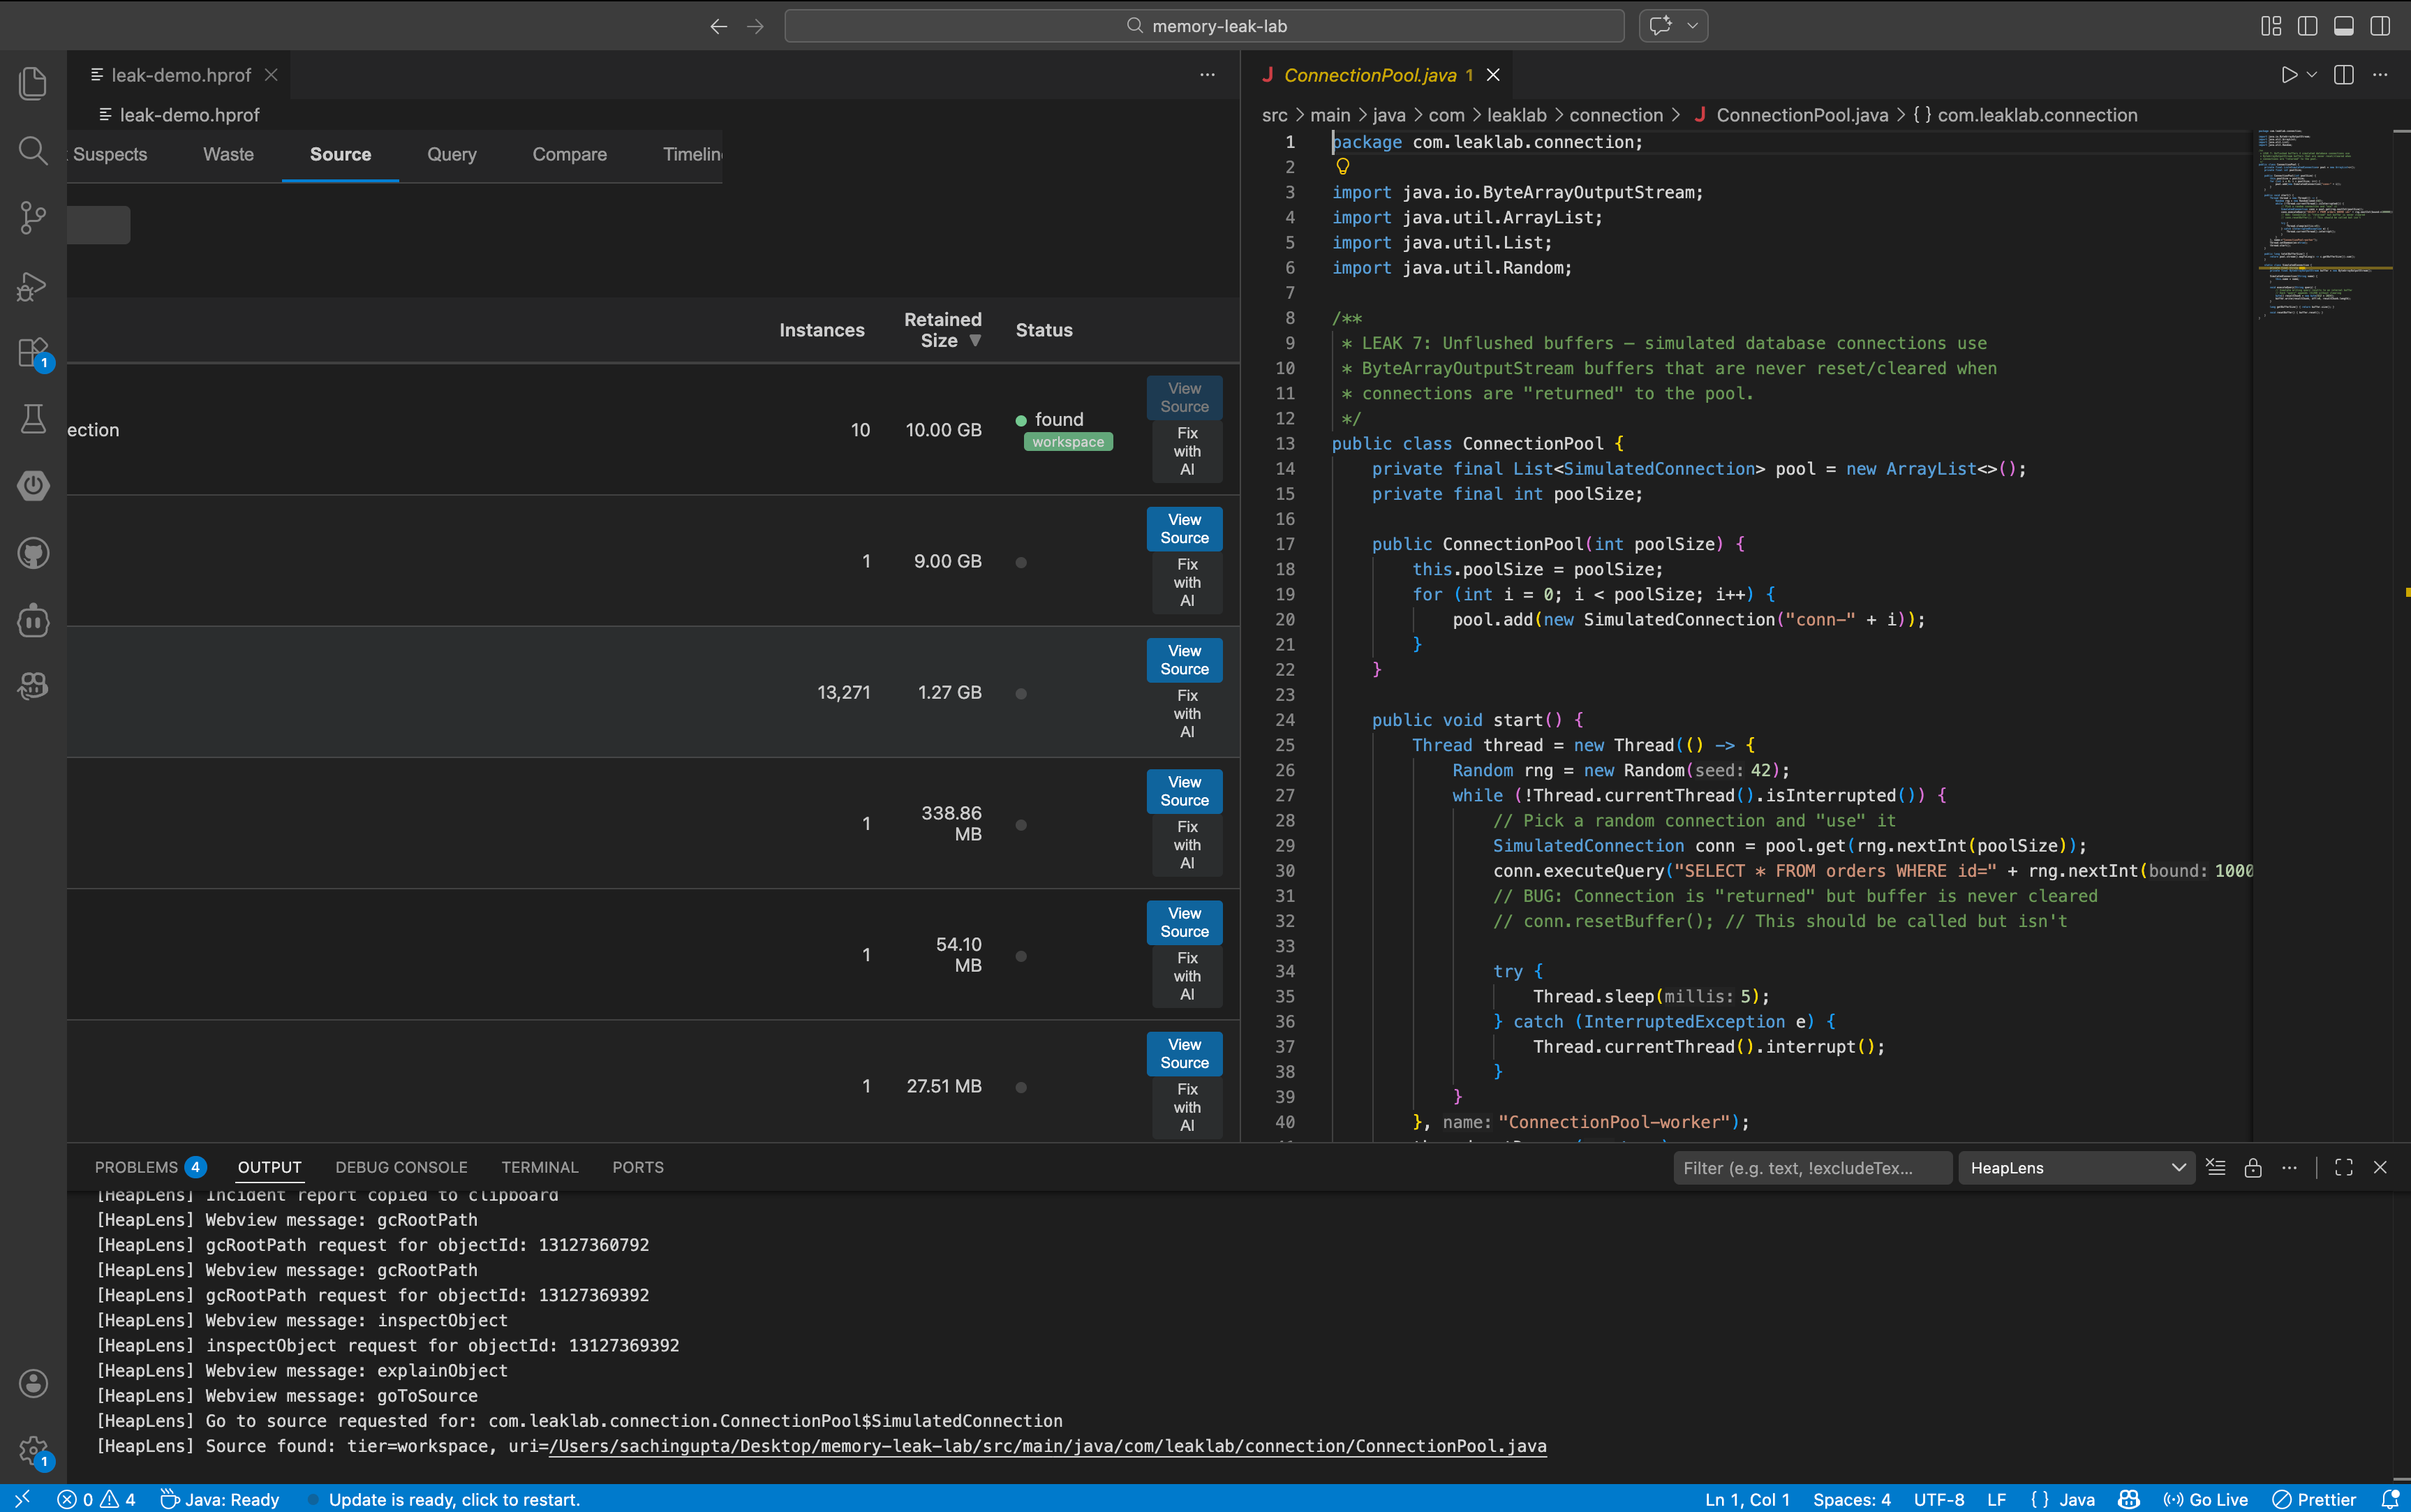
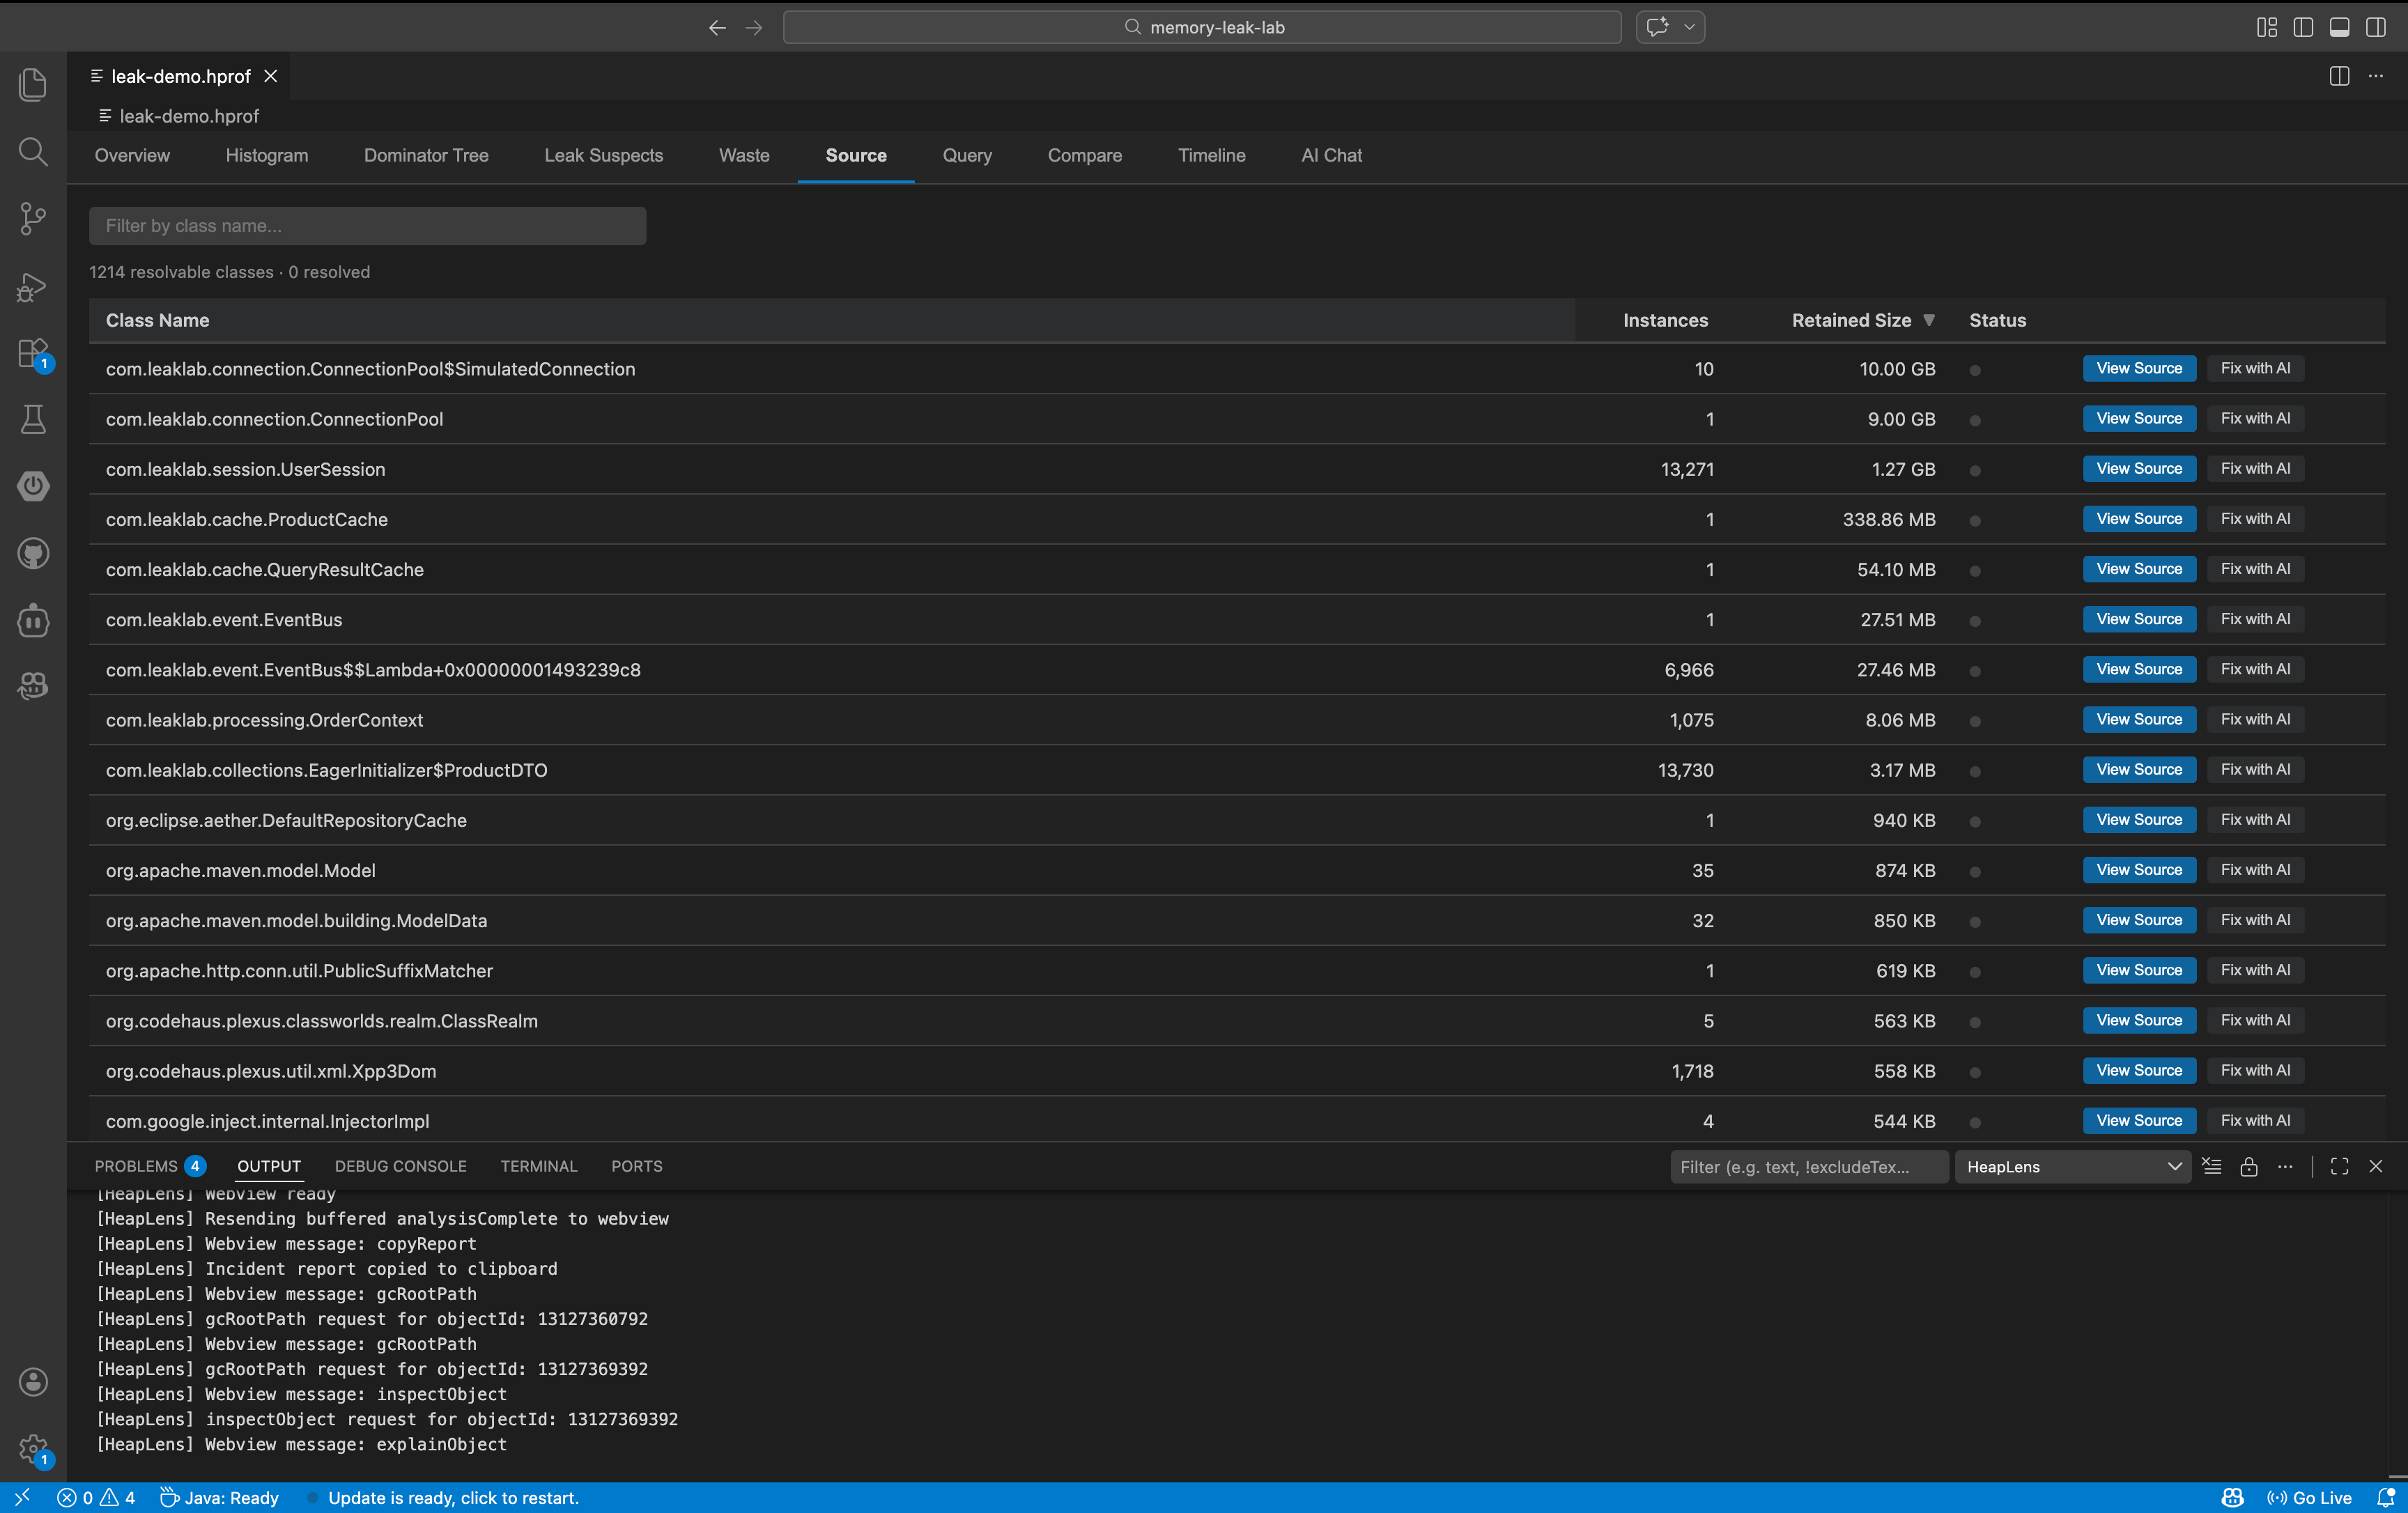
| Source |
Jump to Java source — workspace files, Maven/Gradle dependency JARs, or CFR decompilation |
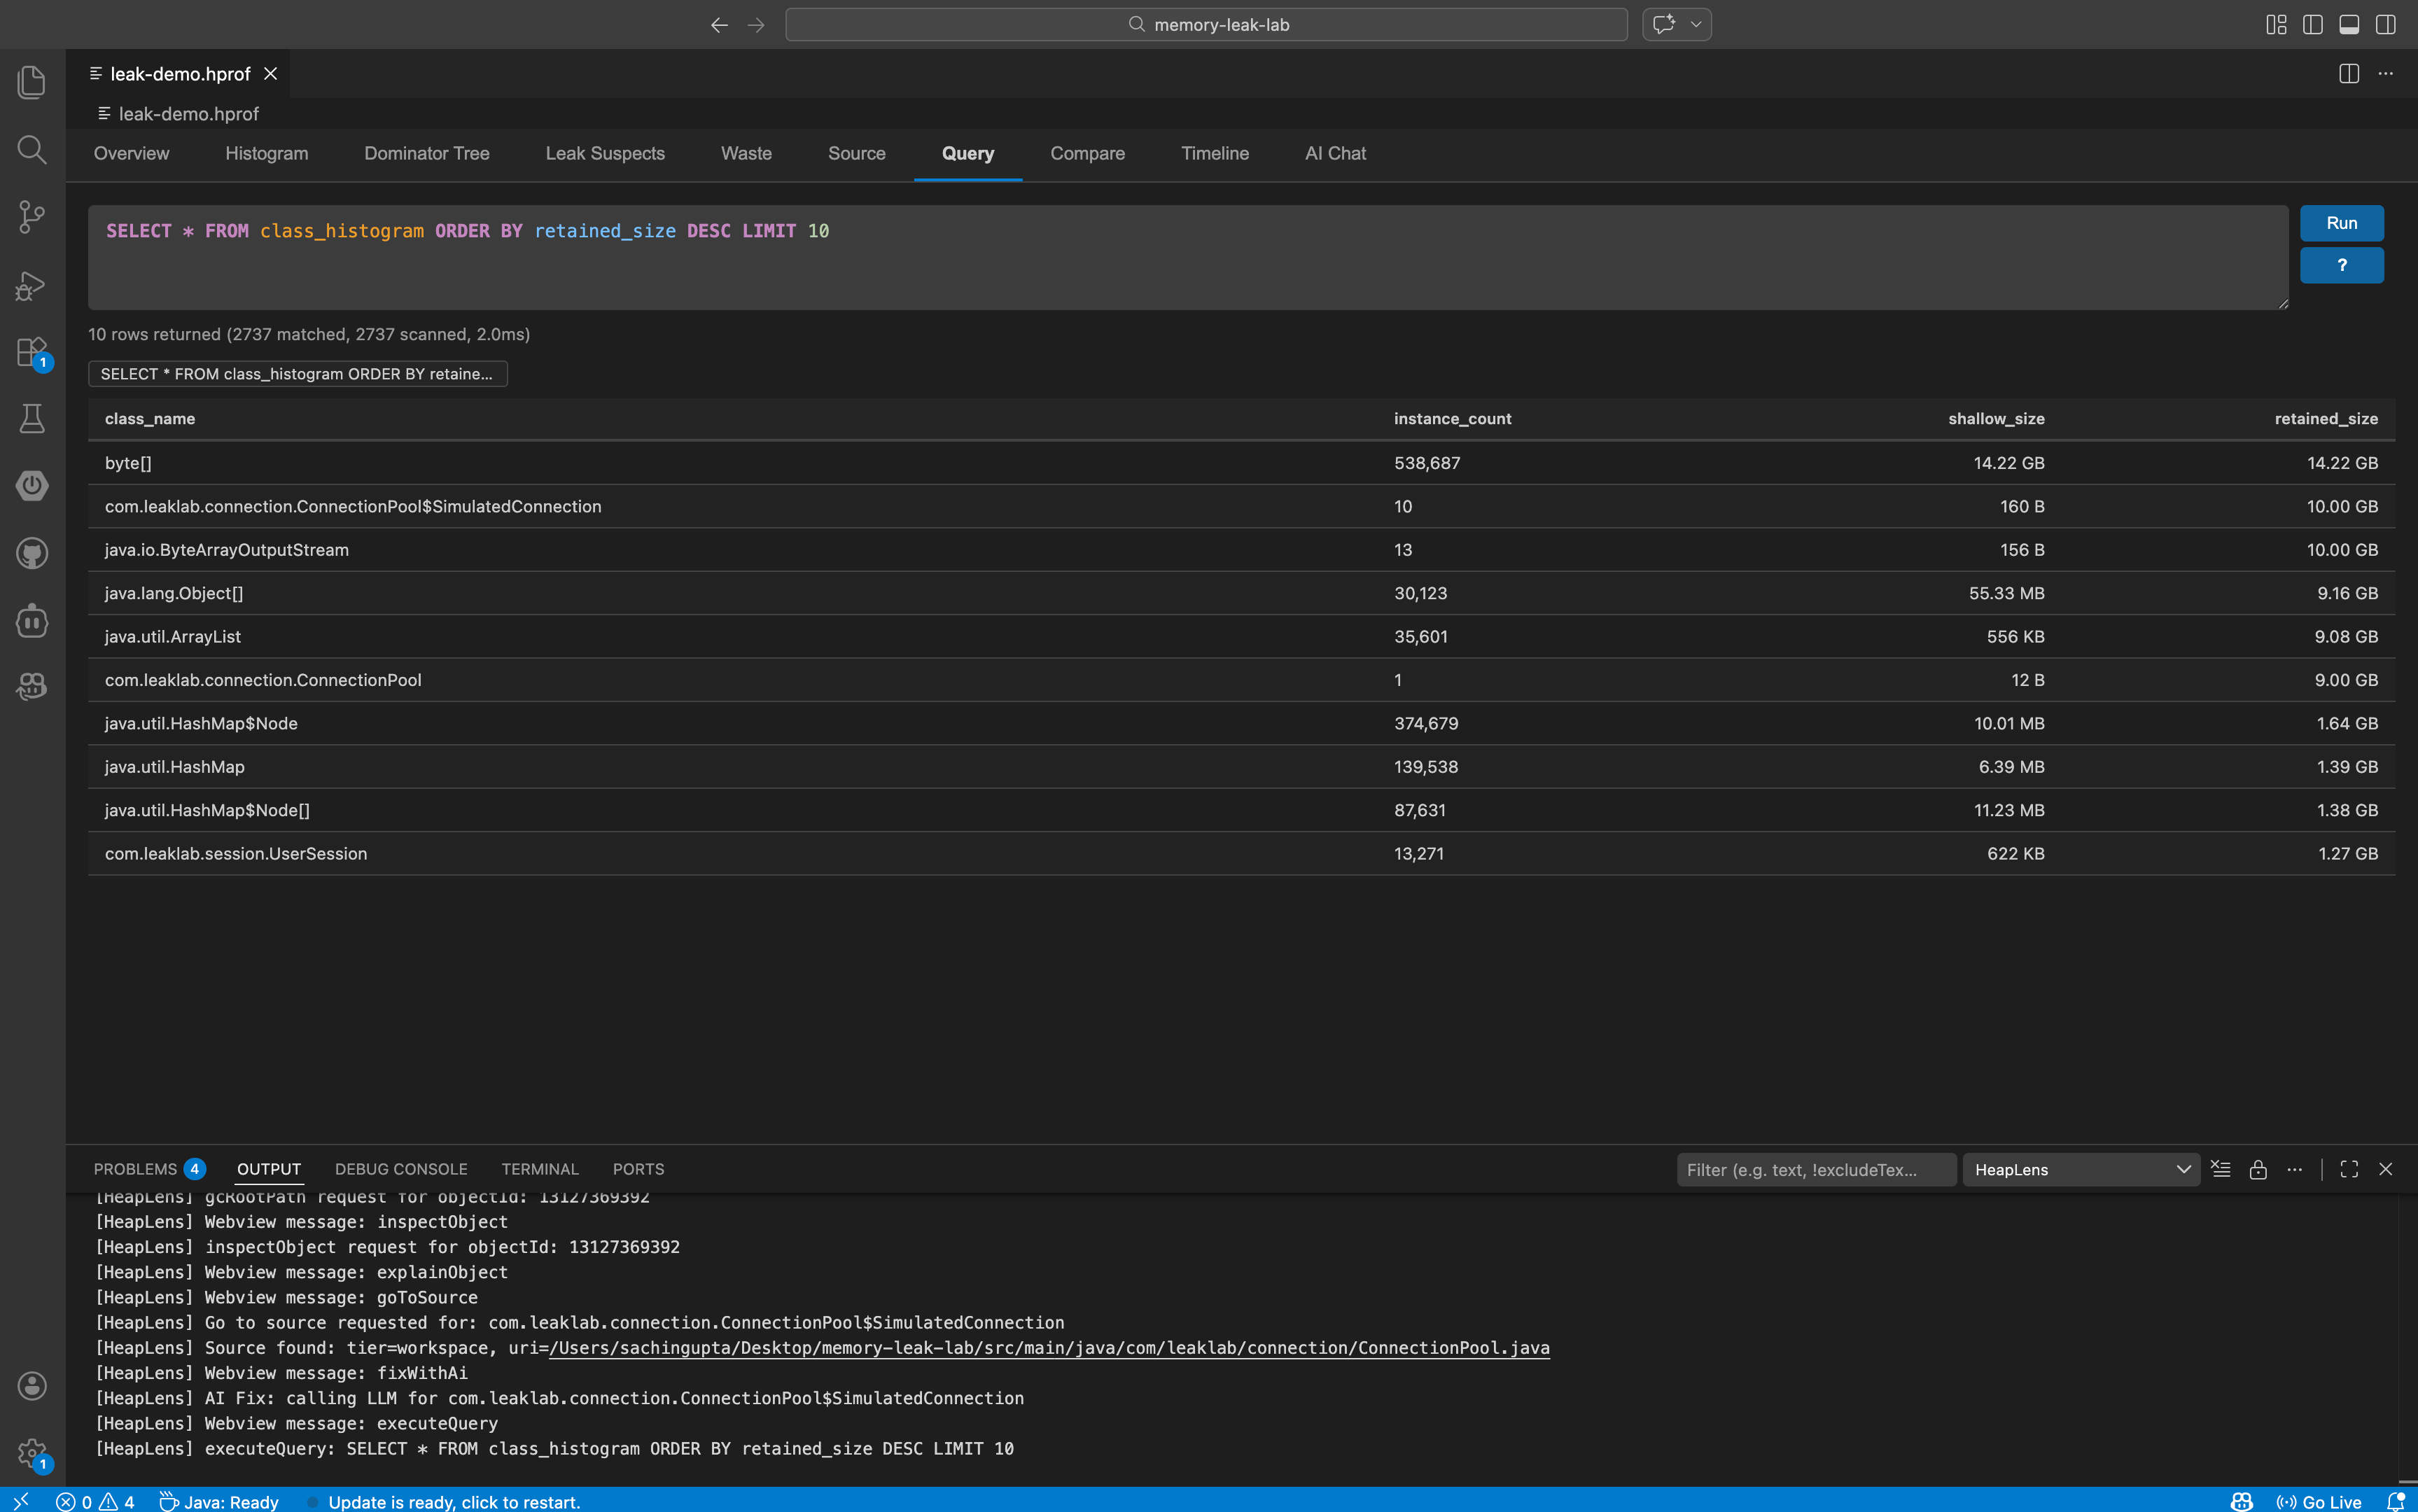
| Query |
HeapQL: SQL-like queries with autocomplete, syntax highlighting, and query history |
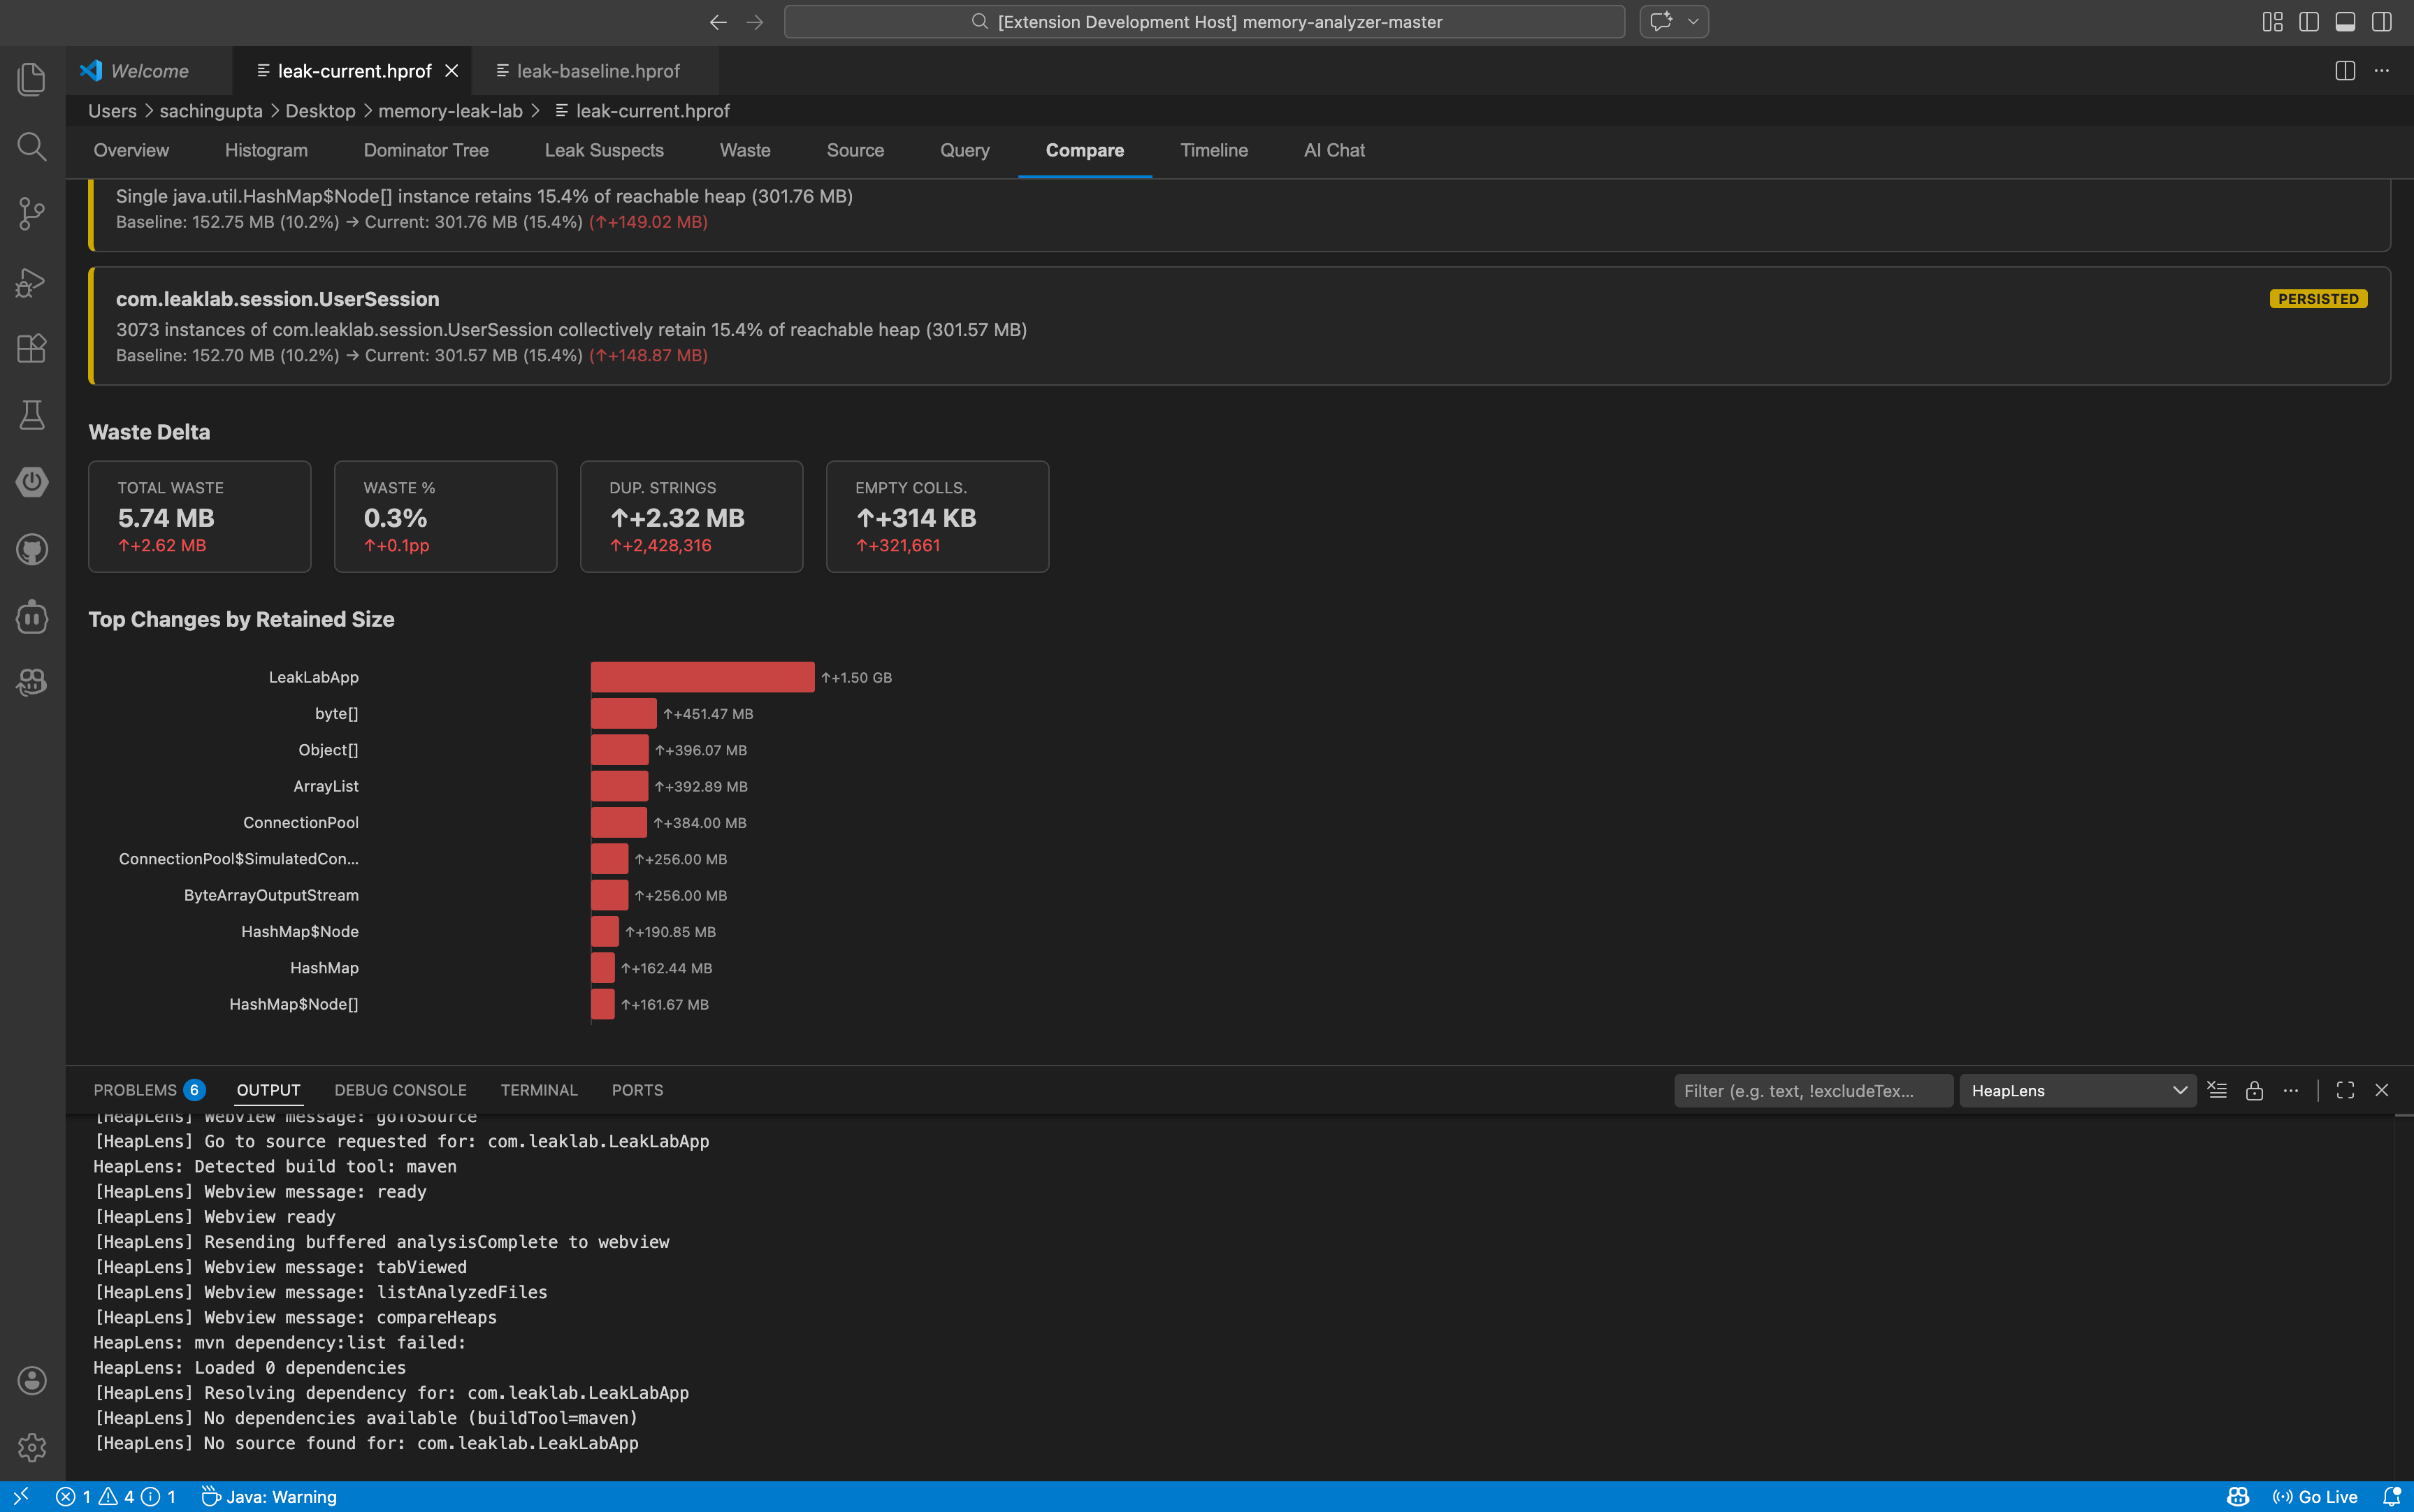
| Compare |
Diff two heap dumps — class deltas, leak changes, waste delta, export as markdown or CSV |
| Timeline |
Multi-snapshot trend analysis with D3.js line charts |
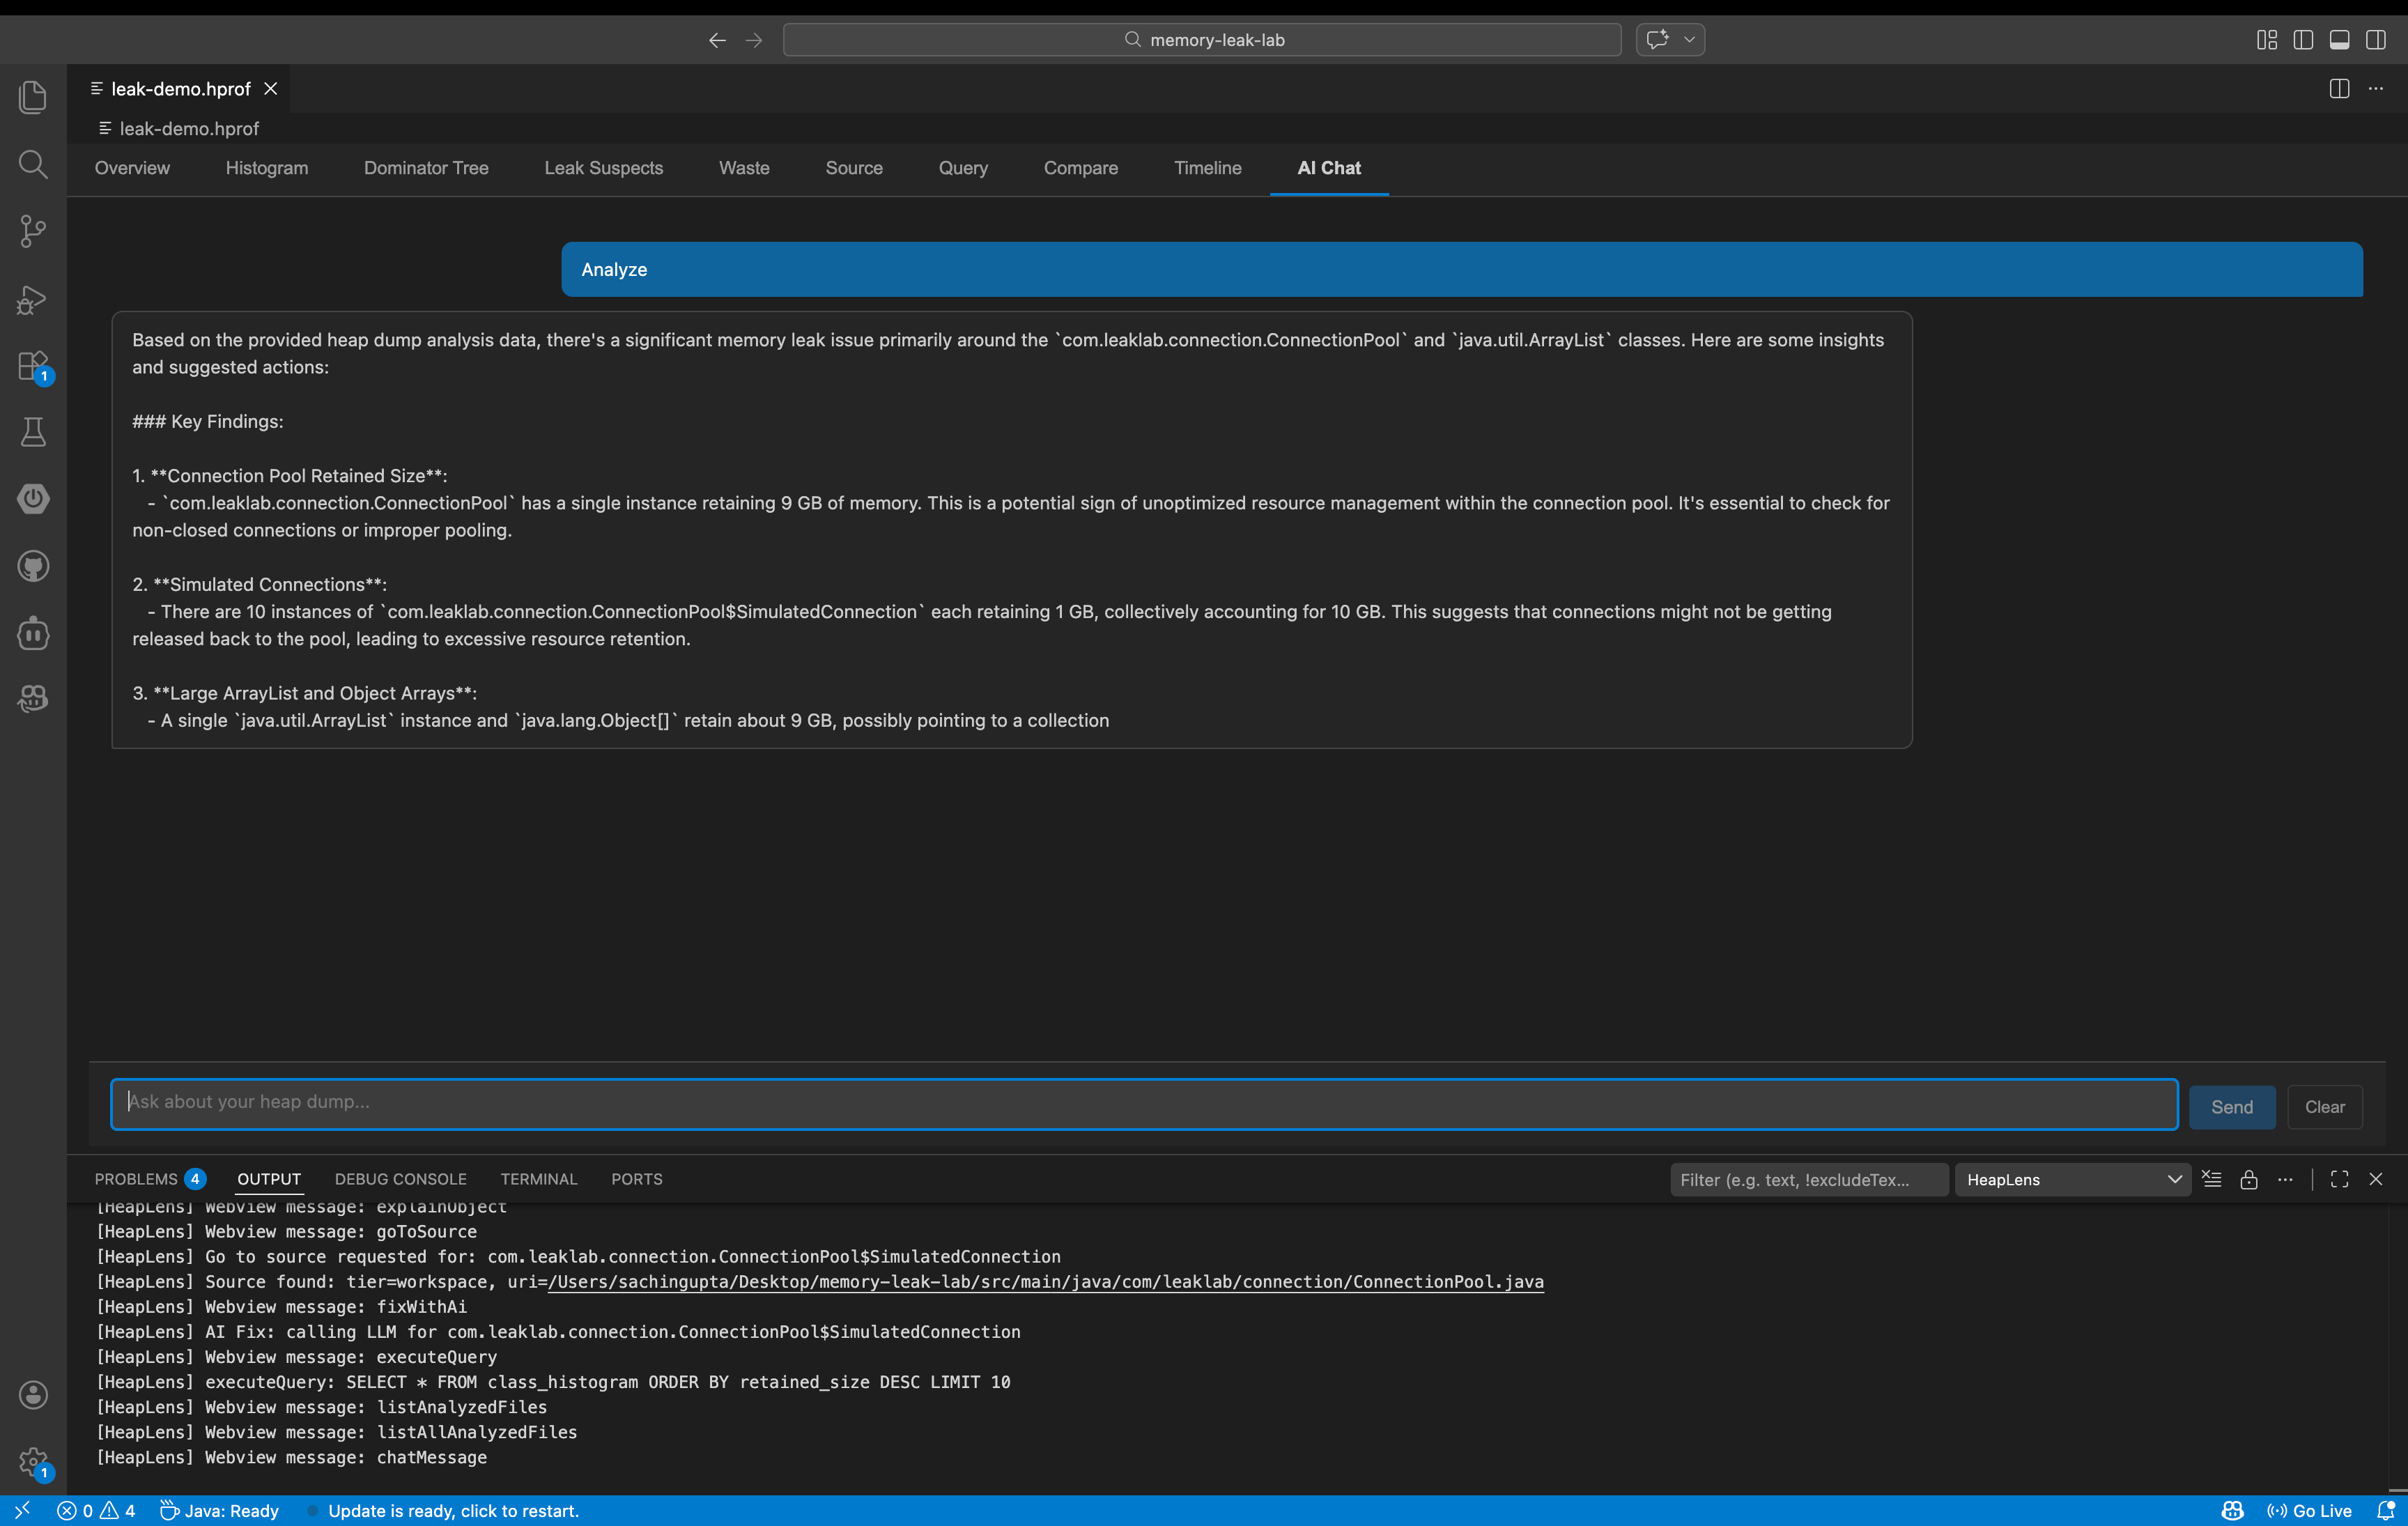
| AI Chat |
Ask questions in English — get HeapQL queries and insights |
Dominator Tree Actions
Every node in the dominator tree has one-click actions:
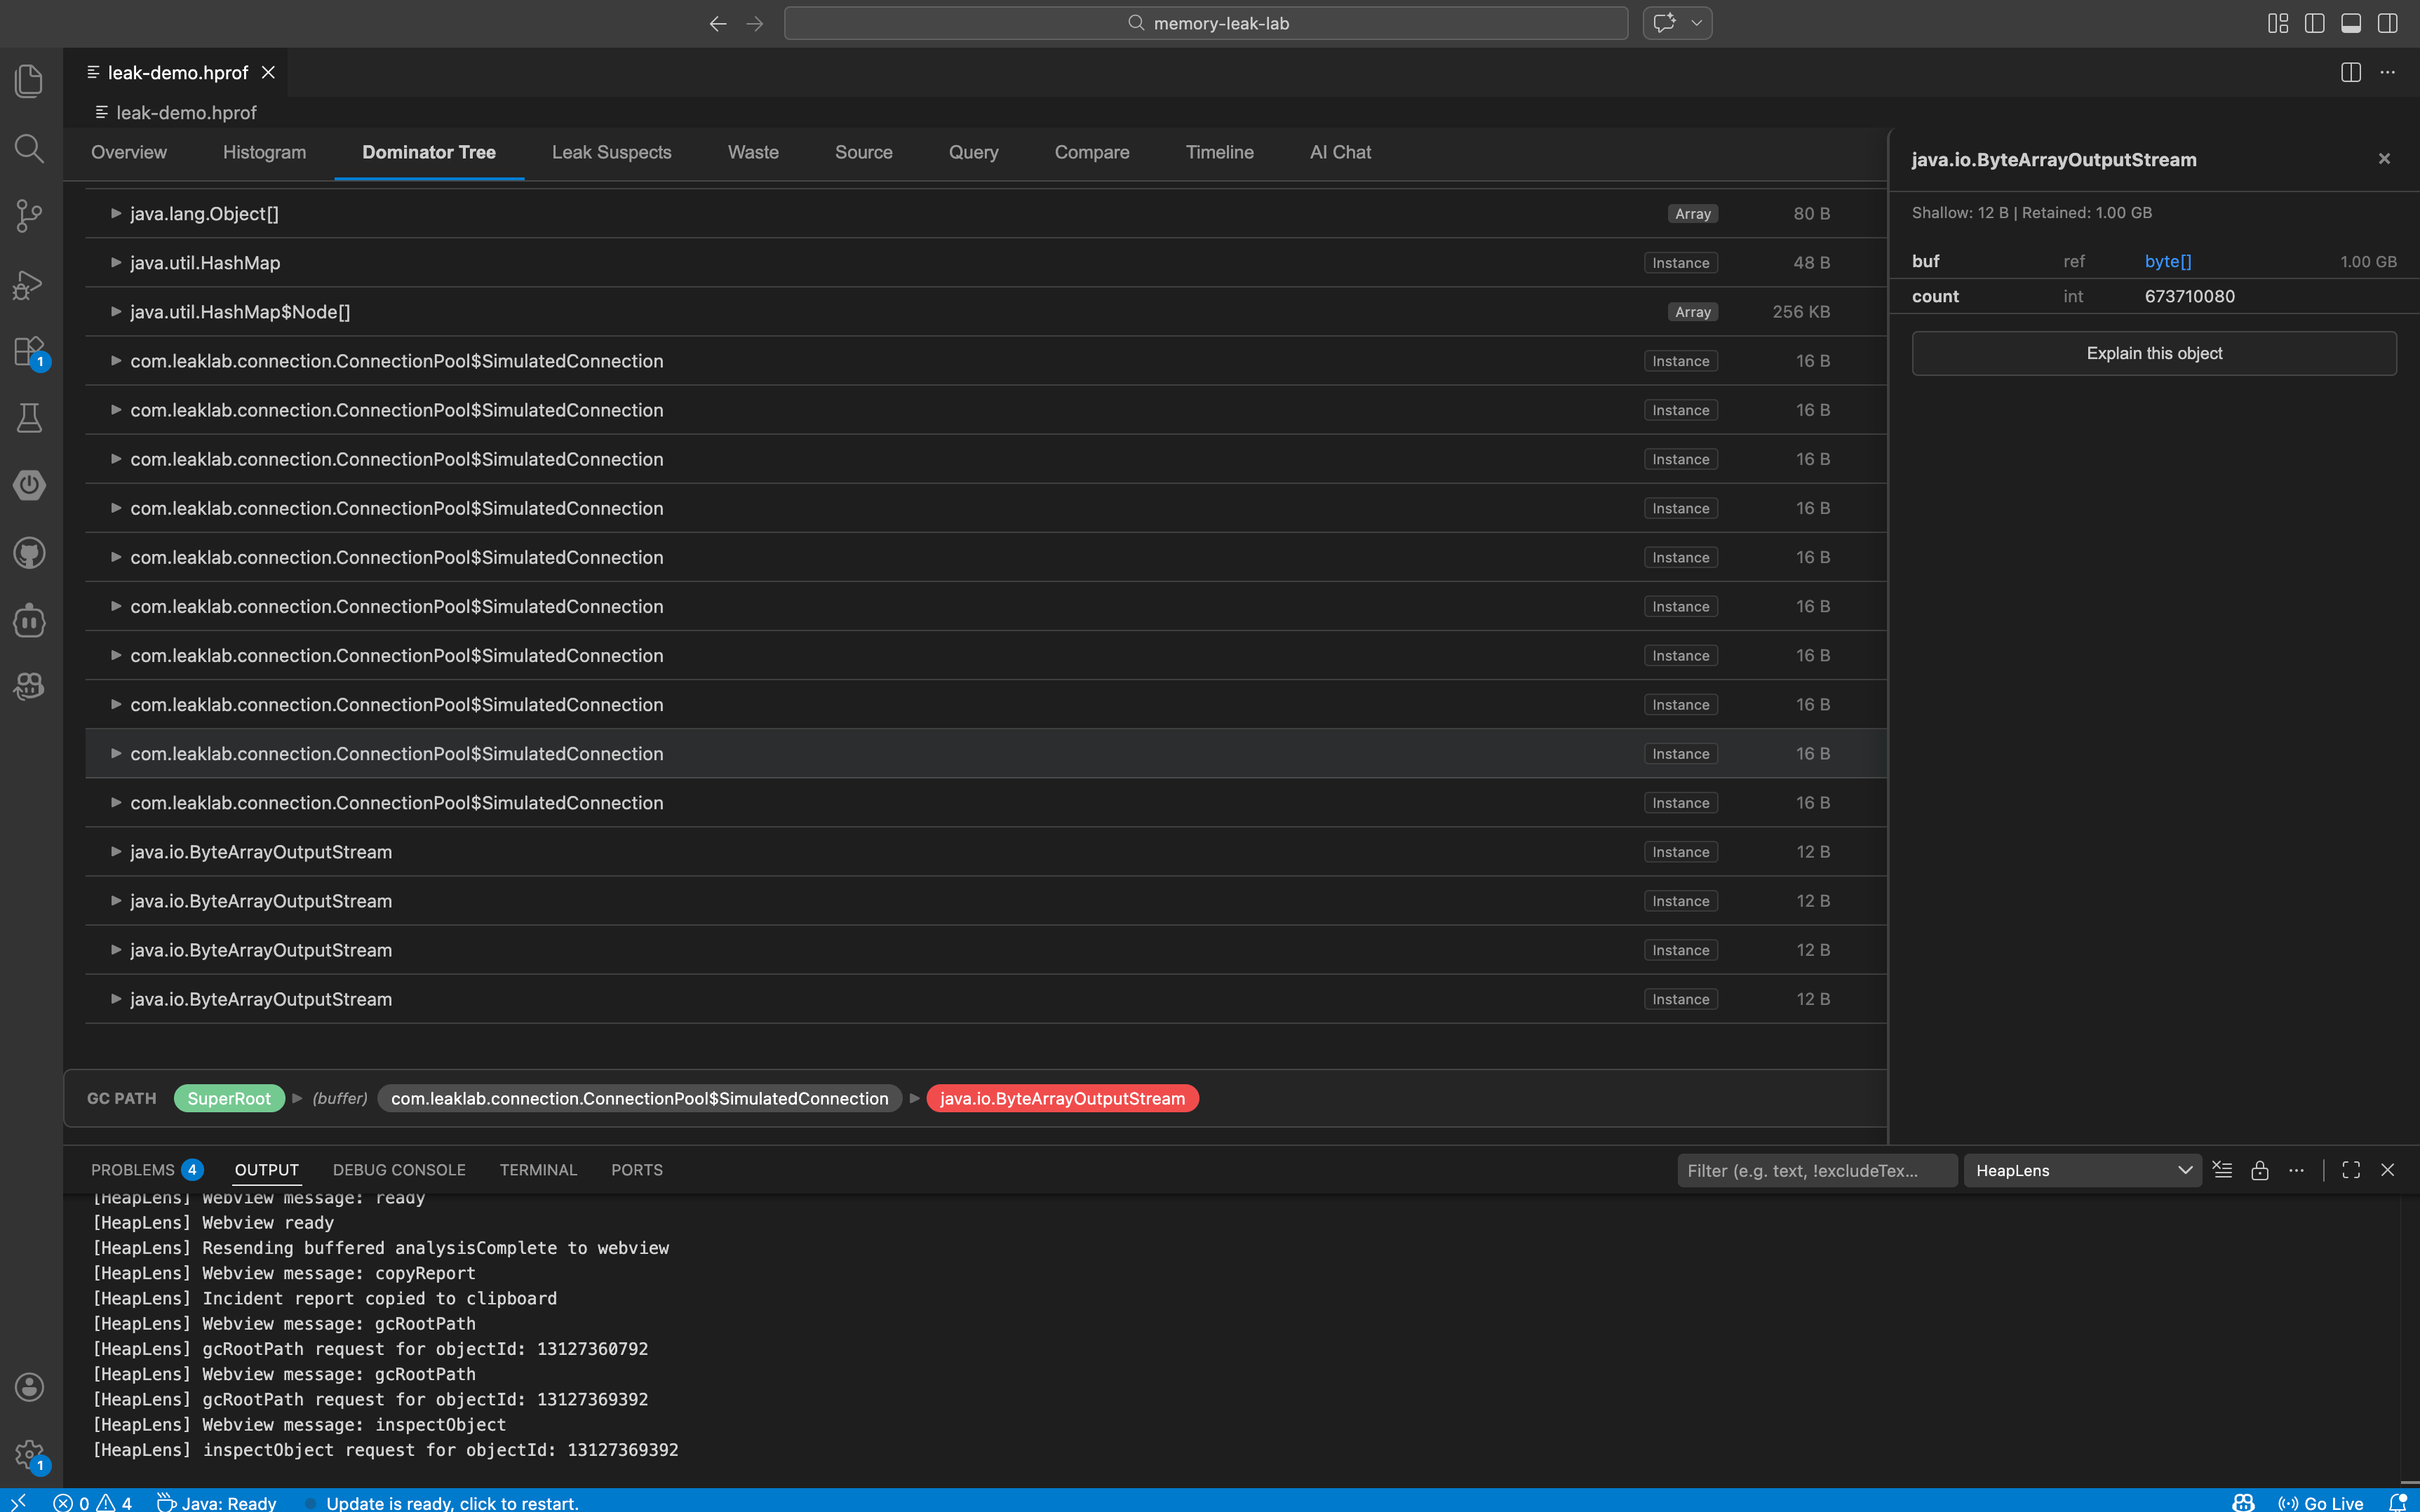
- Why alive? — shows the shortest GC root path as a breadcrumb
- Inspect — opens a field-level inspector panel with primitive values and reference links
- Go to source — jumps to the
.java file (workspace, dependency JAR, or decompiled)
- Show referrers — "Who references this object?" with recursive drill-down
HeapQL Query Language
A SQL-like language purpose-built for heap analysis:
-- Find all HashMaps retaining more than 1MB
SELECT * FROM instances
WHERE class_name = 'java.util.HashMap' AND retained_size > 1MB
ORDER BY retained_size DESC

-- Top 10 classes by total retained size (with column aliases)
SELECT class_name, COUNT(*) AS instance_count, SUM(retained_size) AS total_retained
FROM class_histogram
GROUP BY class_name
ORDER BY total_retained DESC LIMIT 10

-- JOIN instances with class histogram
SELECT * FROM instances i
JOIN class_histogram c ON class_name = class_name
WHERE i.retained_size > 1MB LIMIT 10

-- Subquery: objects larger than average
SELECT * FROM instances
WHERE retained_size > (SELECT AVG(retained_size) FROM instances)
ORDER BY retained_size DESC LIMIT 10

-- GC root path for a specific object
:path 123456789

-- Who references this object?
:refs 123456789
- Tables:
instances, class_histogram, dominator_tree, leak_suspects
- JOINs:
INNER JOIN, LEFT JOIN with table aliases
- Aggregates:
COUNT, SUM, AVG, MIN, MAX with AS aliases
- Subqueries:
WHERE col IN (SELECT ...), WHERE col > (SELECT AVG(...) FROM ...)
- Size literals:
1KB, 5MB, 1GB
AI-Powered Analysis
Configure any of the 10 supported LLM providers and ask questions in the AI Chat tab. Supports Anthropic, OpenAI, Google Gemini, DeepSeek, Mistral, Groq, xAI (Grok), Together AI, OpenRouter, and Ollama (local):
"What's causing the high memory usage?"
"Show me the top 10 classes by retained size"
"Why is this HashMap so large?"
The LLM responds with explanations and runnable HeapQL queries. Click Run Query to execute them inline.
Instance Enumeration
Click any class name in the Histogram tab to see all instances of that class. Each instance row has action buttons for inspect, show referrers, and "Why alive?" — no need to manually write queries.
Source Code Bridge
Three-tier source resolution:
- Workspace — finds
.java files in your project
- Dependencies — extracts from Maven/Gradle source JARs (
~/.m2, ~/.gradle)
- Decompilation — falls back to CFR decompiler when source JARs are unavailable
Waste Detection
Finds memory waste patterns automatically:
- Duplicate strings — identical string values held multiple times
- Empty collections —
HashMap, ArrayList, etc. with zero elements
- Over-allocated collections — arrays sized far beyond their element count
- Boxed primitives —
Integer, Long, etc. that could be primitive
Snapshot Comparison & Timeline
- Compare two heap dumps: summary delta, class-level growth/shrinkage with change badges, leak suspect changes (new/resolved/persisted), waste delta, and a D3.js bar chart of top changes.
- Copy Report copies a full markdown diff report to clipboard.
- Export CSV saves all class changes to a file.
- Timeline multiple snapshots: track heap growth trends over time with interactive charts.
Getting Started
- Install HeapLens from the VS Code Marketplace
- Open any
.hprof file — HeapLens activates automatically
- Explore the 10 tabs: Overview for a summary, Histogram to find big classes, Dominator Tree to drill down
Generate a Heap Dump
# From a running JVM
jmap -dump:format=b,file=heap.hprof <pid>

# On OutOfMemoryError (add to JVM args)
-XX:+HeapDumpOnOutOfMemoryError -XX:HeapDumpPath=./heap.hprof

# Android (via adb)
adb shell am dumpheap <pid> /data/local/tmp/heap.hprof
adb pull /data/local/tmp/heap.hprof
AI Chat Setup (Optional)
- Go to Settings > search
heaplens.llm
- Set
heaplens.llm.provider to your preferred provider (Anthropic, OpenAI, Gemini, DeepSeek, Mistral, Groq, xAI, Together AI, OpenRouter, or Ollama)
- Set
heaplens.llm.apiKey to your API key (not needed for Ollama)
- Open the AI Chat tab and start asking questions
Settings
| Setting |
Default |
Description |
heaplens.llm.provider |
anthropic |
LLM provider (anthropic, openai, gemini, deepseek, mistral, groq, xai, together, openrouter, ollama) |
heaplens.llm.apiKey |
— |
API key for the LLM provider |
heaplens.llm.baseUrl |
— |
Custom API base URL (for proxies or self-hosted) |
heaplens.llm.model |
— |
Model name override |
heaplens.sourceResolution.enabled |
true |
Enable dependency source JAR resolution |
heaplens.sourceResolution.mavenHome |
— |
Custom Maven repository path |
heaplens.sourceResolution.gradleHome |
— |
Custom Gradle cache path |
heaplens.sourceResolution.decompilerEnabled |
true |
Enable CFR decompilation fallback |
Architecture
VS Code Extension (TypeScript)
  └─ HprofEditorProvider (custom editor for .hprof)
      └─ RustClient (JSON-RPC 2.0 over stdin/stdout)
          └─ hprof-server (async Rust + tokio)
              └─ Analysis engine (petgraph dominator tree,
                 HeapQL query engine, waste analysis)
- Rust engine — two-phase architecture with zero-copy mmap parsing, CSR edge storage, Lengauer-Tarjan dominator tree, and rayon-parallelized edge extraction
- TypeScript extension — VS Code custom editor, webview UI, LLM integration
- MCP server —
hprof-server --mcp for use with Claude Desktop, Cline, and other AI clients
- Java HotSpot HPROF (JDK 8+) — analyze heap dumps from any JVM application, Spring Boot, microservices, or Kubernetes pods
- Android HPROF (Dalvik/ART) — debug memory leaks in Android apps directly from
adb heap dumps
- HPROF versions: 1.0.1, 1.0.2, 1.0.3
- Works with heap dumps generated by
jmap, jcmd, -XX:+HeapDumpOnOutOfMemoryError, and Android Debug Bridge
Commands
| Command |
Description |
HeapLens: Analyze HPROF File |
Open a file picker to select and analyze a .hprof file |
HeapLens: Export Analysis to JSON |
Export the current analysis results to a JSON file |
Requirements
- VS Code 1.109.0 or later
- No additional dependencies — the native Rust binary is bundled with the extension
Optional:
- Java on
PATH (for CFR decompilation fallback)
- Maven/Gradle project (for dependency source resolution)
- API key for AI Chat (Anthropic, OpenAI, Gemini, DeepSeek, Mistral, Groq, xAI, Together AI, OpenRouter, or use Ollama for free local models)
HeapLens uses a native Rust binary with a two-phase CSR architecture for parsing and analysis. Benchmarks on Apple M1 (median of 5 runs):
| Heap Size |
Analyze Time |
Throughput |
| 1.5 GB |
~0.9 s |
1,687 MB/s |
| 2 GB |
~1.2 s |
1,645 MB/s |
| 14 GB |
~10.5 s |
1,365 MB/s |
Telemetry
HeapLens collects anonymous usage telemetry (feature adoption, analysis performance, and aggregate geographic region) via Azure Application Insights to help improve the extension. Heap file contents never leave your machine. No PII, file paths, code content, or API keys are collected. Telemetry respects VS Code's telemetry.telemetryLevel setting — set it to off to disable all telemetry.
License
Apache 2.0
| |
