⚡ Kubi




Manage Kubernetes clusters in VS Code at lightning speed.
To get started just type in your terminal: code --install-extension guntiss.kubi
A look around
|
|
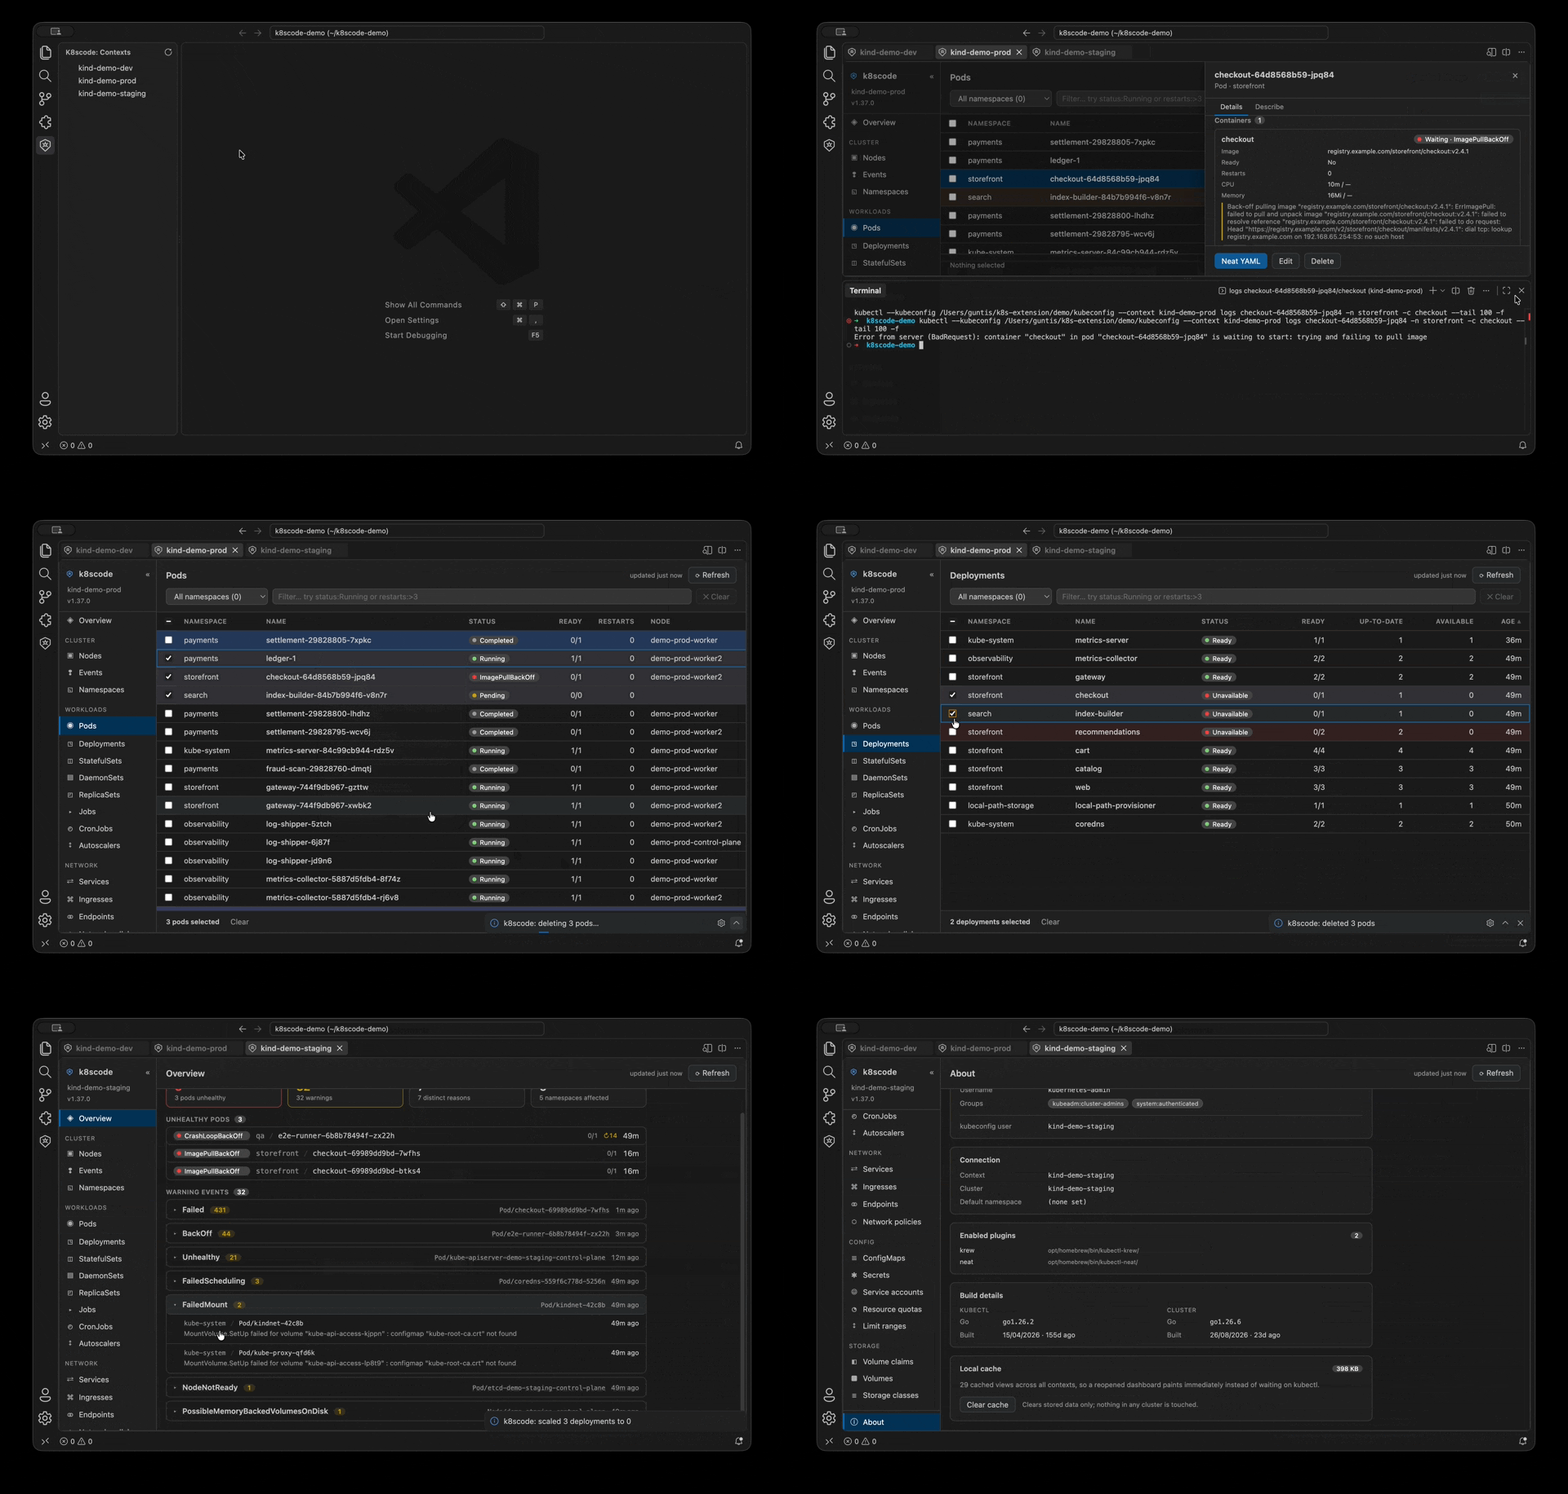
Demo — browsing, filtering and inspecting a cluster. |
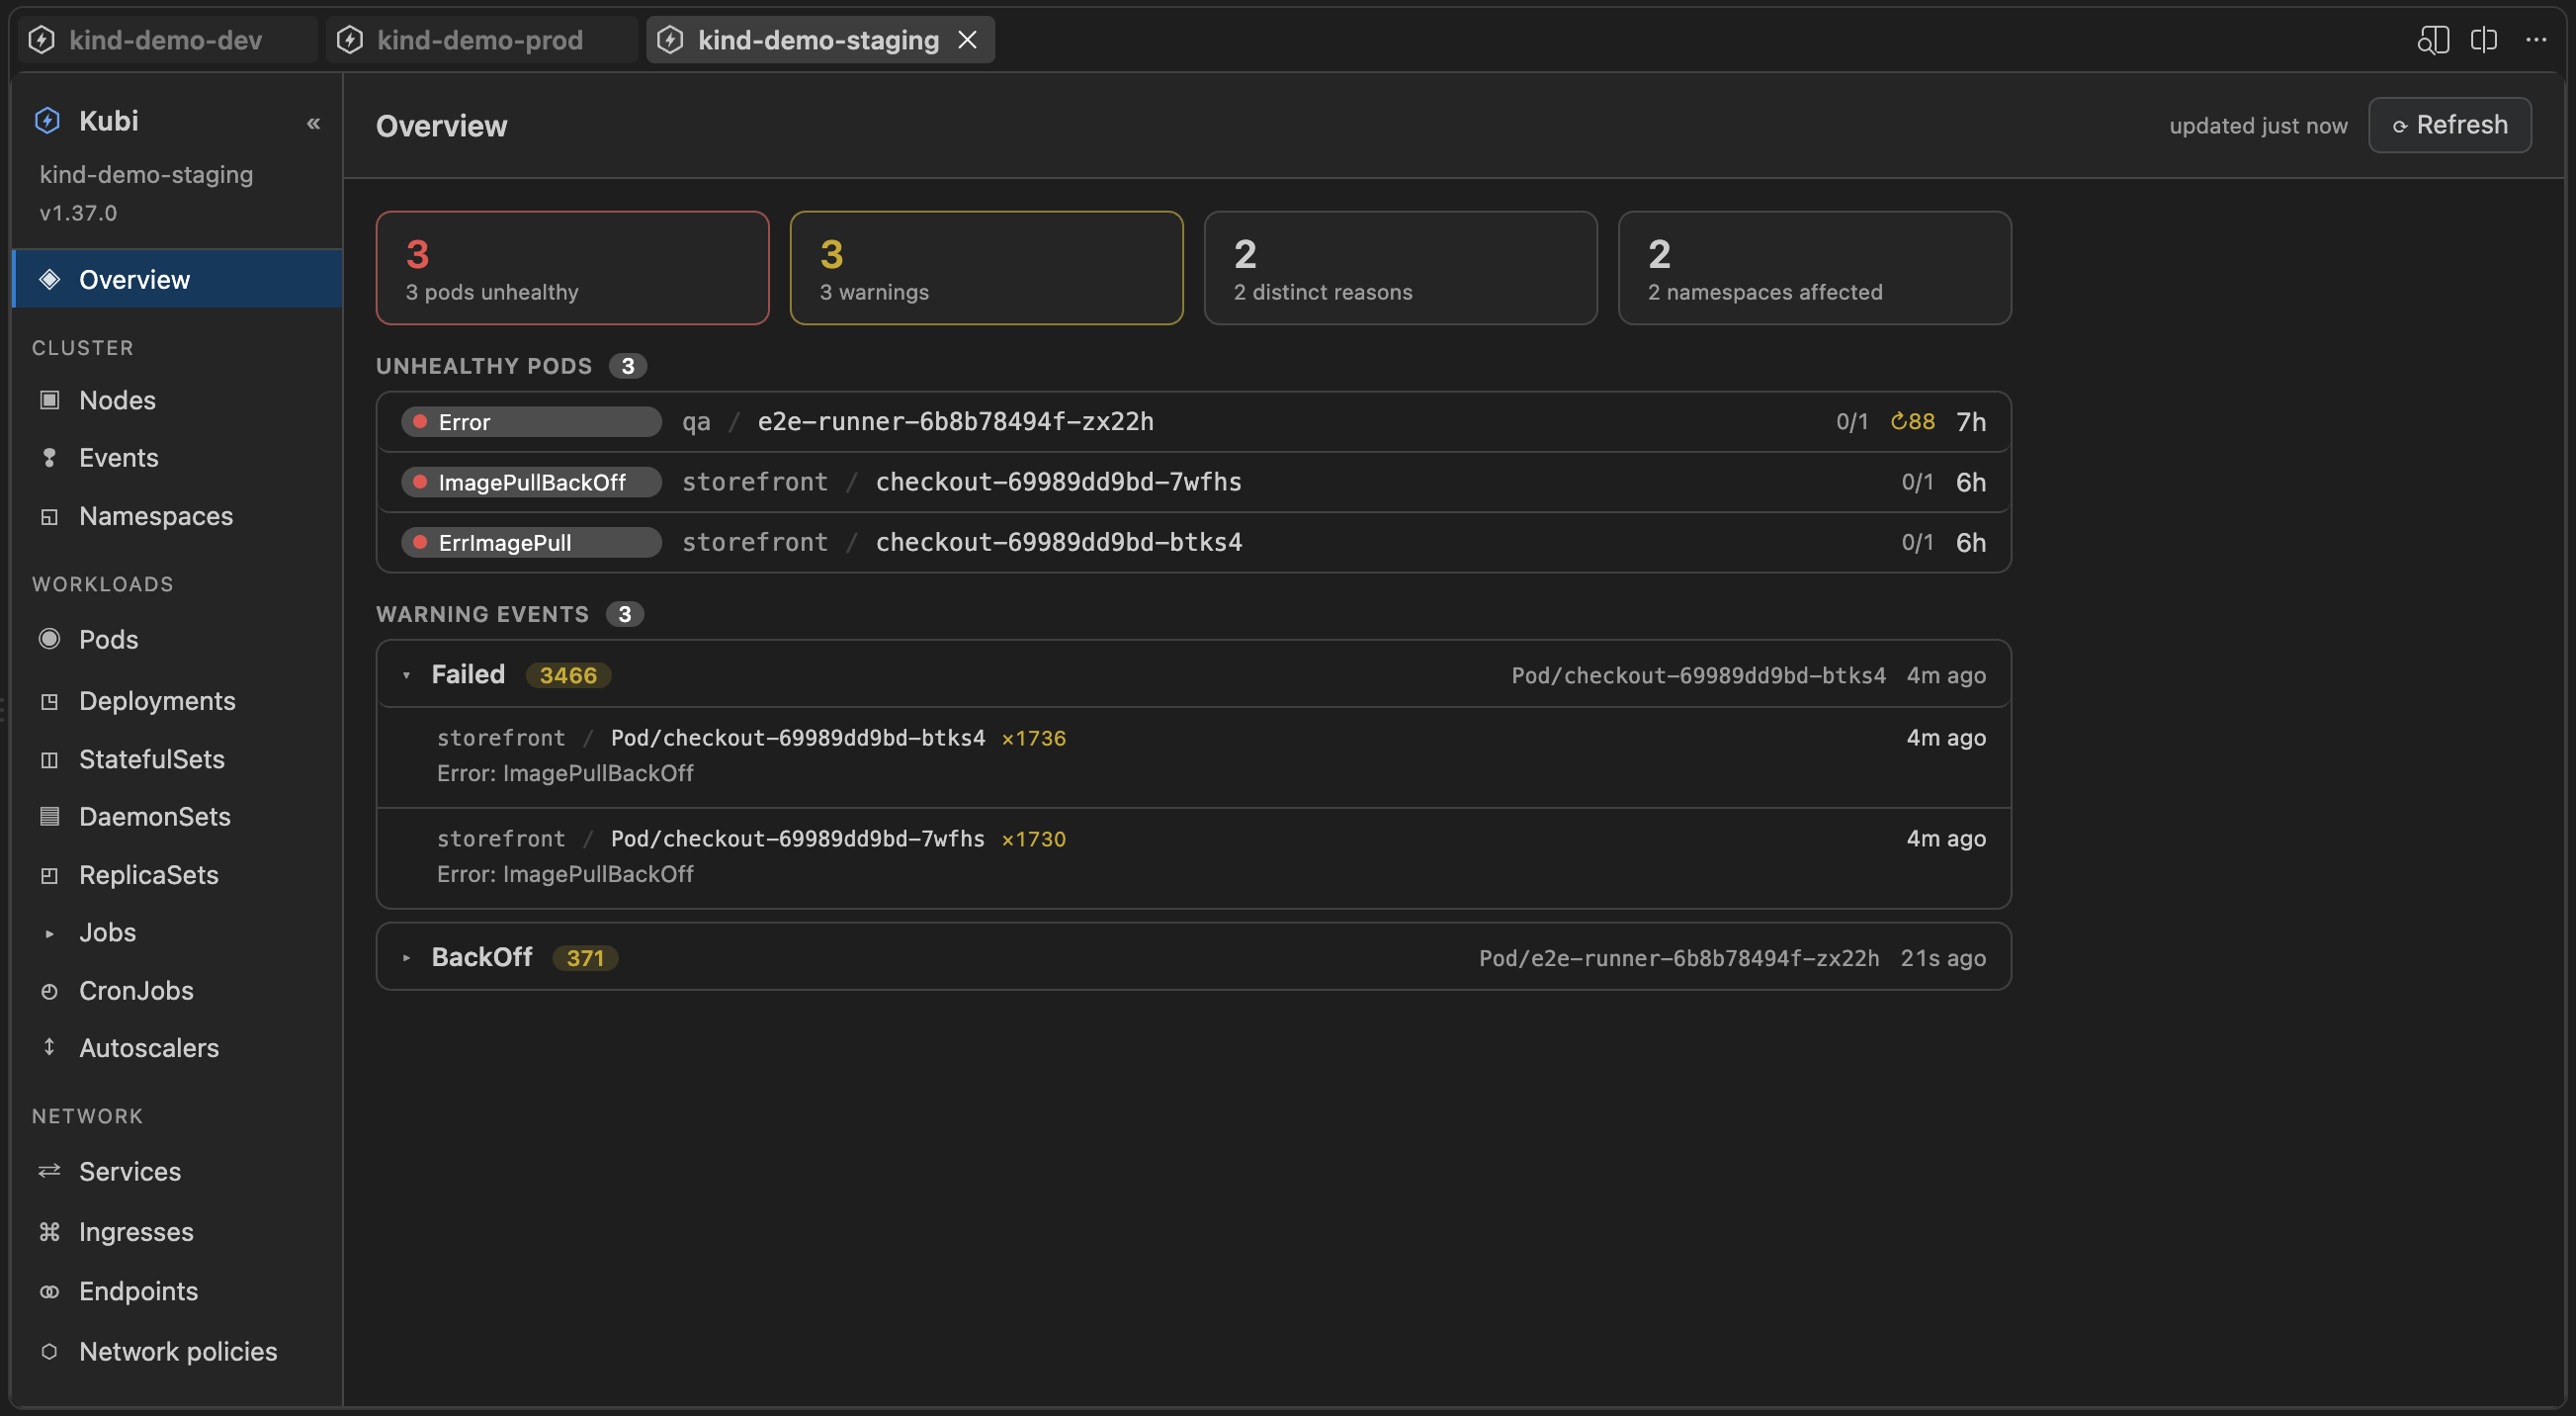
Overview — unhealthy pods and Warning events at a glance. |
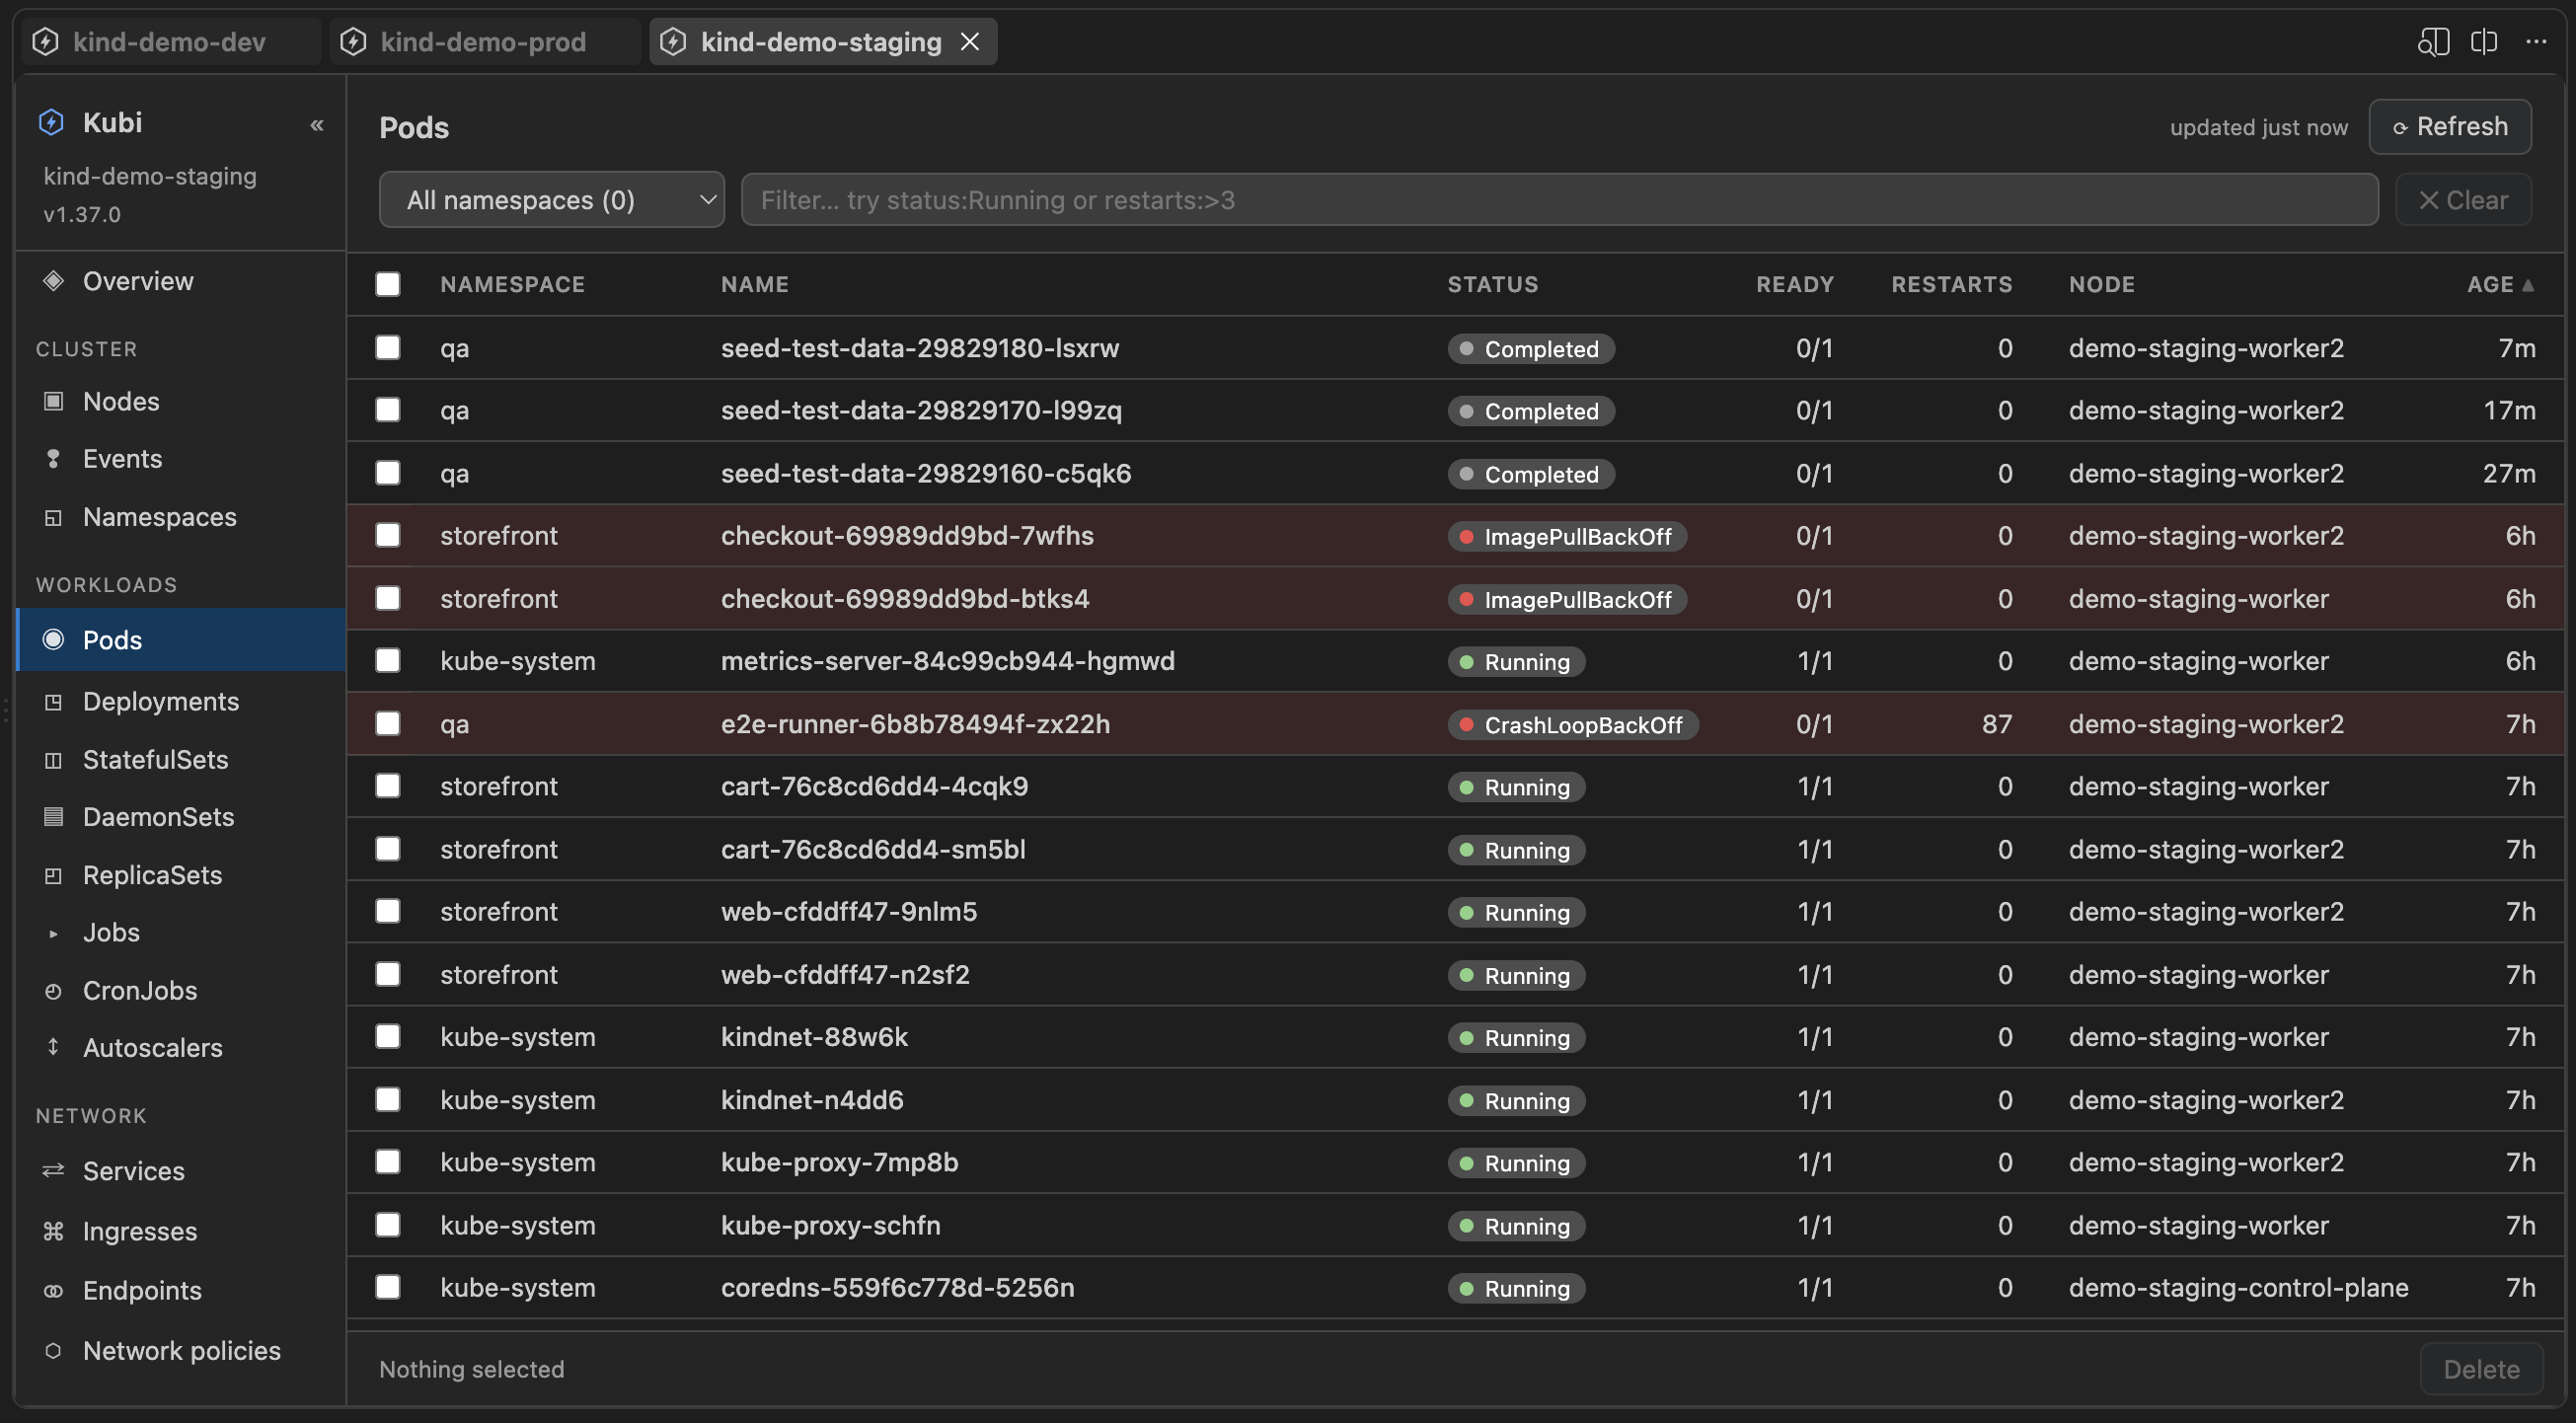
Resource tables — status pills, problem rows highlighted. |
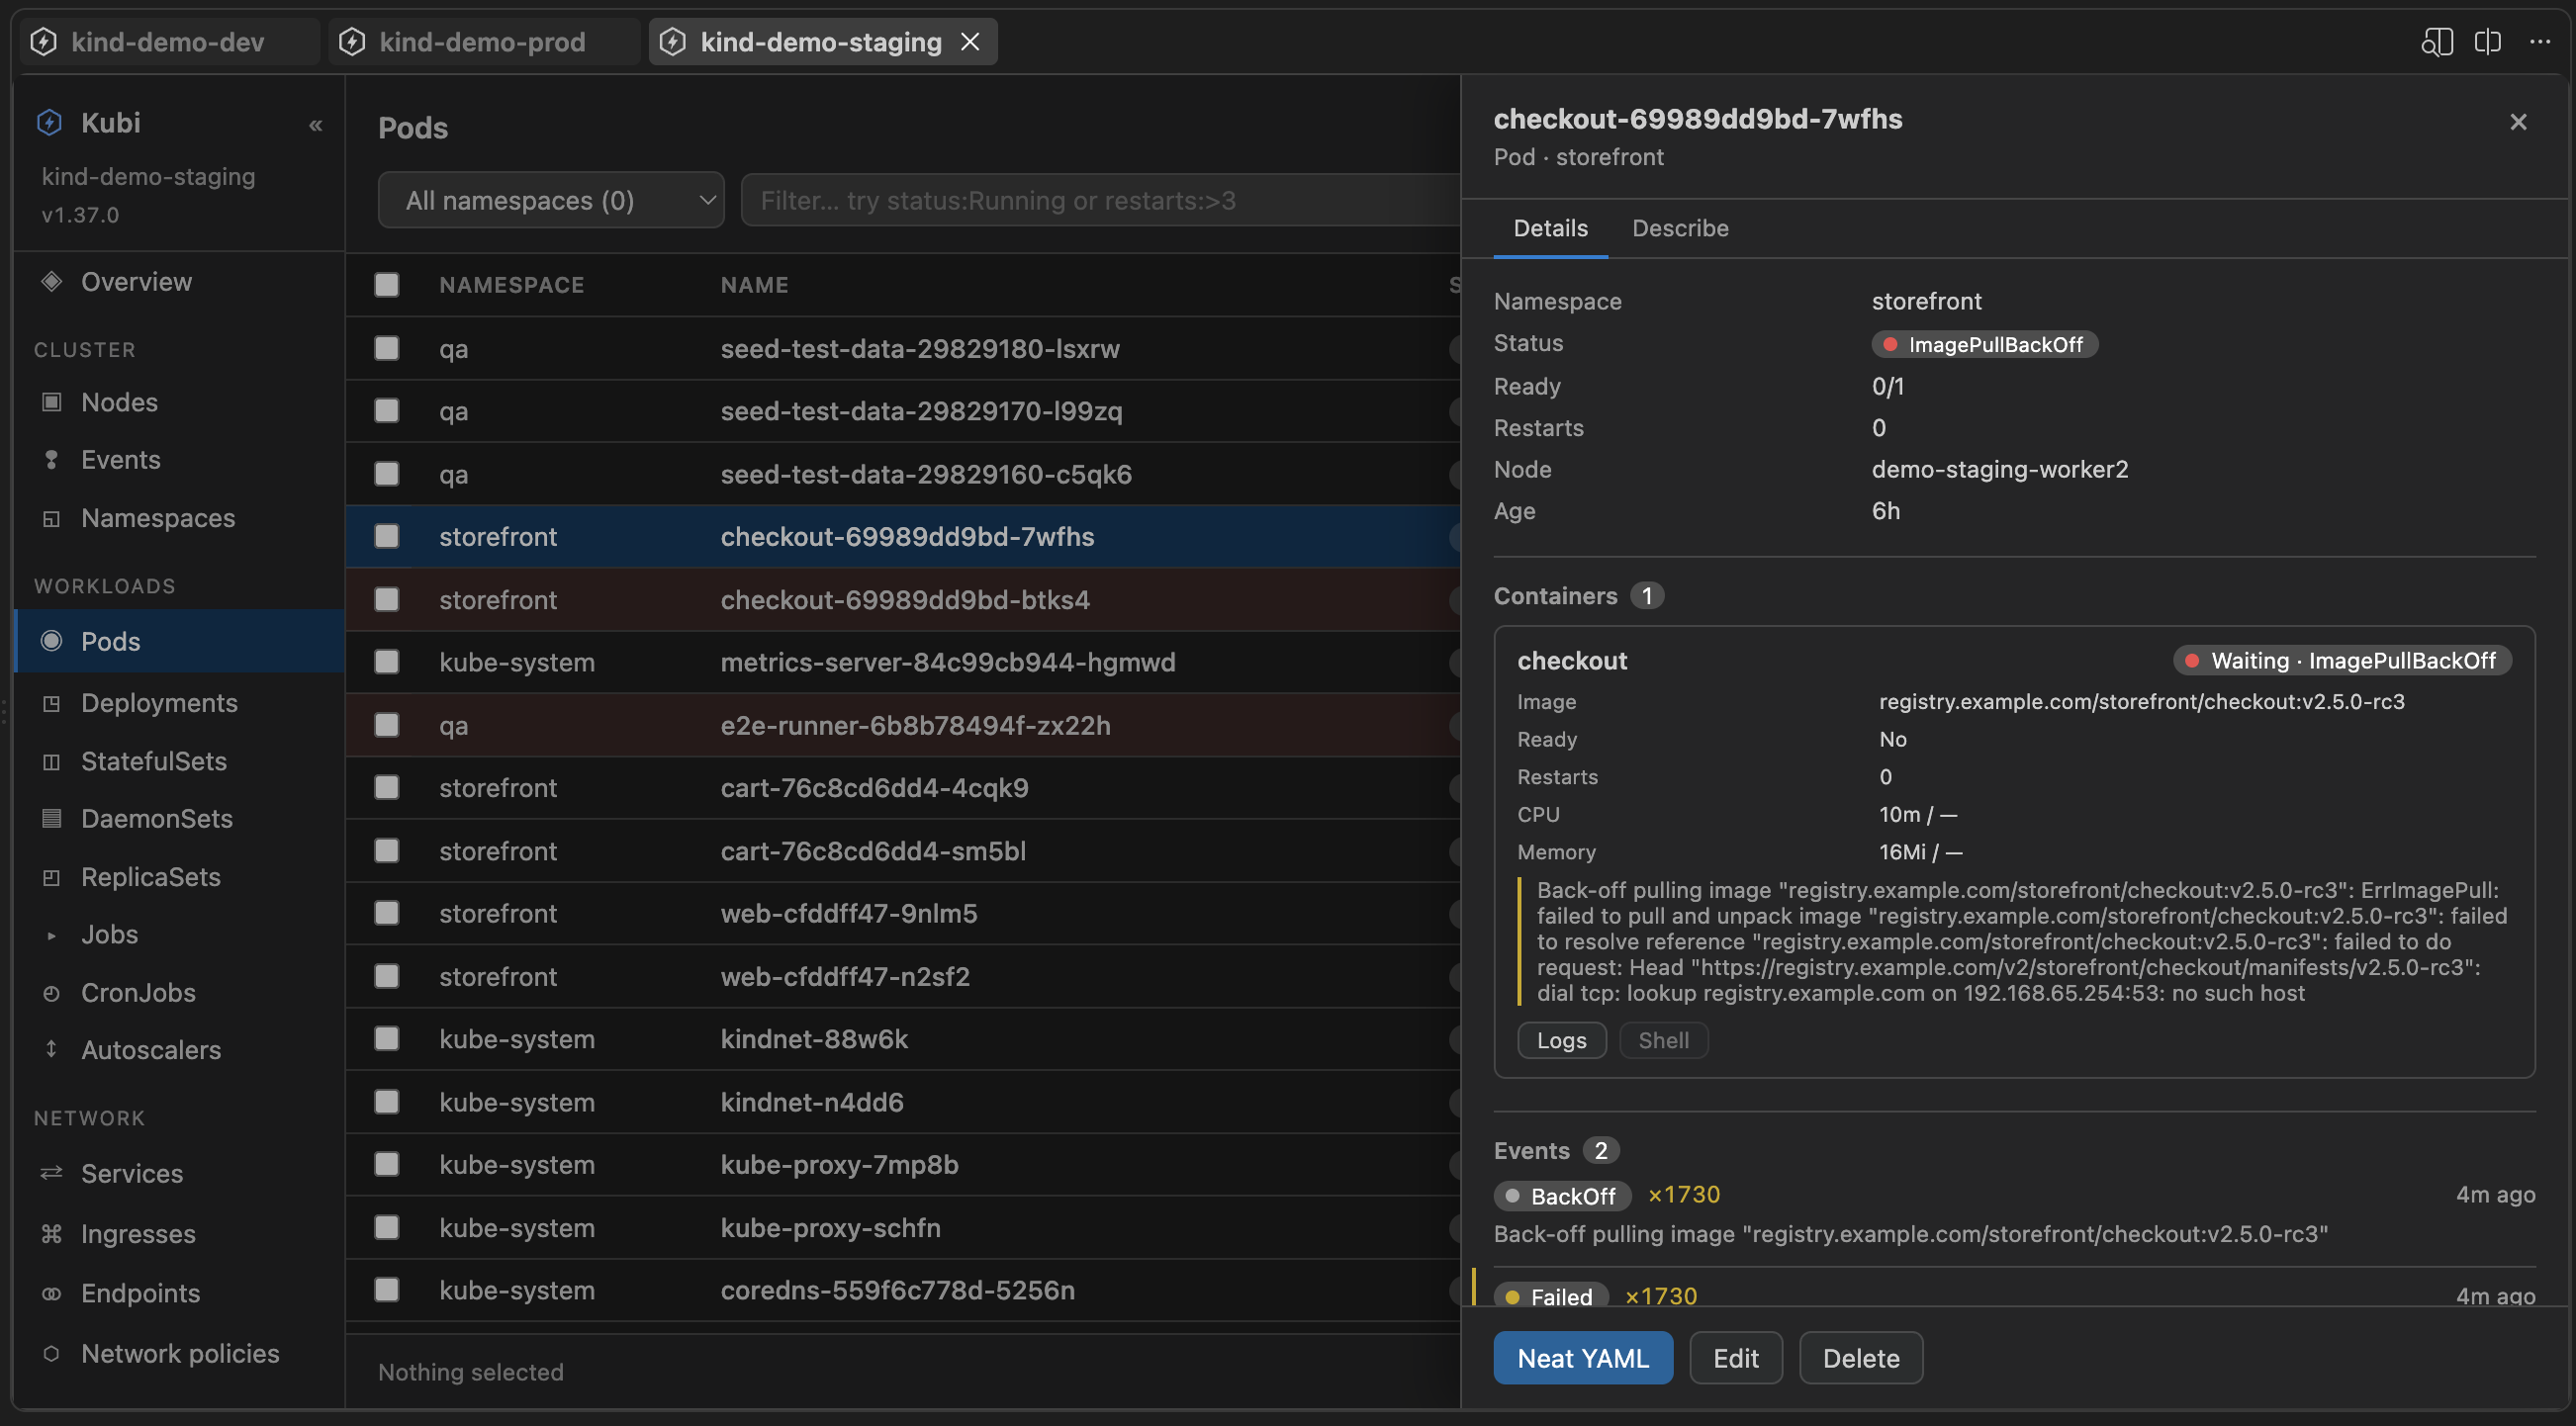
Detail drawer — container state, errors and events. |
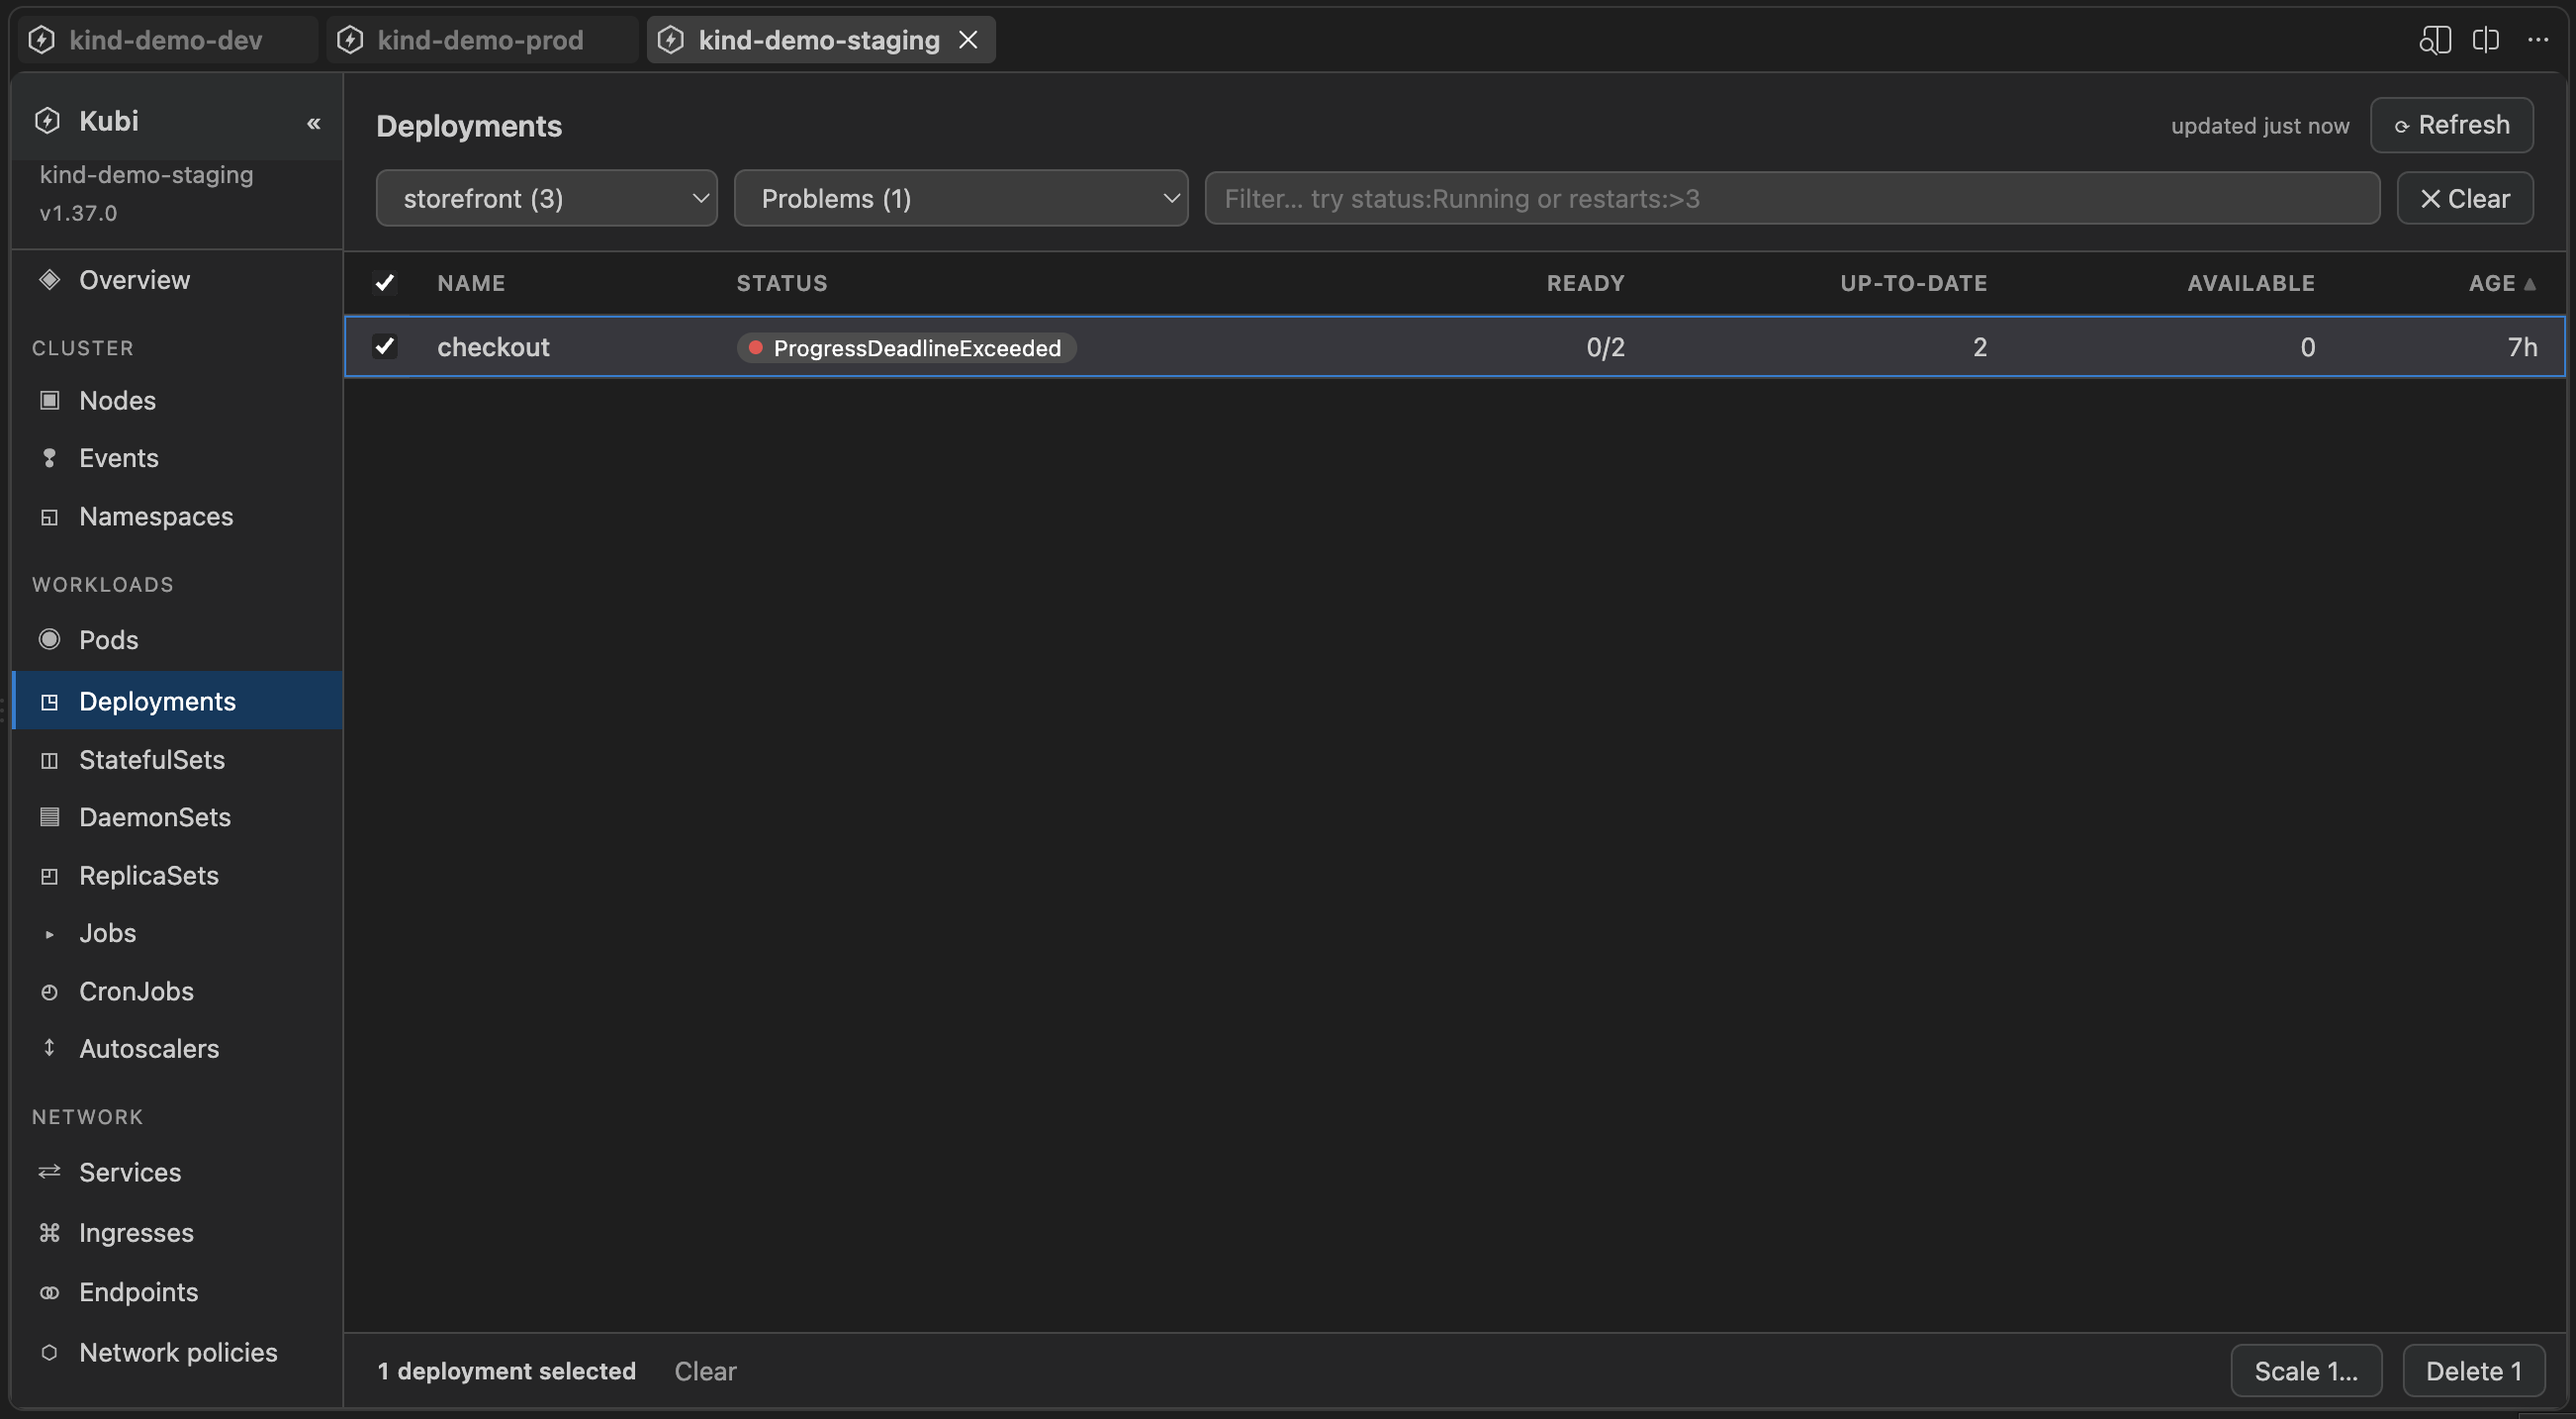
Filtering — namespace, status bucket and query, combined. |
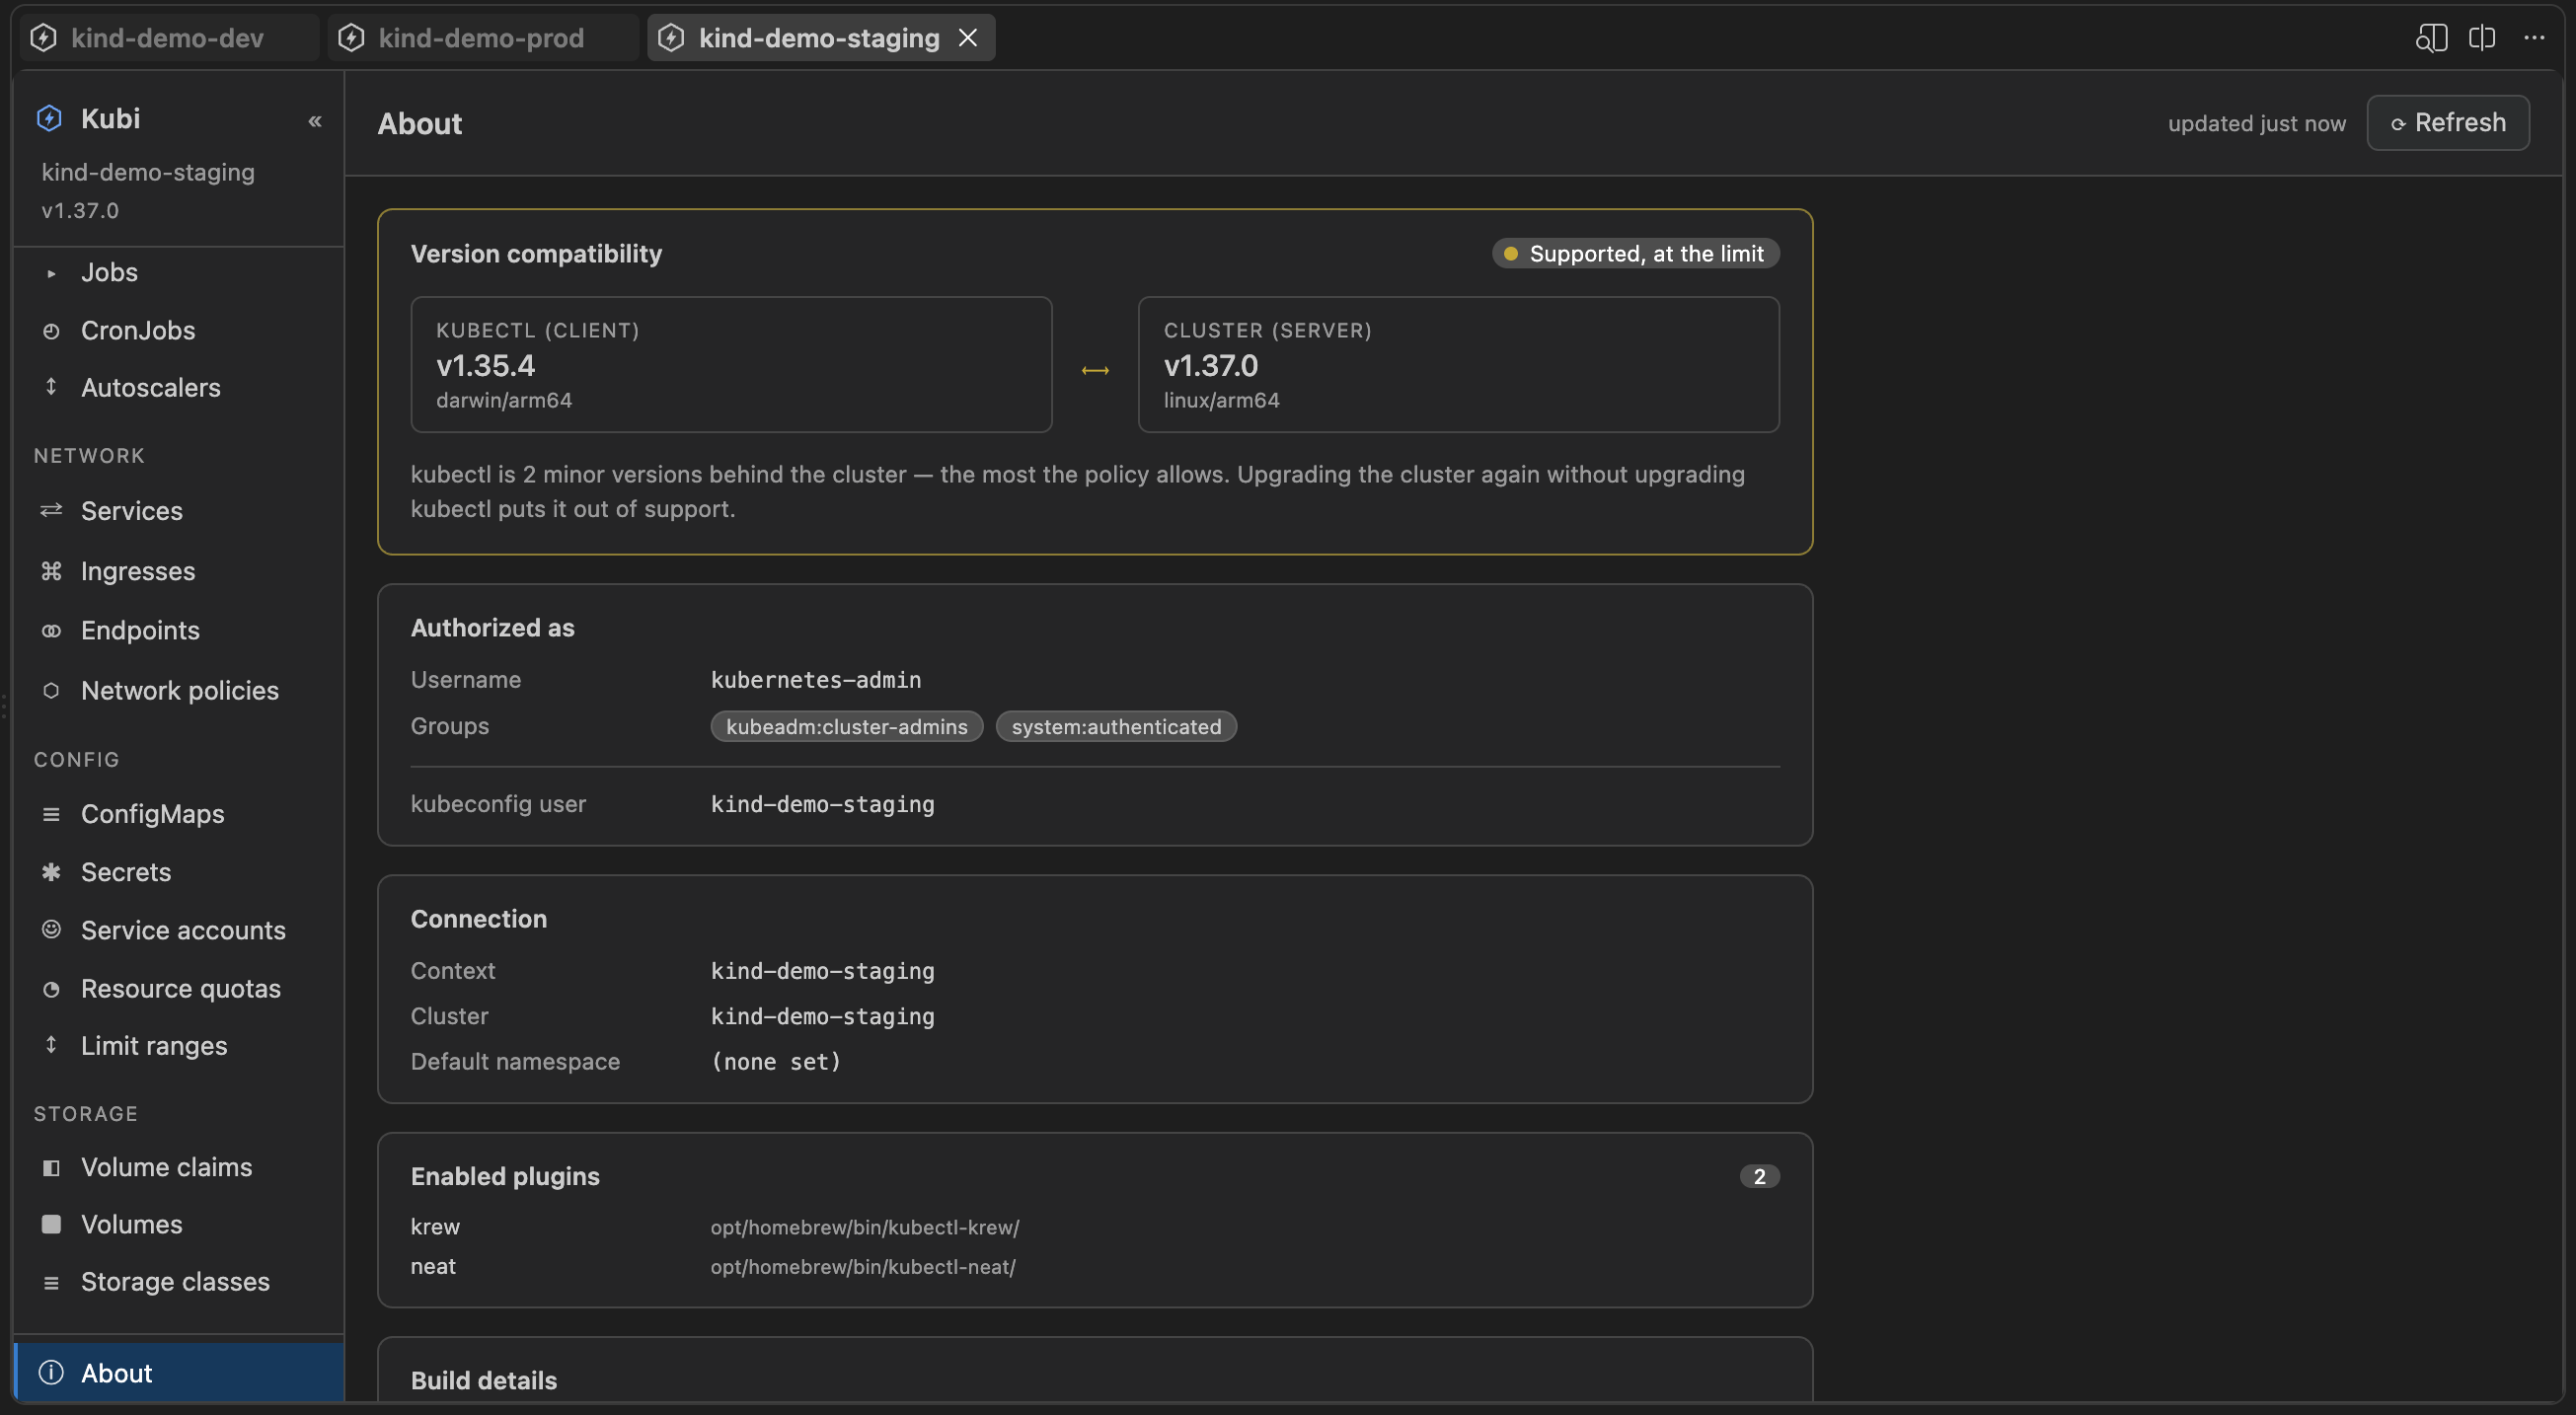
About — version skew, identity, connection, plugins. |
Why Kubi
Works out of the box. All you need is VS Code, kubectl with your existing kubeconfig, cloud SSO works out-of-the-box.
It feels super fast. Every view is cache-first, refreshes never clears the screen, steal
focus or block the UI - continue navigating, filtering while refresh happens in the background.
Everything is optimized for maximum speed and performance, filtering happens client side so it's always instant.
Notice issues faster Human friendly overview page allows seeing cluster issues at a glance, without the need to dig through each page.
Work with many clusters simultaneously. Each context opens in its own editor tab,
switch at any time. Every call passes --context explicitly and your kubeconfig
is never modified. You can even set custom kubeconfig path for each workspace.
Each window remembers it's state even after window reload - continue where you left off.
Utilize native VS Code terminal and file editing capabilities. Quickly check logs
for current or terminated container; open shell for command execution — native VS Code
terminal allows to quickly edit command, add a grep, or even pipe output file on the fly.
Also editing Kubenretes resources is a breeze since it happens right in the IDE - syntax highlighting, formatting, etc.
The codebase is small and lightweight. Around 4,000 lines of TypeScript across six files,
with no runtime dependencies and no build step beyond tsc. It is easy to read
end to end, easy to submit a change to, and small enough to hand to a coding
agent with the whole thing in view.
Main features
Dashboard — one editor tab per context. Inside a dashboard:
Overview — unhealthy pods and every Warning event the cluster is holding,
grouped by reason. A cluster whose event TTL has expired everything says so
rather than claiming all is well.
Resource tables — sortable, filterable tables with columns matched to each
kind, and status pills colored by health. The rail groups them:
| Group |
Kinds |
| Cluster |
Nodes, Namespaces, Events |
| Workloads |
Pods, Deployments, StatefulSets, DaemonSets, ReplicaSets, Jobs, CronJobs, Autoscalers |
| Network |
Services, Ingresses, Endpoints, Network policies |
| Config |
ConfigMaps, Secrets, Service accounts, Resource quotas, Limit ranges |
| Storage |
Volume claims, Volumes, Storage classes |
Detail drawer — select a row for its fields plus actions: Describe, YAML,
Logs, Shell, Pods, Scale, Delete. Scale is offered on Deployments, StatefulSets
and ReplicaSets, starting from the replica count currently set; scaling to zero
confirms first.
The Events section lists everything the cluster recorded about the selected
object, newest first. For a container that has restarted, previous logs
reads the log of the instance that died — the one that explains the restart.
Every kind is judged on what actually goes wrong with it: a Deployment past its
progress deadline, an autoscaler that cannot read its metrics, a Service with no
ready endpoints, a quota at its limit, a namespace stuck Terminating.
Something deliberately idle — a scaled-to-zero Deployment, a suspended CronJob, a
finished Job — reads grey rather than green, so the healthy count only covers
what is really serving.
Secrets list their key names and never their values.
About
The last item in the rail pairs your kubectl version against the cluster's and
says whether the skew is inside Kubernetes' support policy, names the user and
groups the API server authenticated you as — what your RBAC is really evaluated
against, not the kubeconfig entry's name — and lists the context, cluster,
default namespace and any kubectl plugins on your PATH.
Pods of a workload
Select a row and press Pods in the drawer, or Shift+Enter on the row:
the pod table opens narrowed to that workload, with a chip naming the scope; ×
widens it again. It works from Deployments, StatefulSets, DaemonSets,
ReplicaSets, Jobs and CronJobs.
Pods are matched by ownership rather than by label selector, so two Deployments
sharing an app= label do not show each other's pods. A Deployment is matched
through its ReplicaSets, so a rollout in progress shows the old and new pods
together.
Filtering
Every table has a filter row: a namespace picker, a status picker, and a query
box. They combine, and ✕ Clear resets all three, plus the pod scope.
The status picker is built from the rows on screen, so it only offers what this
cluster reports, with a count beside each. It groups health buckets —
Problems, Failing, Warning / pending, Healthy, Inactive —
above the kind's own status words.
The query box matches plain words anywhere in a row, and understands a little
more than that:
| Query |
Matches |
web |
any row containing web |
status:Running |
one column, case-insensitively |
ns:kube-system |
ns, n and s are short for namespace, name, status |
restarts:>3 |
numbers compare — also <, >=, <=, = |
age:<2h |
ages and ready ratios compare too: age:>7d, ready:<1 |
!running |
a leading ! or minus excludes — also -status:Running |
reason:"Back-off restarting" |
quote a value with spaces |
ns:prod restarts:>0 |
terms combine with AND |
Field names are the kind's own column keys, plus name, namespace and
status on every kind. An unrecognised field is treated as plain text, so a name
containing a colon still finds itself. Press / or Ctrl/Cmd+F to jump to
the box.
Requirements
kubectl on your PATH and a readable kubeconfig. No cluster-side component, no
agent, no account.
Installing
From the VS Code Marketplace — search Kubi in the Extensions view, or:
code --install-extension guntiss.kubi
Each release also attaches a .vsix:
code --install-extension kubi.vsix
Then open the Kubi icon in the activity bar, or run Kubi: Open Dashboard
from the command palette.
Building from source
npm install
npm run compile
Press F5 for an Extension Development Host, or npm run package to
build a .vsix. Packaging uses vsce, a devDependency — a plain npm install
is enough, but an install run with --omit=dev or NODE_ENV=production skips it
and npm run package then fails.
Settings
| Setting |
Default |
Description |
kubi.kubectlPath |
kubectl |
Path to the kubectl binary. |
kubi.kubeconfigPath |
(empty) |
Kubeconfig to use instead of the default. Empty means $KUBECONFIG, or ~/.kube/config when that is unset. Accepts ~ and a :-joined list, like $KUBECONFIG itself. |
kubi.editorCommand |
code --wait |
Editor used as KUBE_EDITOR for kubectl edit. Must block until the file is closed. |
kubi.autoRefreshSeconds |
5 |
Auto-refresh interval in seconds; 0 disables. Only visible dashboards refresh. |
Roadmap
- Support for all standard kubernetes resources - some are still missing
- More keyboard shortcuts — reach the common actions from the row you are
already on, without the drawer or the mouse.
- Custom resources — opt in to the CRDs your cluster defines and get them
in the rail beside the built-in kinds.
- Metrics server integration — CPU and memory beside the resources they
belong to, for a fuller picture than status alone.
- More settings — more of the defaults above made yours, per workspace.
Status
Early but usable: read-mostly across the standard resource types. Delete, scale
and kubectl edit are the only mutating actions; delete always confirms first,
as does a scale to zero.
Expect rough edges, and please
open an issue when you find one —
which cluster and which Kubernetes version helps a lot.
Contributing
Issues and pull requests are welcome. Most additions touch one file:
See CONTRIBUTING.md for the layout and conventions.
License
MIT

