Dev Server Manager
A Visual Studio Code extension that provides developers with a dedicated view to monitor, access, and control running local development servers.
Features
- Smart Server Detection: Automatically detects running development servers on 50 common dev ports (3000-3009, 5173-5182, 4200-4209, 8000-8009, 8080-8089)
- Dual Interface: Clean tree view in Explorer sidebar + comprehensive dashboard view
- Quick Access: Click server URLs to open in your default browser
- Rich Information: Shows server details including PID, memory usage, CPU usage, and complete command line
- Cross-Platform: Works on Windows, macOS, and Linux
- Performance Optimized: Smart port scanning with 5-second auto-refresh
- Configurable: Customize monitored ports and command patterns
💡 Love this extension? Please ⭐ rate it 5 stars to help other developers discover it!
Screenshots
Server Dashboard
The main dashboard provides a comprehensive view of all running development servers with detailed information:
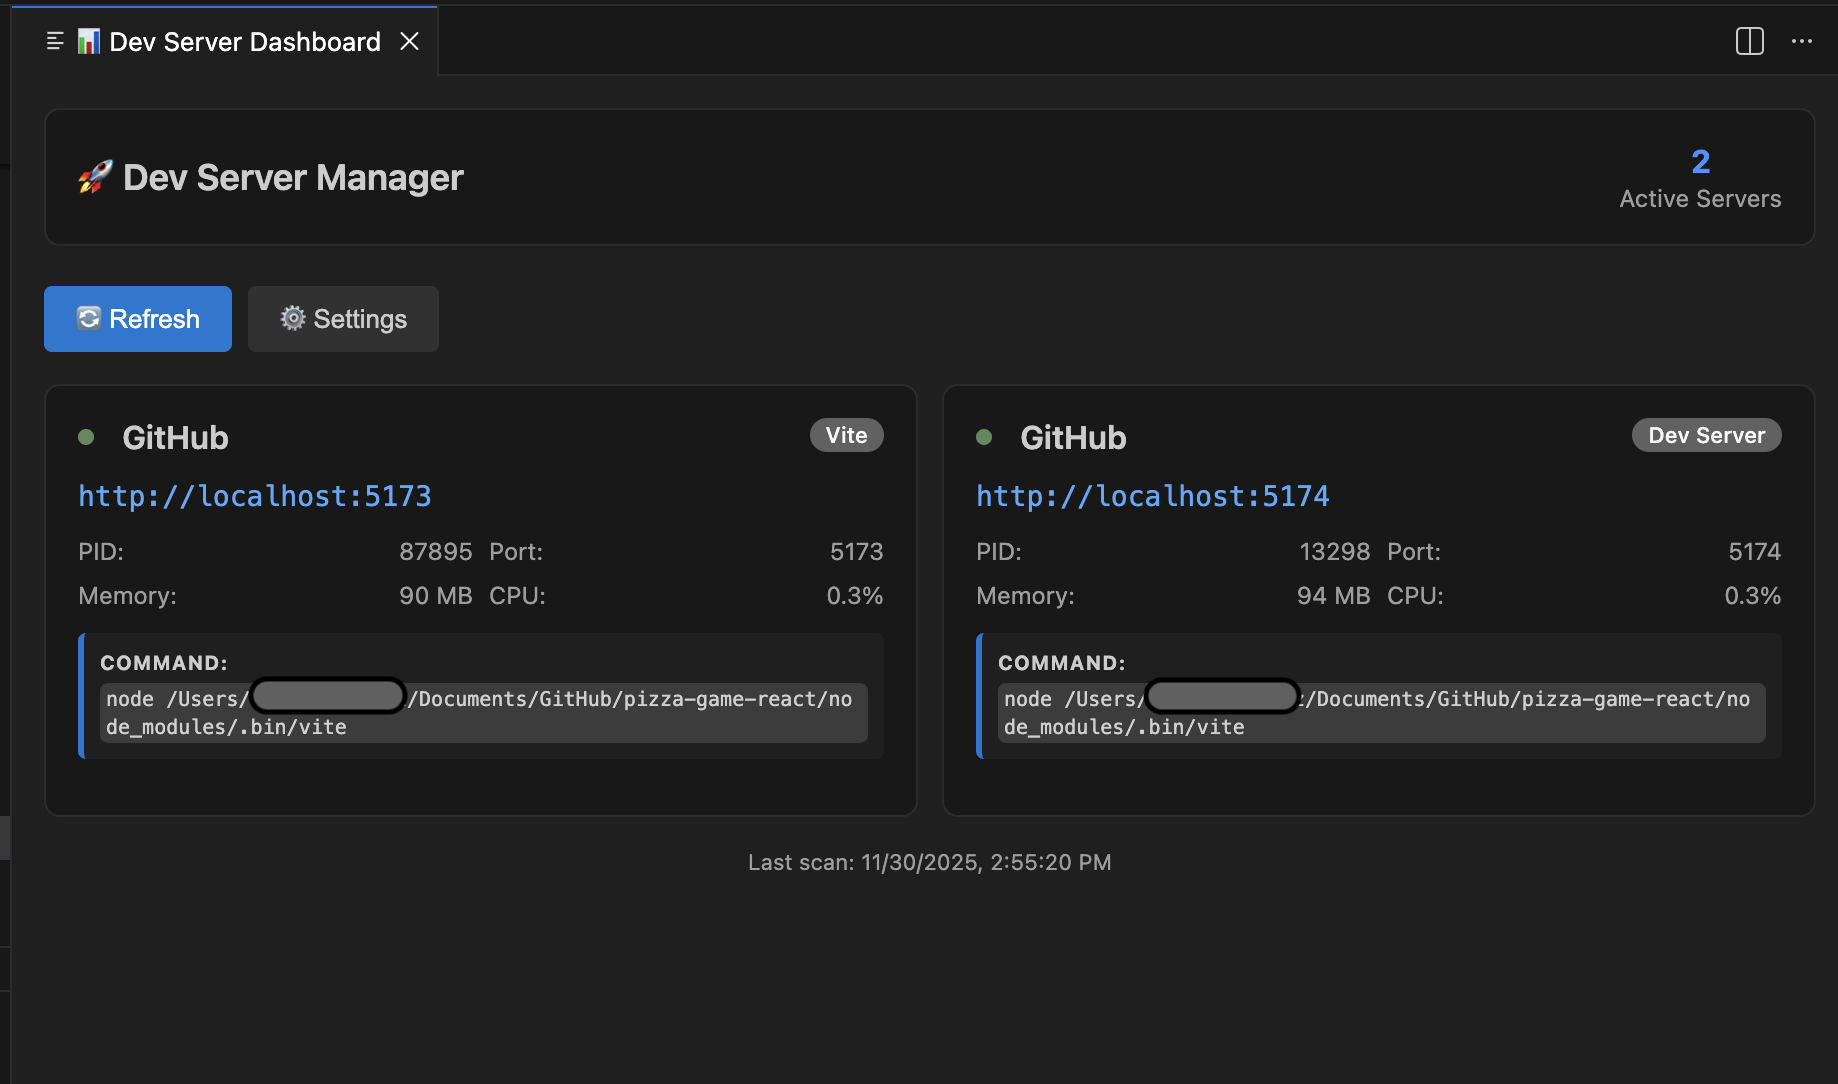
Features: Server cards with type detection, memory/CPU usage, complete command display, and clickable URLs
Explorer Panel View
The Explorer panel integration shows a clean tree view for quick server management:
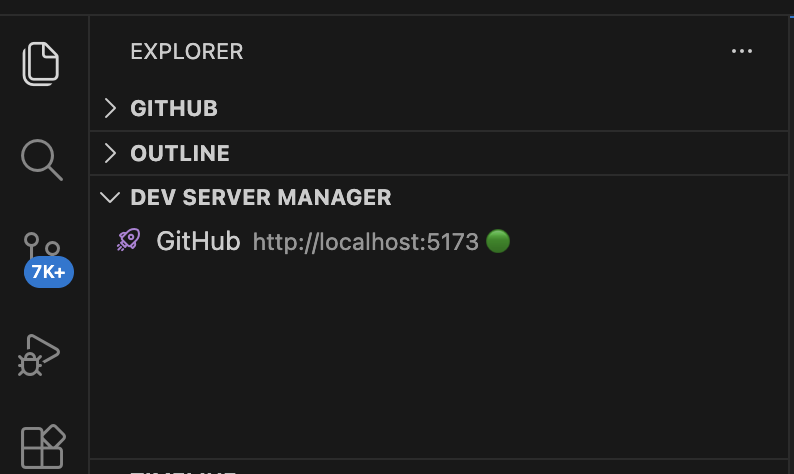
Features: Compact tree view, server type icons, and quick access buttons
Usage
- Explorer View: Look for "Dev Server Manager" in the VS Code Explorer panel
- Dashboard View: Click the status bar button or dashboard icon for detailed view
- Auto-Detection: Running servers are automatically detected and displayed
- Open Servers: Click any server URL to open in your browser
- Server Details: View complete process information, memory, and CPU usage
Configuration
Customize the extension via VS Code settings:
{
    "devServerManager.commonPorts": [3000, 3001, 5173, 4200, 8000, 8080],
    "devServerManager.enableFullScan": false,
    "devServerManager.commandPatterns": ["npm", "yarn", "node", "vite"],
    "devServerManager.refreshInterval": 5000,
    "devServerManager.scanThrottling": true
}
Settings:
commonPorts - Ports to scan (default: 50 common dev ports)enableFullScan - Scan ports 3000-9999 instead of common ports (slower)commandPatterns - Process commands that identify dev serversrefreshInterval - Auto-refresh delay in millisecondsscanThrottling - Performance optimizations (caching, delays)
Status Bar Integration
Look for the "🖥️ Dev Servers" button in the VS Code status bar (bottom left) - click to open the dashboard instantly.
⭐ Enjoying Dev Server Manager?
If this extension helps streamline your development workflow, please consider:
- ⭐ Rating it 5 stars on the VS Code Marketplace
- 🐛 Reporting issues or 💡 suggesting features on GitHub
- 📢 Sharing with your fellow developers
Your feedback helps improve the extension and makes it discoverable for other developers! 🚀
Requirements
- Visual Studio Code 1.74.0 or higher
- Node.js (for development)
Contributing
Contributions are welcome! Please feel free to submit a Pull Request.
License
MIT