GalataJ - See Where Your Java App Spends Time
Performance metrics inline in your code. No dashboards. No context switching.
Website ·
Documentation ·
Pricing
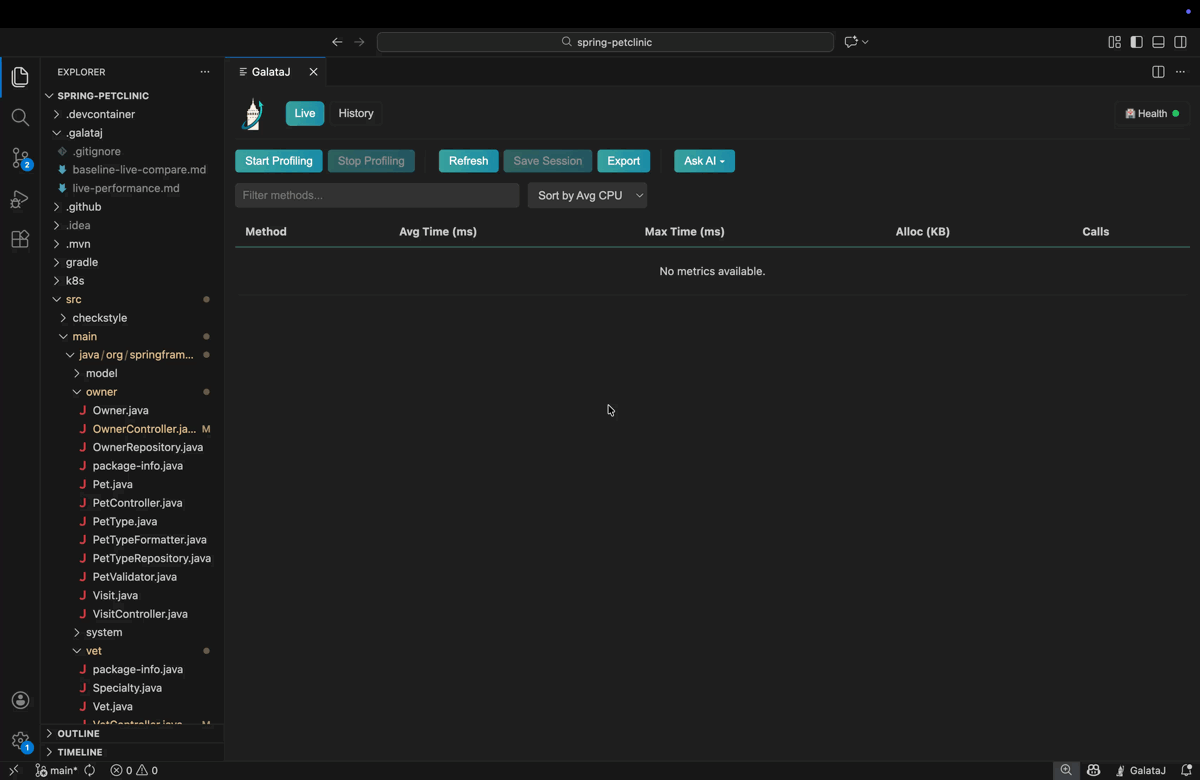
See It In Action
Why GalataJ?
| Traditional Tools |
GalataJ |
| APM dashboards with no code context |
Metrics appear directly above your methods |
| Heavy profilers requiring separate windows |
Zero context switching - stay in your editor |
| Guessing which method to optimize |
Data-driven decisions with real numbers |
| AI tools blind to performance data |
AI context files for intelligent suggestions |
Features
Free Tier
| Feature |
Description |
| Inline Metrics |
Execution time and call count above every method |
| Live Panel |
Real-time profiling data in a dedicated tab |
| AI Context Files |
limited live-performance.md for AI tools |
Pro Tier
| Feature |
Description |
| Session Compare |
Detect performance regressions before production |
| AI Context Files |
live-performance.md and baseline-live-compare.md for AI tools |
| Export |
HTML, JSON, CSV export for sharing and analysis |
| Docker Support |
Profile Java apps running in local containers |
| Custom Prompts |
Save your favorite AI prompts for quick access |
Quick Start
1. Install
Search for "GalataJ" in VS Code Extensions or install from Marketplace.
2. Start Your Java App
Run your Java application as you normally would.
3. Start Profiling
Click GalataJ icon right bottom of your screen then click Start Profiling button.
That's it! Performance metrics appear inline in your code.
Tip: First time? The Health Check will guide you through any missing components.
AI Integration (Pro)
GalataJ generates structured markdown files that your AI tools can read:
your-project/
├── .galataj/
│   ├── live-performance.md      ← Current profiling data
│   └── baseline-live-compare.md ← Comparison with baseline
Example Prompts
For Copilot / Cursor / Windsurf:
Read @.galataj/live-performance.md and suggest optimizations for the slowest methods
Read @.galataj/baseline-live-compare.md and explain what got slower
One-Click Context: Hover any method → Click "Add to Chat" to send metrics to your AI assistant.
Commands
| Command |
Description |
GalataJ: Show Settings |
Open GalataJ Settings |
GalataJ: Show Panel |
Open the profiler panel |
Troubleshooting
No metrics showing?
→ Run GalataJ: Health Check - it diagnoses and fixes most issues automatically.
JVM not appearing?
→ Ensure your Java app is running and using OpenJDK or Oracle JDK.
Need help?
→ Documentation · Email Support
Requirements
- VS Code 1.60+
- Java 8+ (JDK, not JRE)
- Windows, macOS, or Linux
Privacy
GalataJ runs entirely locally. Your code and profiling data never leave your machine.
Privacy Policy
Find performance issues faster. Ship with confidence.
www.galataj.com