Electivus Apex Log Viewer
Search downloaded Salesforce Apex logs inside VS Code, jump straight to the right failure, and keep triage, log inspection, tailing, replay, and debug flags in one workflow.
Install from Marketplace · Changelog · Report an issue


What It Does Best
- Search across downloaded Apex log bodies with match snippets, so you can find the right log by business terms, IDs, or exception context instead of guessing by timestamp.
- Highlight logs that deserve attention with error and triage badges directly in the list.
- Open a dedicated Apex Log Viewer with parsed entries, focused filters, and a diagnostics sidebar.
- Tail live logs, open the selected log, or hand it off to Apex Replay Debugger without leaving VS Code.
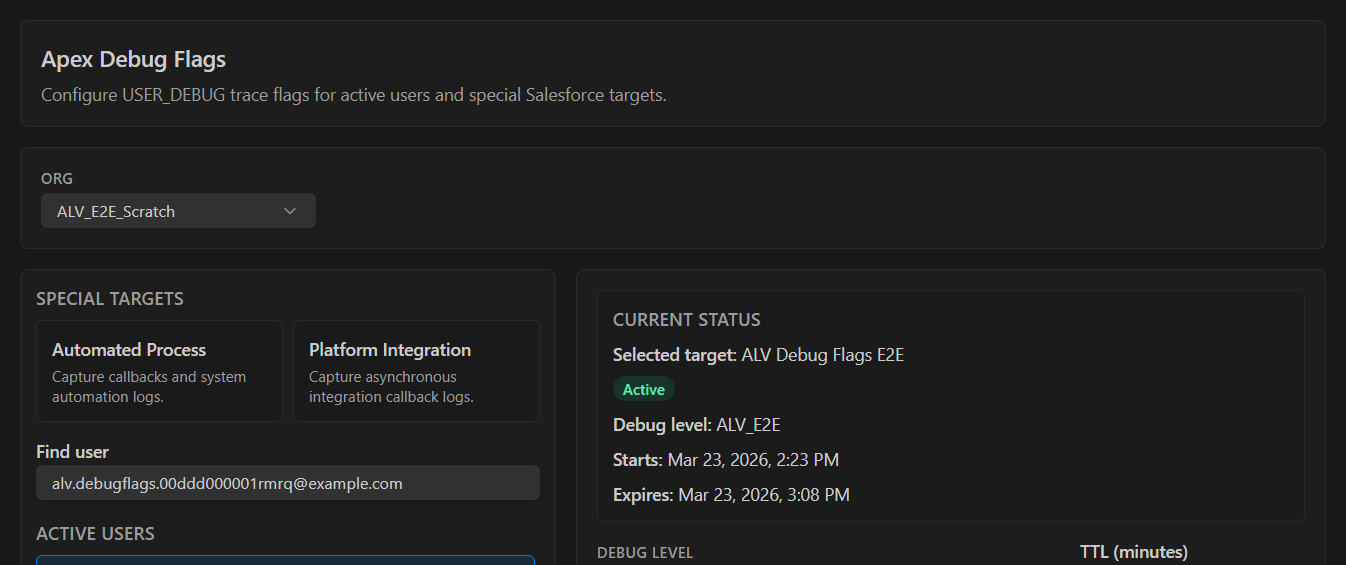
- Manage
USER_DEBUG TraceFlags in a dedicated Apex Debug Flags screen with more room than the standard panel view.
- Switch orgs quickly and keep the workflow centered on the org you are actively investigating.
Screenshots
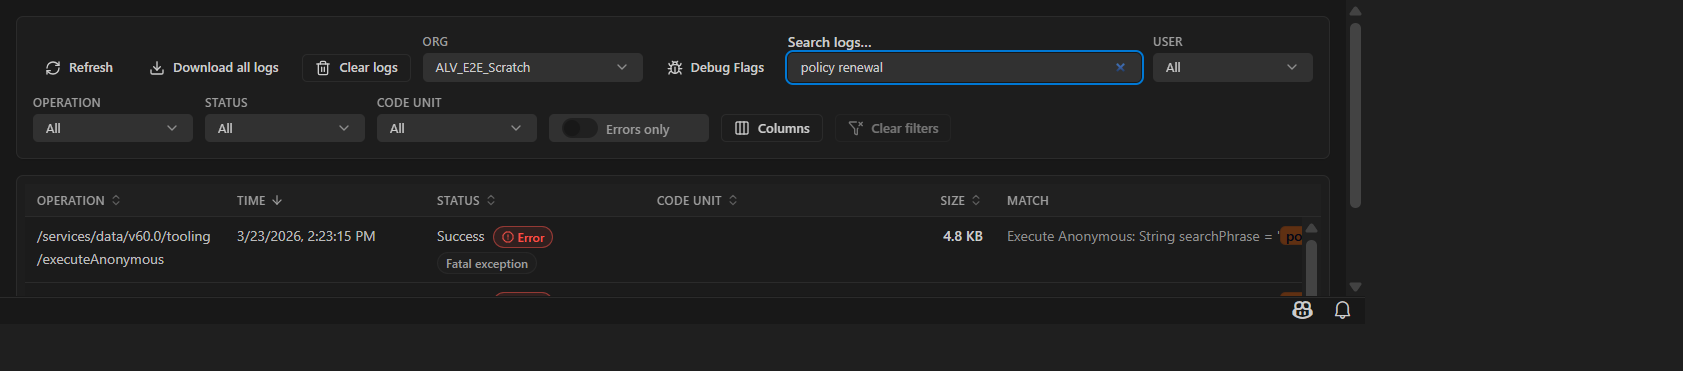
Search in the logs panel is optimized for locally saved log bodies, so the most effective flow is:
- Refresh logs.
- Search by the phrase, record ID, correlation ID, or exception detail you already know.
- Scroll for more rows when you want to keep exploring the current result set.
- Use Download all logs when the refreshed and scrolled set still did not surface what you need, or when you want to pull the whole org backlog into the workspace in one shot.
- Open the best candidate in the dedicated viewer.
Requirements
- Salesforce CLI installed and authenticated.
sf is recommended, but legacy sfdx also works.
- VS Code 1.105+.
- Standalone Salesforce CLI plugin: Node.js 22.19+.
- Recommended for Replay Debugger: Salesforce Extension Pack (
salesforce.salesforcedx-vscode).
Login example:
sf org login web
Install
- From VS Code: open Extensions (
Ctrl/Cmd+Shift+X), search for Electivus Apex Log Viewer, then install.
- From the Marketplace: use the install link above.
- From the CLI:
code --install-extension electivus.apex-log-viewer
Salesforce CLI Plugin
Install the Salesforce CLI plugin to use the same local-first commands exposed through the sf electivus namespace:
sf plugins install @electivus/plugin-electivus
sf electivus log sync --target-org my-org --concurrency 6
sf electivus log status --target-org my-org
log sync resolves org auth through Salesforce Core, lists ApexLog rows, and downloads raw log bodies over the Salesforce Tooling REST API. It materializes those bodies under apexlogs/, keeps incremental state in apexlogs/.alv/sync-state.json, writes the canonical org-first layout at apexlogs/orgs/<safe-target-org>/logs/YYYY-MM-DD/<logId>.log, and removes legacy SQLite search index files. Use --concurrency to tune parallel body downloads.
The VS Code extension and plugin are independent adapters over the private shared @alv/core. The extension bundles the core directly and never packages or spawns the plugin, so extension users do not install the plugin. The published plugin provides the same camelCase JSON operations for terminal and agent workflows.
The standalone plugin runs on Node.js 22.19+; extension users get the compatible runtime through VS Code 1.105+.
Install the companion Codex skill for agent workflows with:
sf electivus skill install
Usage
The extension activates automatically when the workspace contains sfdx-project.json. You can also activate it on demand by opening an Apex log or running one of the commands below.
Open the Logs Panel
- Open the VS Code panel area.
- Switch to Electivus Apex Logs.
- Run
Electivus Apex Logs: Refresh Logs if the panel is not already populated.
Search Downloaded Logs
- Run Refresh Logs to populate the list immediately while the shared runtime syncs bodies in the background.
- Use the search box to search visible metadata plus locally synced log bodies.
- Match snippets appear in the
Match column when the hit comes from the saved log file.
- Scroll to load more rows from the current list when you want to keep widening the search incrementally.
- Use Download all logs when the refreshed and scrolled set still is not enough, or when you want to pull all logs from the selected org into local search in one action.
- Combine search with filters by user, operation, status, and Errors only.
Review Triage Faster
- Error badges and triage reasons surface logs that deserve attention before you open them.
- The
Errors only switch is useful when you want to reduce noise to the failing paths.
- Sorting and infinite scroll still apply, so you can keep narrowing the list without leaving the panel.
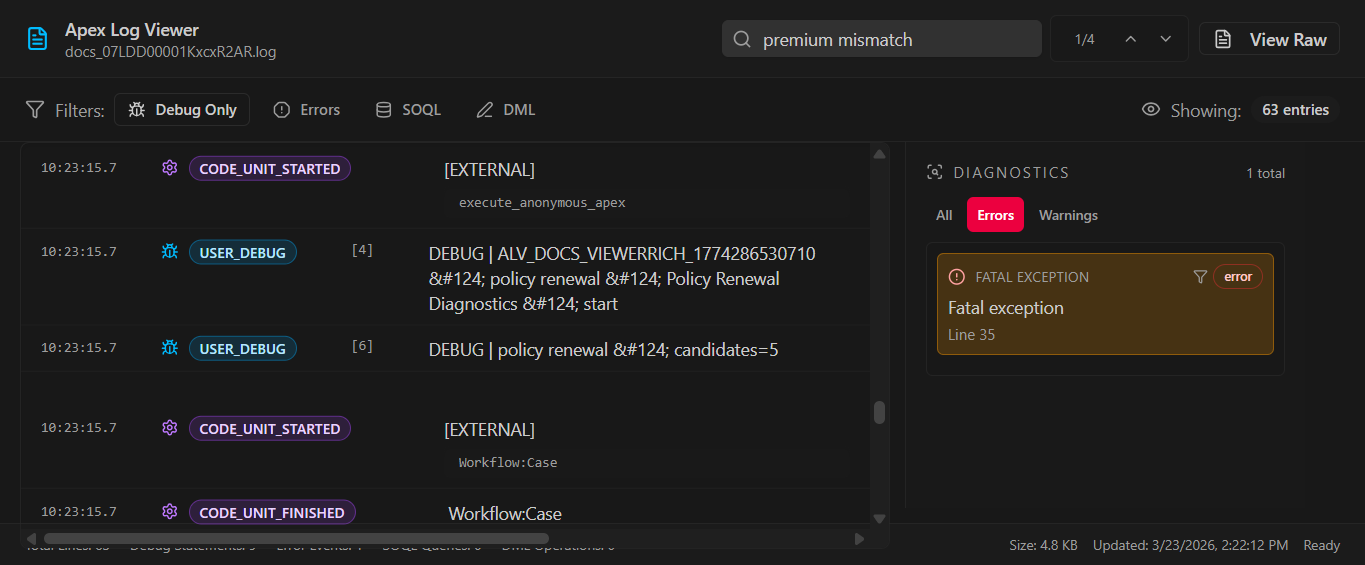
Open the Dedicated Viewer
- Press
Enter on a selected row or open the log from the list.
- The dedicated Apex Log Viewer parses the log into debug, SOQL, DML, and error-oriented views.
- Use the built-in search box to jump between matching entries.
- Use the diagnostics sidebar to land on mapped failures and warnings faster.
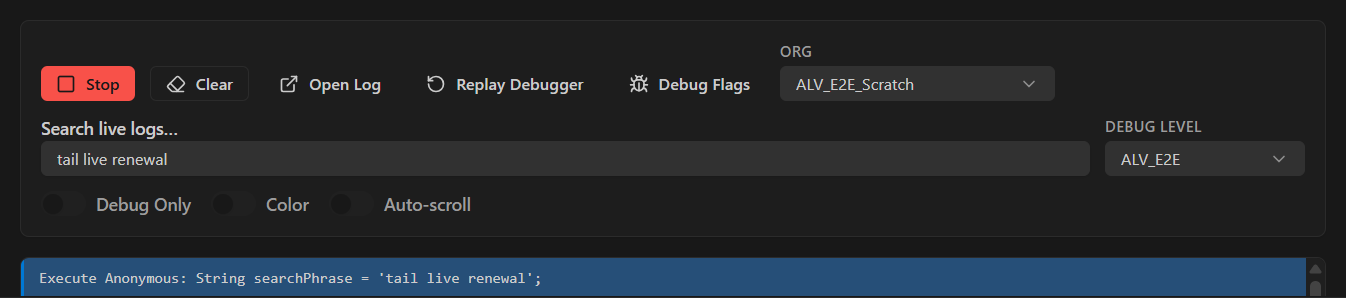
Tail Logs
- Run
Electivus Apex Logs: Tail Logs to open the tail view.
- Start or stop streaming from the toolbar.
- Search live output, keep auto-scroll on, and open or replay the selected log from the same screen.
- Open Debug Flags from either the Logs toolbar or the Tail toolbar.
- Search active users by name or username.
- Review current
USER_DEBUG status, level, and expiration.
- Apply or remove trace flags with a custom TTL.
- Use the Debug Level Manager to create or tune a DebugLevel without leaving the extension.
Replay Debugger
- Open a log from the list and launch Apex Replay Debugger from the row action when you need step-by-step inspection.
- The extension is designed to make it easier to find the right log before you replay it.
Select an Org
- Use the org picker in Logs, Tail, or Debug Flags to switch between authenticated orgs.
- The extension can also use your CLI default org.
Commands
Electivus Apex Logs: Refresh Logs (electivus.apexLogViewer.logs.refresh)Electivus Apex Logs: Select Org (electivus.apexLogViewer.org.select)Electivus Apex Logs: Tail Logs (electivus.apexLogViewer.tail.start)Electivus Apex Logs: Show Extension Output (electivus.apexLogViewer.output.show)
Settings
electivus.apexLogViewer.logs.pageSize: logs fetched per page.electivus.apexLogViewer.logs.processingConcurrency: concurrent head requests.electivus.apexLogViewer.logs.columns: reorder, hide, or resize list columns.electivus.apexLogViewer.tail.bufferLines: max in-memory tail lines.electivus.apexLogViewer.logging.trace: verbose extension logging to the output channel.
Previous sfLogs.* and electivus.apexLogs.* keys are not aliases and are not migrated automatically.
See docs/SETTINGS.md for the full configuration reference.
Troubleshooting
- Search is not finding the text I know is in the log
Run Refresh Logs first, then scroll to load more rows if needed. If the log still is not in the current local set, use Download all logs to bring the rest of the org backlog into the workspace search cache.
- No orgs detected
Authenticate with
sf org login web and verify with sf org list; the extension reads the resulting Salesforce auth state directly.
- Replay Debugger does not launch
Install the Salesforce Extension Pack or the standalone Apex Replay Debugger extension.
Contributing
See CONTRIBUTING.md for development setup and release flow details.
Useful local commands:
pnpm run buildpnpm run test:unitpnpm run test:integrationpnpm run test:e2epnpm run docs:screenshots
Additional docs:
Privacy & Security
- Source code and Apex log content are not sent in telemetry.
- Tokens are not logged by default.
- When
electivus.apexLogViewer.logging.trace is enabled, review extension output before sharing it externally.
- The extension reuses your existing Salesforce CLI authentication and reads downloaded logs locally.
Telemetry
The extension may emit minimal, anonymized usage and error telemetry to improve reliability and performance. Telemetry respects VS Code's telemetry.telemetryLevel setting and is disabled automatically in Development and Test modes.
License
MIT © Electivus