kama for VS Code
Syntax highlighting, the kama language server (live diagnostics, go-to-definition, rename,
completion, an auto-import fix) and zero-config breakpoint debugging for the
kama language (.kama).
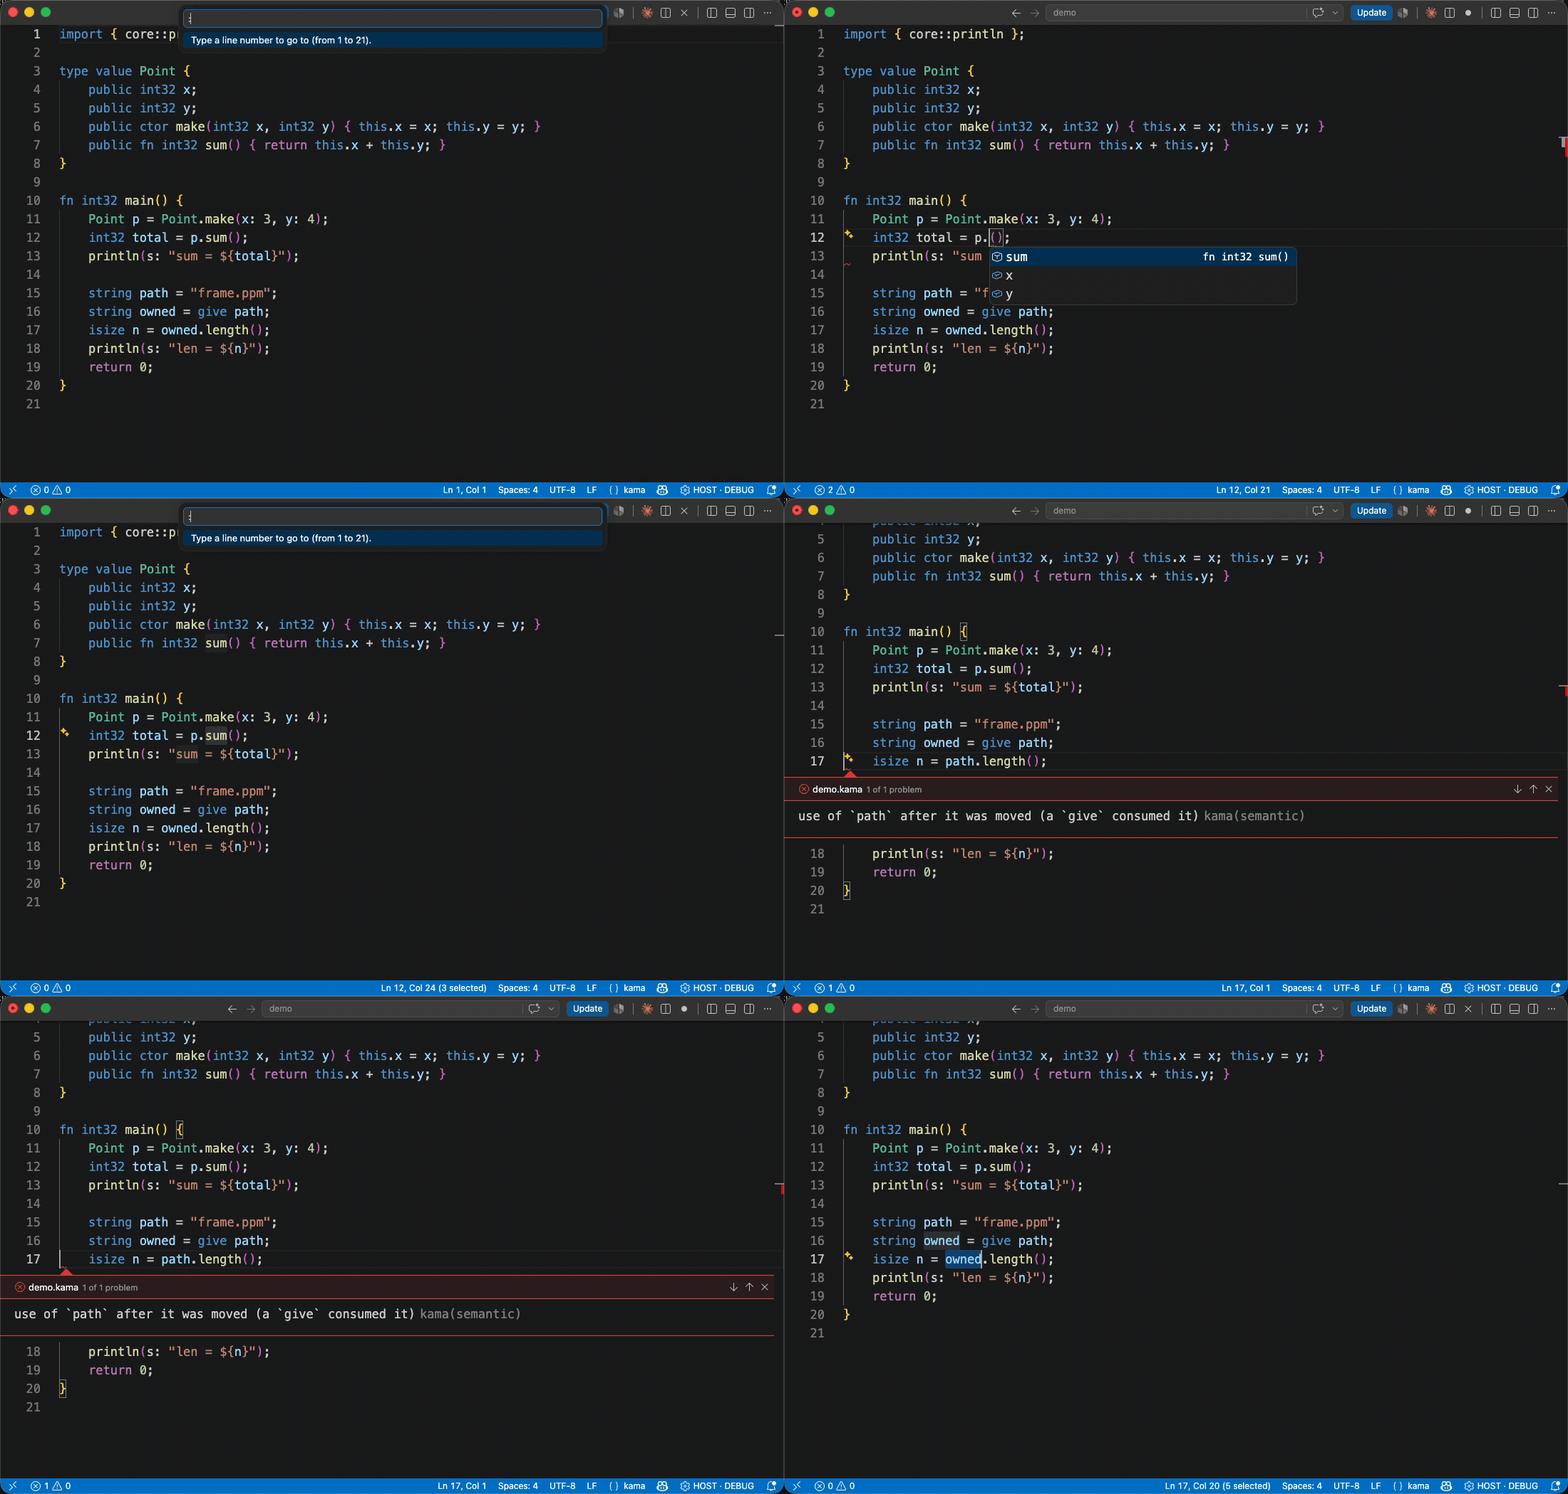
The diagnostics are the compiler's own — the same analysis kama build runs, so the editor cannot
disagree with the build. Above: completion resolving a type's members, then give moving a string and
the use-after-move reported on the next line, with no build step.
Requirements
This extension drives the kama compiler — install it first:
curl -fsSL https://kama-lang.org/install.sh | sh          # macOS / Linux
irm https://kama-lang.org/install.ps1 | iex                # Windows (PowerShell)
The extension finds it via kama.path if you set it, else a workspace-local
out/<os>-<arch>/kama or ./kama, else your PATH, else ~/.kama/bin/kama — where the installer puts
it — so skipping the PATH line the installer prints still works. If none of those has a compiler, the
extension says so and offers to open the install page; Retry picks up a fresh install without
restarting VS Code.
The binary must be native to your OS. The extension runs kama lsp as a normal host
process, so a container-built Linux ./kama sitting in a macOS checkout will not launch.
CodeLLDB is installed
automatically as an extension-pack member — it is what actually runs the debugger.
What you get
On opening a .kama the extension starts kama lsp — a JSON-RPC server built into the compiler —
and gives you, as you type and with no build required:
- live diagnostics, including semantic errors, not just parse errors
- hover (kind + name) and go-to-definition (F12)
- find-references (Shift-F12) and rename (F2), which refuses symbols the project does not
own; renaming a parameter also rewrites its argument labels
- completion and signature help
- the document outline (Ctrl-Shift-O / breadcrumbs) and workspace symbols (Ctrl-T)
- semantic highlighting layered over the TextMate grammar — the resolver knows which names are
types, fields, locals or parameters, which a regex cannot
- an auto-import quick fix (Ctrl-.) on a name you have not imported yet
Debugging (breakpoints, call stack, locals)
kama compiles to C with #line directives back to your .kama, so a debug build is
breakpoint-debuggable like any native program — and what you inspect reads as kama, not as the C.
- Open a
.kama file and set a breakpoint in the gutter.
- Press F5 (or run "kama: Debug Current File"). The extension builds a debug binary
(
-g -O0) and CodeLLDB launches it. A file inside an executable project is built as that
project — kama build <kama.json>, into the project's out/f5/ — so its imports resolve; a file
with no project around it is built alone.
- Execution stops in the
.kama source; Variables shows locals and params, and the Call Stack
shows kama frames.
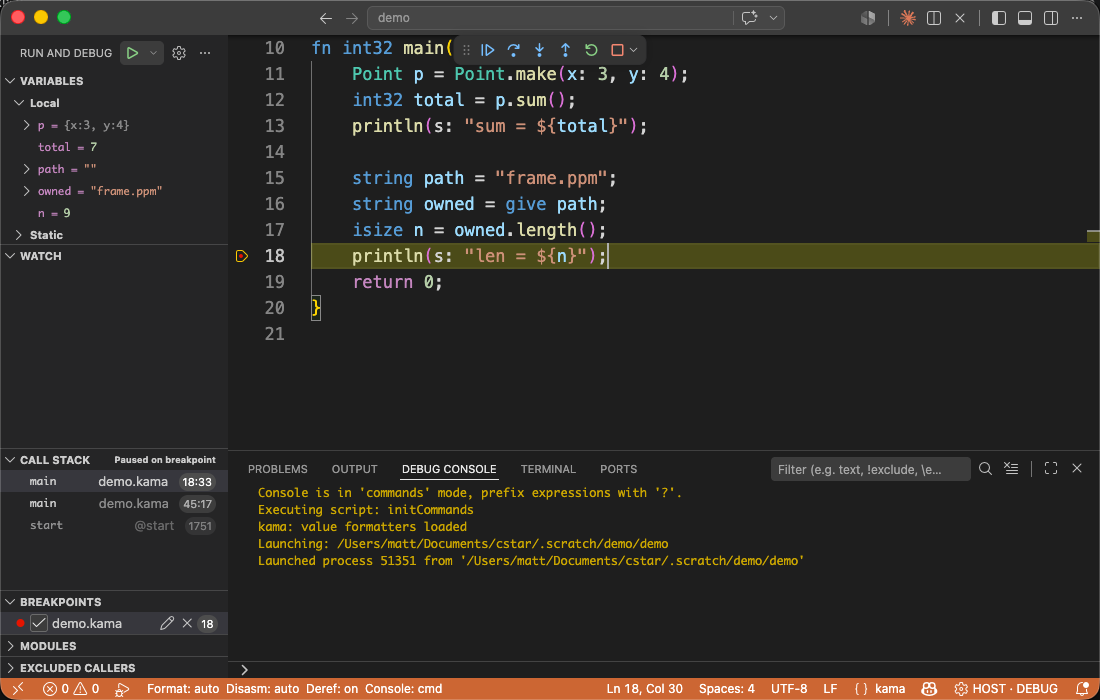
Values read as kama, not as the C they compile to: a string shows its text, a value type shows
its fields without the k_ register, and the call stack names main demo.kama 18:33. Note path = ""
— a moved-from string, the run-time face of the same guarantee the editor catches above.
Values are rendered by the formatters that ship with the compiler, so a string shows its text, an
Optional shows Some(…) or None, a DynamicArray or Map shows its elements, and a Shared
shows strong=N weak=M above its pointee. A struct's fields read as you declared them. Names —
locals, the call stack, watch expressions — are put back into kama spelling by the extension, because
those come from the debug info rather than from a value.
Debugging a project. F5 debugs the open file. A project with its own launch.json needs nothing
added — if it has a kama.json, its configurations get the same formatters and the same demangled
names automatically:
{ "type": "lldb", "request": "launch", "program": "${workspaceFolder}/build/app" }
Use "kama": "src/main.kama" to point at the program explicitly when the manifest is somewhere
detection cannot find it, or "kama": false to opt a configuration out.
Outside VS Code, kama demangle --lldb-init prints the one line that loads the value formatters into
any lldb — which also gives a terminal bt readable frame names — and kama demangle <file> -- <name> turns a single C name (from a crash log, or a
--keep-c compiler error) back into its kama spelling.
For the browser target, build with --target wasm and debug in the browser via the emitted source maps.
Build configuration (the status bar)
The server analyzes the program a plain kama build builds in that project — the resolved target's
derived flags, BUILD_TYPE=DEBUG, and the manifest's default flags — so the editor and the compiler
cannot disagree about which @compileFor declarations exist.
The status bar (bottom right, on a .kama) shows what it resolved — ⚙ HOST · DEBUG — with the
manifest, triple and active flags in its tooltip. Click it, or run "kama: Select Build
Configuration", to switch any single-select group the project declares: TARGET, BUILD_TYPE,
OUTPUT, and any group of your own.
The picker writes kama.local.json (the gitignored sibling of kama.json) rather than an editor
setting. That is deliberate: it is the same file kama build merges, so the editor, the CLI and F5
debugging cannot get out of step, and a Neovim user overrides configuration exactly the way you do.
Saving it re-analyzes every open buffer — no restart.
One configuration per server process, pinned by the first file that resolved a manifest. Open a
second project in the same window and it is analyzed under the first one's flags — the status-bar
tooltip warns when the current file is outside the pinned project. Fix it with "kama: Restart
Language Server", or use one window per project.
Settings
| setting |
what it does |
kama.path |
Path to the kama compiler. Empty = search the workspace, then PATH, then ~/.kama/bin. Takes effect immediately. |
kama.trace.server |
off | messages | verbose — log JSON-RPC traffic to the output channel. |
There is deliberately no setting mirroring the build configuration — see above.
Commands
| command |
default key |
| kama: Debug Current File |
F5 |
| kama: Select Build Configuration |
— |
| kama: Restart Language Server |
— |
Using a different editor?
The same server, kama lsp, serves Neovim, Vim, Emacs, Sublime Text, Helix, Kate and Zed —
see Editor setup.
Links
Contributing
Building this extension from a checkout of the kama repo — the language client is an npm dependency,
so install it first:
cd editor/vscode
npm install
ln -s "$(pwd)" ~/.vscode/extensions/kama-dev      # dev install, then reload VS Code
Or package and install it:
./dev ext-package                                  # from the repo root
code --install-extension editor/vscode/kama-*.vsix
MIT licensed. See LICENSE.

