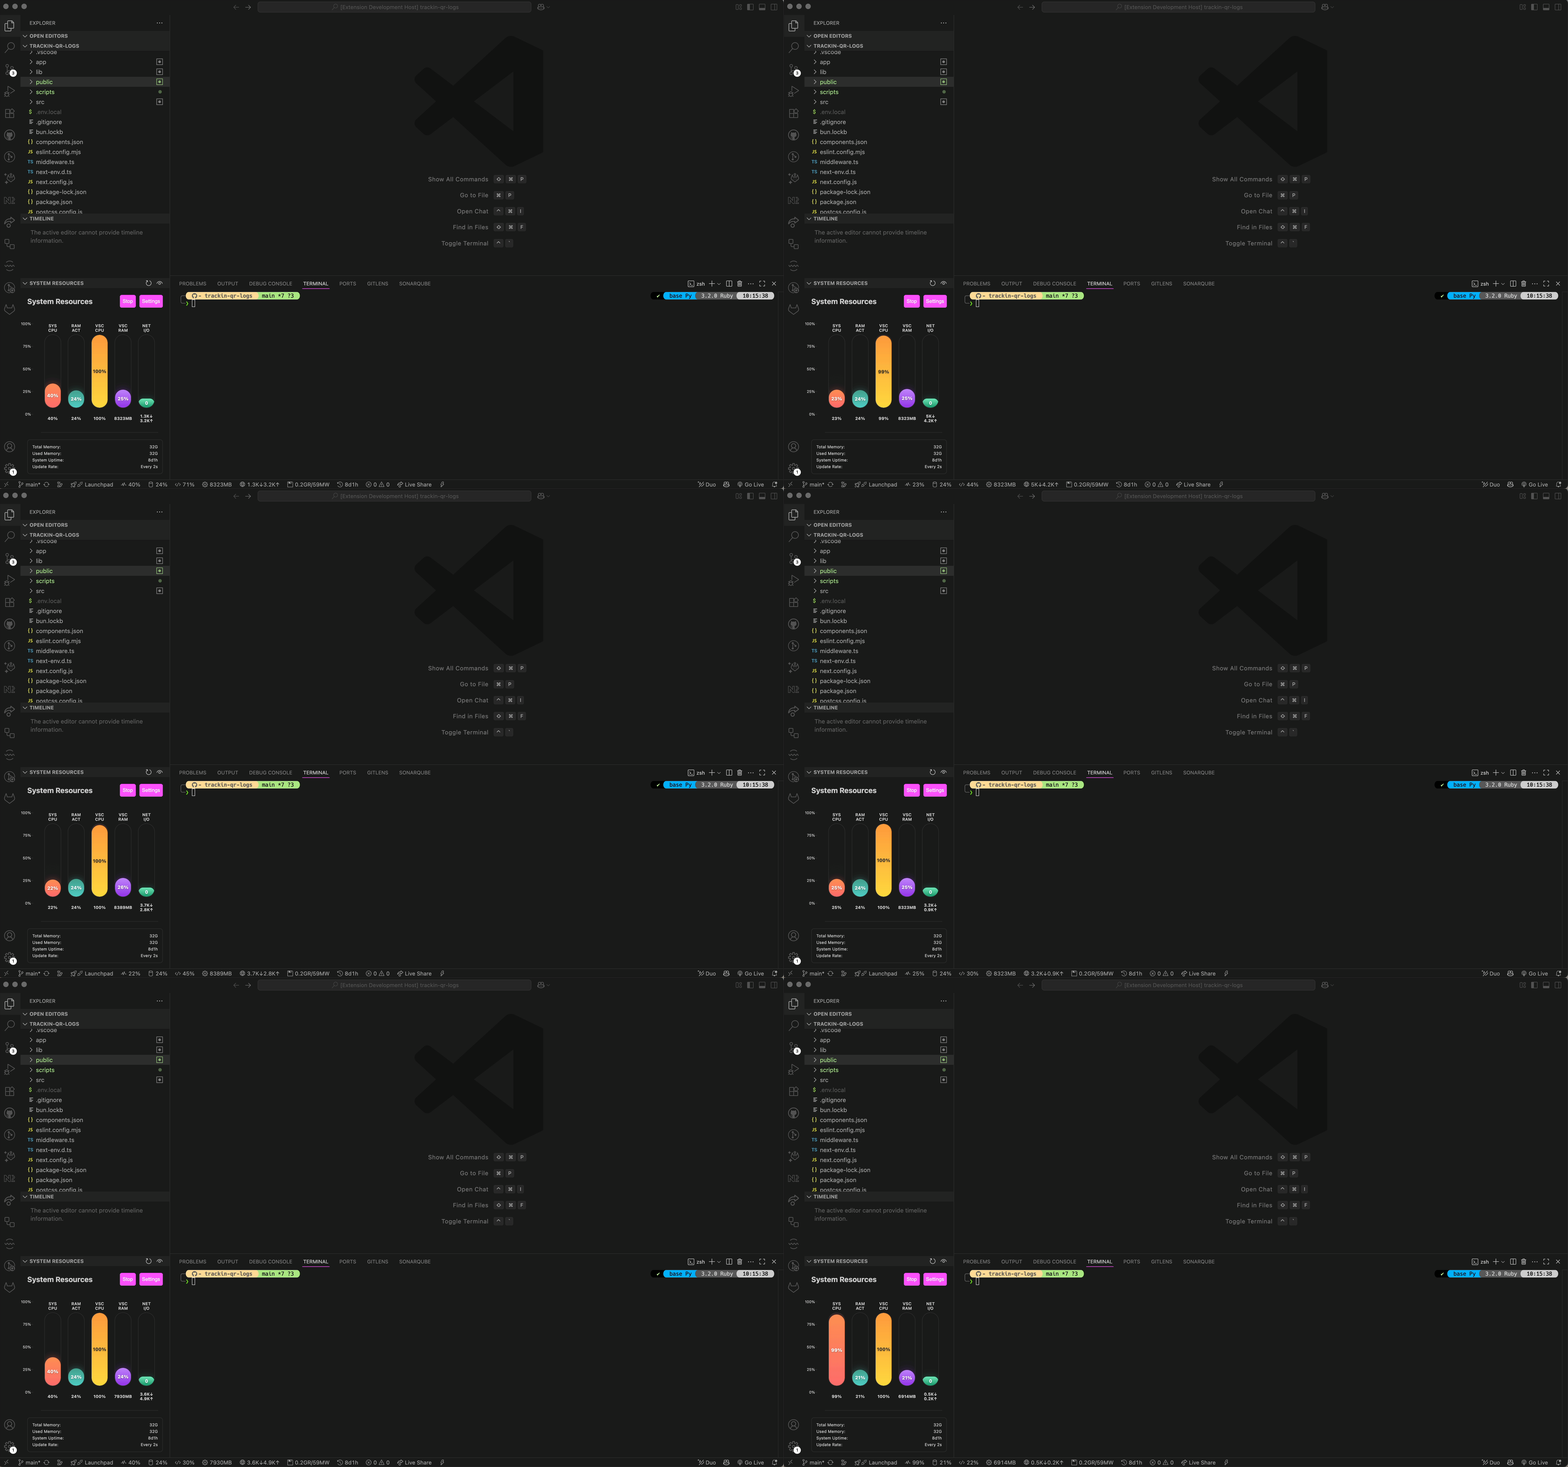
|
| Metric | Status Bar | Graph View | Configurable |
|---|---|---|---|
| System CPU | ✅ | ✅ | ✅ |
| System Memory | ✅ | ✅ | ✅ |
| VS Code CPU | ✅ | ✅ | ✅ |
| VS Code Memory | ✅ | ✅ | ✅ |
| Network I/O | ✅ | ✅ | ✅ |
| Disk I/O | ✅ | ➖ | ✅ |
| System Uptime | ✅ | ➖ | ✅ |
📊 Monitored Resources
- System CPU Usage - Overall system CPU utilization percentage
- System Memory - Total system memory usage with available/used breakdown
- VS Code CPU - CPU usage specifically by the VS Code process
- VS Code Memory - Memory consumption by VS Code and its extensions
- Network Activity - Upload/download network I/O statistics
⚙️ Available Commands
System Performance: Show System Graph- Open the system resources panelSystem Performance: Toggle System Graph- Toggle the panel visibilitySystem Performance: Refresh- Manually refresh all metricsSystem Performance: Toggle Monitoring- Enable/disable real-time monitoring
⚙️ Configuration
Customize the extension behavior through VS Code settings:
{
  "systemGraph.showCpu": true,                    // Show CPU graph bar in the sidebar panel
  "systemGraph.showMemory": true,                 // Show memory graph bar in the sidebar panel
  "systemGraph.showVscodeCpu": true,              // Show VS Code CPU graph bar in the sidebar panel
  "systemGraph.showVscodeMemory": true,           // Show VS Code memory graph bar in the sidebar panel
  "systemGraph.showNetwork": true,                // Show network I/O graph bar in the sidebar panel
  "systemGraph.statusBarEnabled": true,           // Enable/disable all status bar monitoring
  "systemGraph.updateInterval": 2000,             // Update interval in milliseconds (500-10000)

  "systemGraph.statusBar.showCpu": true,          // Show system CPU in the status bar
  "systemGraph.statusBar.showMemory": true,       // Show system memory in the status bar
  "systemGraph.statusBar.showVscodeCpu": true,    // Show VS Code CPU in the status bar
  "systemGraph.statusBar.showVscodeMemory": true, // Show VS Code memory in the status bar
  "systemGraph.statusBar.showNetwork": true,      // Show network I/O in the status bar
  "systemGraph.statusBar.showDisk": true,         // Show disk I/O in the status bar
  "systemGraph.statusBar.showUptime": true        // Show system uptime in the status bar
}
🎛️ Configuration Options
- Sidebar Panel Metrics - Toggle which graph bars appear in the System Resources panel (
systemGraph.showCpu, etc.) - Status Bar Items - Toggle individual status bar items via
systemGraph.statusBar.*settings - Status Bar Display - Enable/disable all status bar monitoring at once (
systemGraph.statusBarEnabled) - Update Frequency - Customize refresh interval (0.5-10 seconds)
🛠️ Development & Contributing
🚀 Local Development Setup
Prerequisites
Node.js 16+, npm and VS Code 1.60+
Getting Started
# Clone the repository
git clone https://github.com/bubablue/system-performance-extension.git
cd system-performance-extension

# Install dependencies
npm install

# Open in VS Code
code .

# Start development
npm run watch
Running Tests
# Run all tests
npm test
Debugging
- Press
F5to launch the Extension Development Host - Open a test project in the new window
- Test the extension functionality
Building for Release
npm run package
🤝 How to Contribute
We welcome contributions! Here's how you can help:
- 🐛 Report Bugs - Found an issue? Open an issue
- 💡 Suggest Features - Have an idea? We'd love to hear it!
- 📝 Improve Documentation - Help make the docs even better
- 🔧 Submit Code - Fix bugs or add features with a PR
Contribution Guidelines
- Fork the repository
- Create a feature branch (
git checkout -b feature/amazing-feature) - Commit your changes (
git commit -m 'Add amazing feature') - Push to the branch (
git push origin feature/amazing-feature) - Open a Pull Request
📊 Core Features
|
🔮 Future Enhancements
|
💡 Have an idea? Suggest a feature • 🐛 Found a bug? Report it
💝 Support
📄 License
This project is licensed under the MIT License - see the LICENSE file for details.
Made with ❤️ by developers, for developers
Monitor your system resources without leaving your favorite editor


