Bread Wandb Viewer


Compare ML training runs side-by-side in VS Code - no browser switching, no waiting
Stop switching to your browser to compare training runs. Bread Wandb Viewer brings Weights & Biases visualization directly into VS Code. Compare multiple runs side-by-side with interactive charts, export AI context for Claude Code/Cursor/Codex, and analyze experiments without leaving your editor.
Perfect for machine learning engineers, deep learning researchers, and data scientists who want to stay in their development environment.
Multi-Run Comparison in Action
 View multiple training runs in seconds - no browser needed
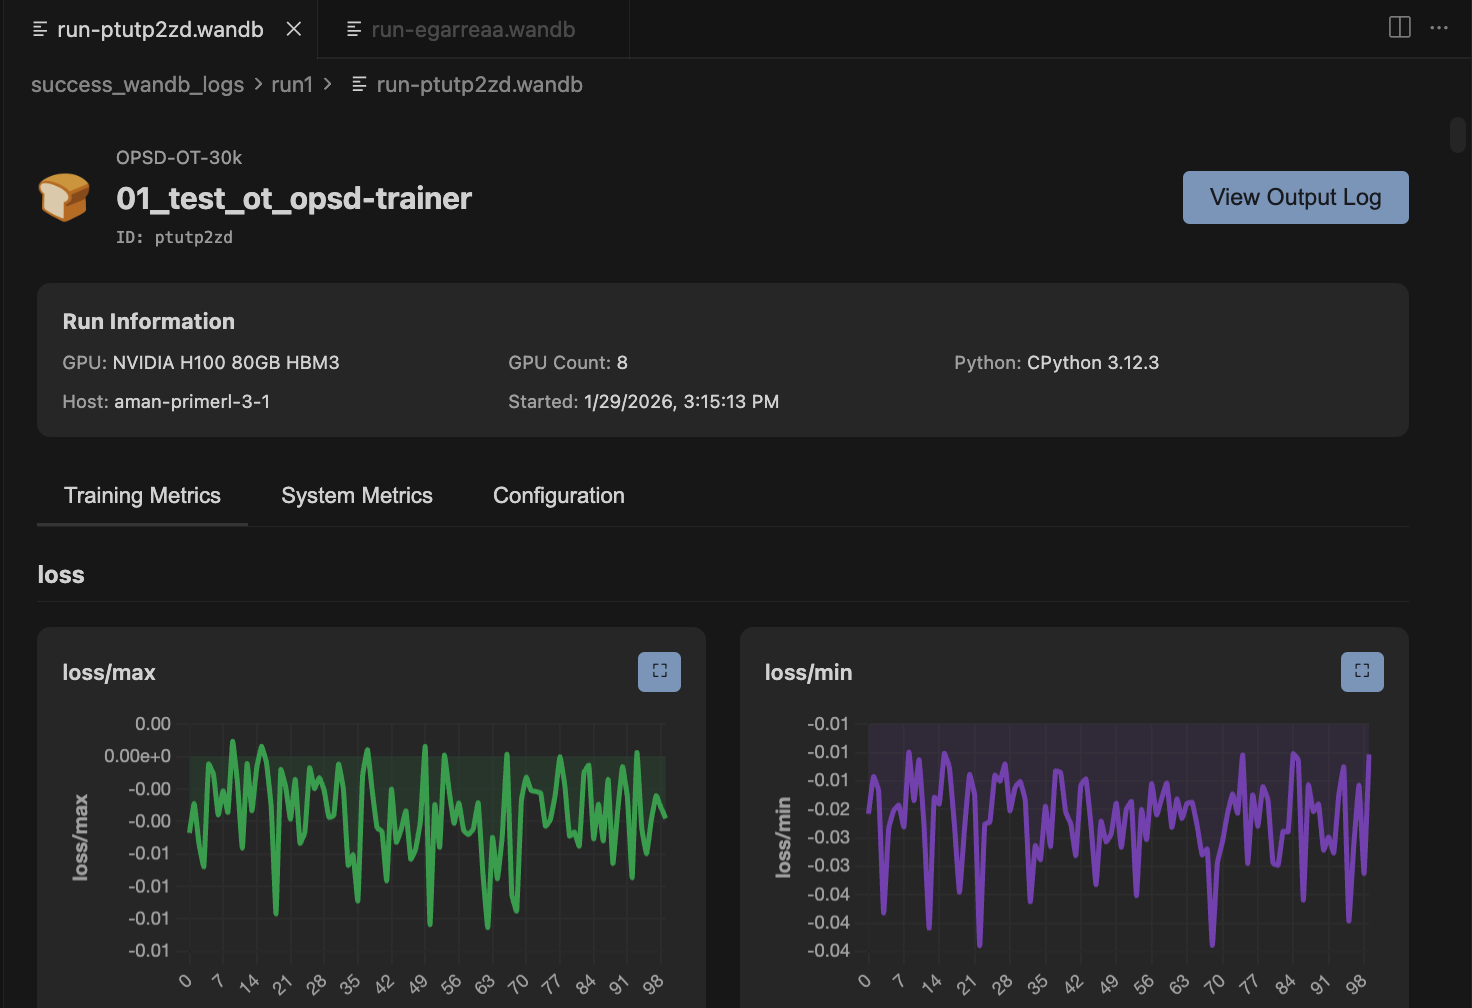 Compare W&B training metrics with interactive sidebar
Features
- 🔄 Multi-Run Comparison - Overlay multiple runs on the same charts with color coding and interactive toggles
- 🤖 AI Context Export - One-click markdown export for Claude Code, Cursor, and Codex with token counting
- 🎯 Interactive Charts - Zoom, pan, fullscreen, and smooth with EMA (exponential moving average)
- 📂 Automatic File Watching - Extension detects new .wandb files and refreshes automatically
- 📊 System Metrics - GPU utilization, memory, CPU, disk I/O tracking
- 🔍 Metadata Comparison - Side-by-side config and hyperparameter diff highlighting
- 🎨 Smart Grouping - Metrics auto-organized by prefix (loss/, train/, val/, gpu.0/)
- 🔒 100% Offline - Direct .wandb file parsing with protobuf, no API calls or internet needed
- 🎛️ Advanced Controls - Log scales, raw data overlay toggle, adjustable smoothing
- 📁 Folder Scanning - Automatically discover all runs in a directory
Quick Start
View a single run:
- Click any
.wandb file in VS Code Explorer
- Charts and metrics appear instantly
Compare multiple runs:
- Right-click any folder with W&B runs
- Select "Bread Wandb Viewer"
- Check/uncheck runs in sidebar to compare
That's it! No configuration needed.
Visual Demos
AI Context Generation
 One-click AI context export for Claude Code, Cursor, and Codex
Features in Depth
🔄 Multi-Run Comparison
Compare training runs side-by-side to understand what hyperparameters and configurations work best - all without leaving VS Code.
- Overlay multiple runs on the same charts
- Color-coded run identification
- Interactive sidebar for toggling runs on/off
- Resizable sidebar for better workspace management
- Automatic folder scanning for all runs
Ideal for hyperparameter tuning, ablation studies, and experiment analysis. No need to switch to your browser to compare metrics.
🤖 AI Context Export
Export your training runs as AI-optimized markdown for coding assistants like Claude Code, Cursor, and Codex.
Perfect for:
- Debugging training code with AI assistance
- Analyzing hyperparameter impact on model performance
- Generating experiment summaries and insights
- Understanding why certain runs performed better
Features:
- One-click copy to clipboard or save to file
- Token count estimation for context planning
- Formatted comparison tables
- CSV metric data for analysis
- Configuration diffs highlighted
🎯 Interactive Charts
Advanced chart controls for detailed metric analysis.
- Smoothing: Adjustable EMA smoothing with real-time preview
- Zoom: Drag to select region and zoom in
- Pan: Shift+drag to navigate zoomed charts
- Fullscreen: Click expand icon on any chart
- Log Scales: Toggle X and Y axis logarithmic scales
- Raw Data Overlay: View smoothed and raw data simultaneously
- Auto-decimation: Large datasets (500+ points) automatically downsampled for performance
📂 Automatic File Watching
The extension automatically detects when new .wandb files are created or updated and refreshes the view without manual intervention.
- No refresh button needed
- Works seamlessly with running training scripts
- Detects new runs added to folders
- Updates existing run views when files change
View comprehensive run information beyond just training metrics.
Run Metadata:
- GPU type and count
- Python version
- CPU count and CUDA version
- Git remote and commit
- Runtime start timestamp
System Metrics:
- GPU utilization and memory
- CPU usage
- Disk I/O
- Memory consumption
🔒 100% Offline & Private
Your training data never leaves your machine.
- Reads
.wandb files directly using protobuf
- No wandb CLI or API needed
- No internet connection required
- Works completely offline
- Zero telemetry on your training data (see Privacy section below)
Installation
Install from the VS Code Marketplace, or download the .vsix from releases:
code --install-extension wandb-viewer-0.2.2.vsix
Requirements
- VS Code 1.74.0 or higher
- Training runs created with wandb SDK 0.15+
Commands & Usage
| Command |
How to Access |
Description |
| Bread Wandb Viewer |
Right-click folder in Explorer |
Opens multi-run comparison view for all .wandb files in folder |
| Open .wandb file |
Click any .wandb file |
Opens single run view with charts and metadata |
Keyboard Shortcuts
| Action |
Shortcut |
| Zoom into region |
Click chart + drag |
| Pan across chart |
Shift + drag |
| Reset zoom |
Double-click chart |
Privacy & Analytics
This extension collects anonymous usage analytics to help improve the product. We take your privacy seriously.
What We Collect
- Feature usage (which features you use)
- Performance metrics (parse times, load times)
- Error events (crashes and bugs)
- Chart interactions (smoothing settings, zoom actions)
What We DO NOT Collect
- ❌ Run names or project names
- ❌ Metric values or training data
- ❌ File paths or code
- ❌ Hyperparameters or configurations
- ❌ Any personally identifiable information (PII)
How to Opt Out
Option 1: Via Settings UI
- Open Settings (
Cmd+, or Ctrl+,)
- Search for "telemetry level"
- Set Telemetry Level to "off"
Option 2: Via settings.json
- Open Command Palette (
Cmd+Shift+P / Ctrl+Shift+P)
- Type "Preferences: Open User Settings (JSON)"
- Add:
"telemetry.telemetryLevel": "off"
The extension respects your editor's global telemetry.telemetryLevel setting. Learn more about VS Code telemetry.
Technical Details
For developers and power users interested in how this extension works.
Architecture
- Binary Parsing: Direct protobuf parsing of
.wandb files (LevelDB-style format)
- No Dependencies: No wandb CLI, API, or internet connection required
- Performance: LRU cache (20 runs), LTTB decimation for large datasets, lazy chart initialization
- File Watching: Automatic detection of file changes with 1-second debouncing
- Chart Library: Chart.js 4.4.0 with zoom plugin for interactive visualizations
Supported Record Types
- HistoryRecord (per-step training metrics)
- ConfigRecord (hyperparameters)
- SummaryRecord (final summary stats)
- StatsRecord (system statistics)
- EnvironmentRecord (Python, GPU, host metadata)
- RunRecord (project name, run ID, display name)
- And 15+ other internal record types
- Quick Metadata: Reads only first 16KB for fast folder scanning
- Metric Decimation: LTTB algorithm for datasets >500 points
- Lazy Loading: Charts initialized only when visible
- LRU Cache: Parsed run data cached (max 20 runs)
- Debounced Updates: File changes debounced to 1 second
Actively Maintained
- ✅ Current version: 0.2.2
- ✅ Compatible with VS Code 1.74+
- ✅ Tested with wandb SDK 0.15+
- ✅ Open Source - contributions welcome
Issues & Support
Found a bug or have a feature request?
Why Bread Wandb Viewer?
Problem: Switching between VS Code and your browser to compare training runs breaks your flow and slows down iteration.
Solution: View and compare everything in VS Code. Multi-run comparison, AI context generation, and interactive charts - all without leaving your editor.
Result: Stay focused, iterate faster, and leverage AI coding assistants to analyze your experiments.
Made with ❤️ by Bread Technologies
