Local Logs Console — give your AI coding agent eyes on your app's logs


Local Logs Console runs an embedded MCP server so Claude Code, Cursor, or VS Code Copilot agent mode can query the runtime logs of the app you're building — while it's running, without you copy-pasting a stack trace into the chat. The tools are purpose-built for the agent loop, not a "grep the logs" wrapper: they're token-aware (a big log dump never floods the context window) and request-correlated (one error → its whole request story). Everything stays on your machine: logs are captured locally, secrets are redacted before storage, and the same data also drives a fast, filterable dashboard for when you want to look yourself.
The loop
- Your agent runs the app (
npm run dev, a test suite, whatever writes to stdout/stderr or a log file).
- Local Logs Console captures every line, redacts secrets, and stores it.
- The agent calls the MCP tools —
get_error_context is usually all it needs: hand it the latest error and get that error plus its whole request back, pre-trimmed. Or orient with get_log_stats, dig with search_logs / get_errors_since, and wait_for_logs to catch the output of an action it just took.
- It diagnoses, edits code, and repeats — no copy-pasting terminal output into the chat.
Connect your agent (MCP)
Run Local Logs Console: Copy MCP Setup for Coding Agents… from the Command Palette and pick your client:
- Claude Code: paste the copied
claude mcp remove local-logs; claude mcp add --transport http local-logs http://127.0.0.1:<port>/mcp --header "Authorization: Bearer <token>" into a terminal (idempotent — safe to re-run after a port/token change).
- Cursor: paste the copied JSON into
.cursor/mcp.json.
- Any other MCP client: paste the copied JSON into
.mcp.json at the project root, or use the plain endpoint + Bearer token snippet.
- VS Code Copilot agent mode (≥1.101): no setup — the server is auto-discovered via the MCP provider API.
Tip: set localLogViewer.mcp.port in your workspace settings (.vscode/settings.json) to pin a fixed port. Left at the default (0), the extension auto-picks a port and remembers it per workspace, so a saved agent config keeps resolving across restarts.
| Tool |
What the agent gets |
get_error_context |
the fast path — one error + its entire request (lines sharing the same req.id/traceId), or the surrounding lines when there's no id. Pre-filtered and token-budgeted |
get_request_trace |
the full ordered story of one request — pass a traceId or correlationId (e.g. the req.id nestjs-pino logs) |
get_errors_since |
errors newer than "5m", "2h", an HH:mm or ISO time |
search_logs |
full query grammar: level:error timeout, "phrase", -exclude, user.name:alice, after:14:30, /regex/i |
get_recent_logs |
newest N entries (filter by level/source) |
get_log_stats |
counts by level/source, time range, history cap, running captures — orientation call |
wait_for_logs |
long-poll: resolves when a matching log arrives — perfect for run-then-observe loops |
expand |
fetch the next slice of any response that was token-capped |
list_captures |
running commands/file tails |
What makes this MCP surface different
- 🎯 Token-aware by design. Every tool response has a hard token budget, and one giant log line or JSON payload is trimmed automatically. When there's more to see, the agent gets a small slice plus a
handle to expand — never a 40k-token wall of logs eating its context window. (Responses are text-only by default — no duplicated payload on the wire.)
- 🧵 Request correlation, zero instrumentation.
get_error_context reconstructs the whole request behind an error by grouping every line that shares a req.id / reqId / request_id / traceId. If you use nestjs-pino or pino-http, that id is already in each line — no code changes — so the agent reads one coherent story instead of interleaved noise from concurrent requests.
- 🔒 Read-only & fully local. The server can't start, stop, or change anything; it binds to
127.0.0.1, requires a Bearer token, and only ever serves already-redacted content.
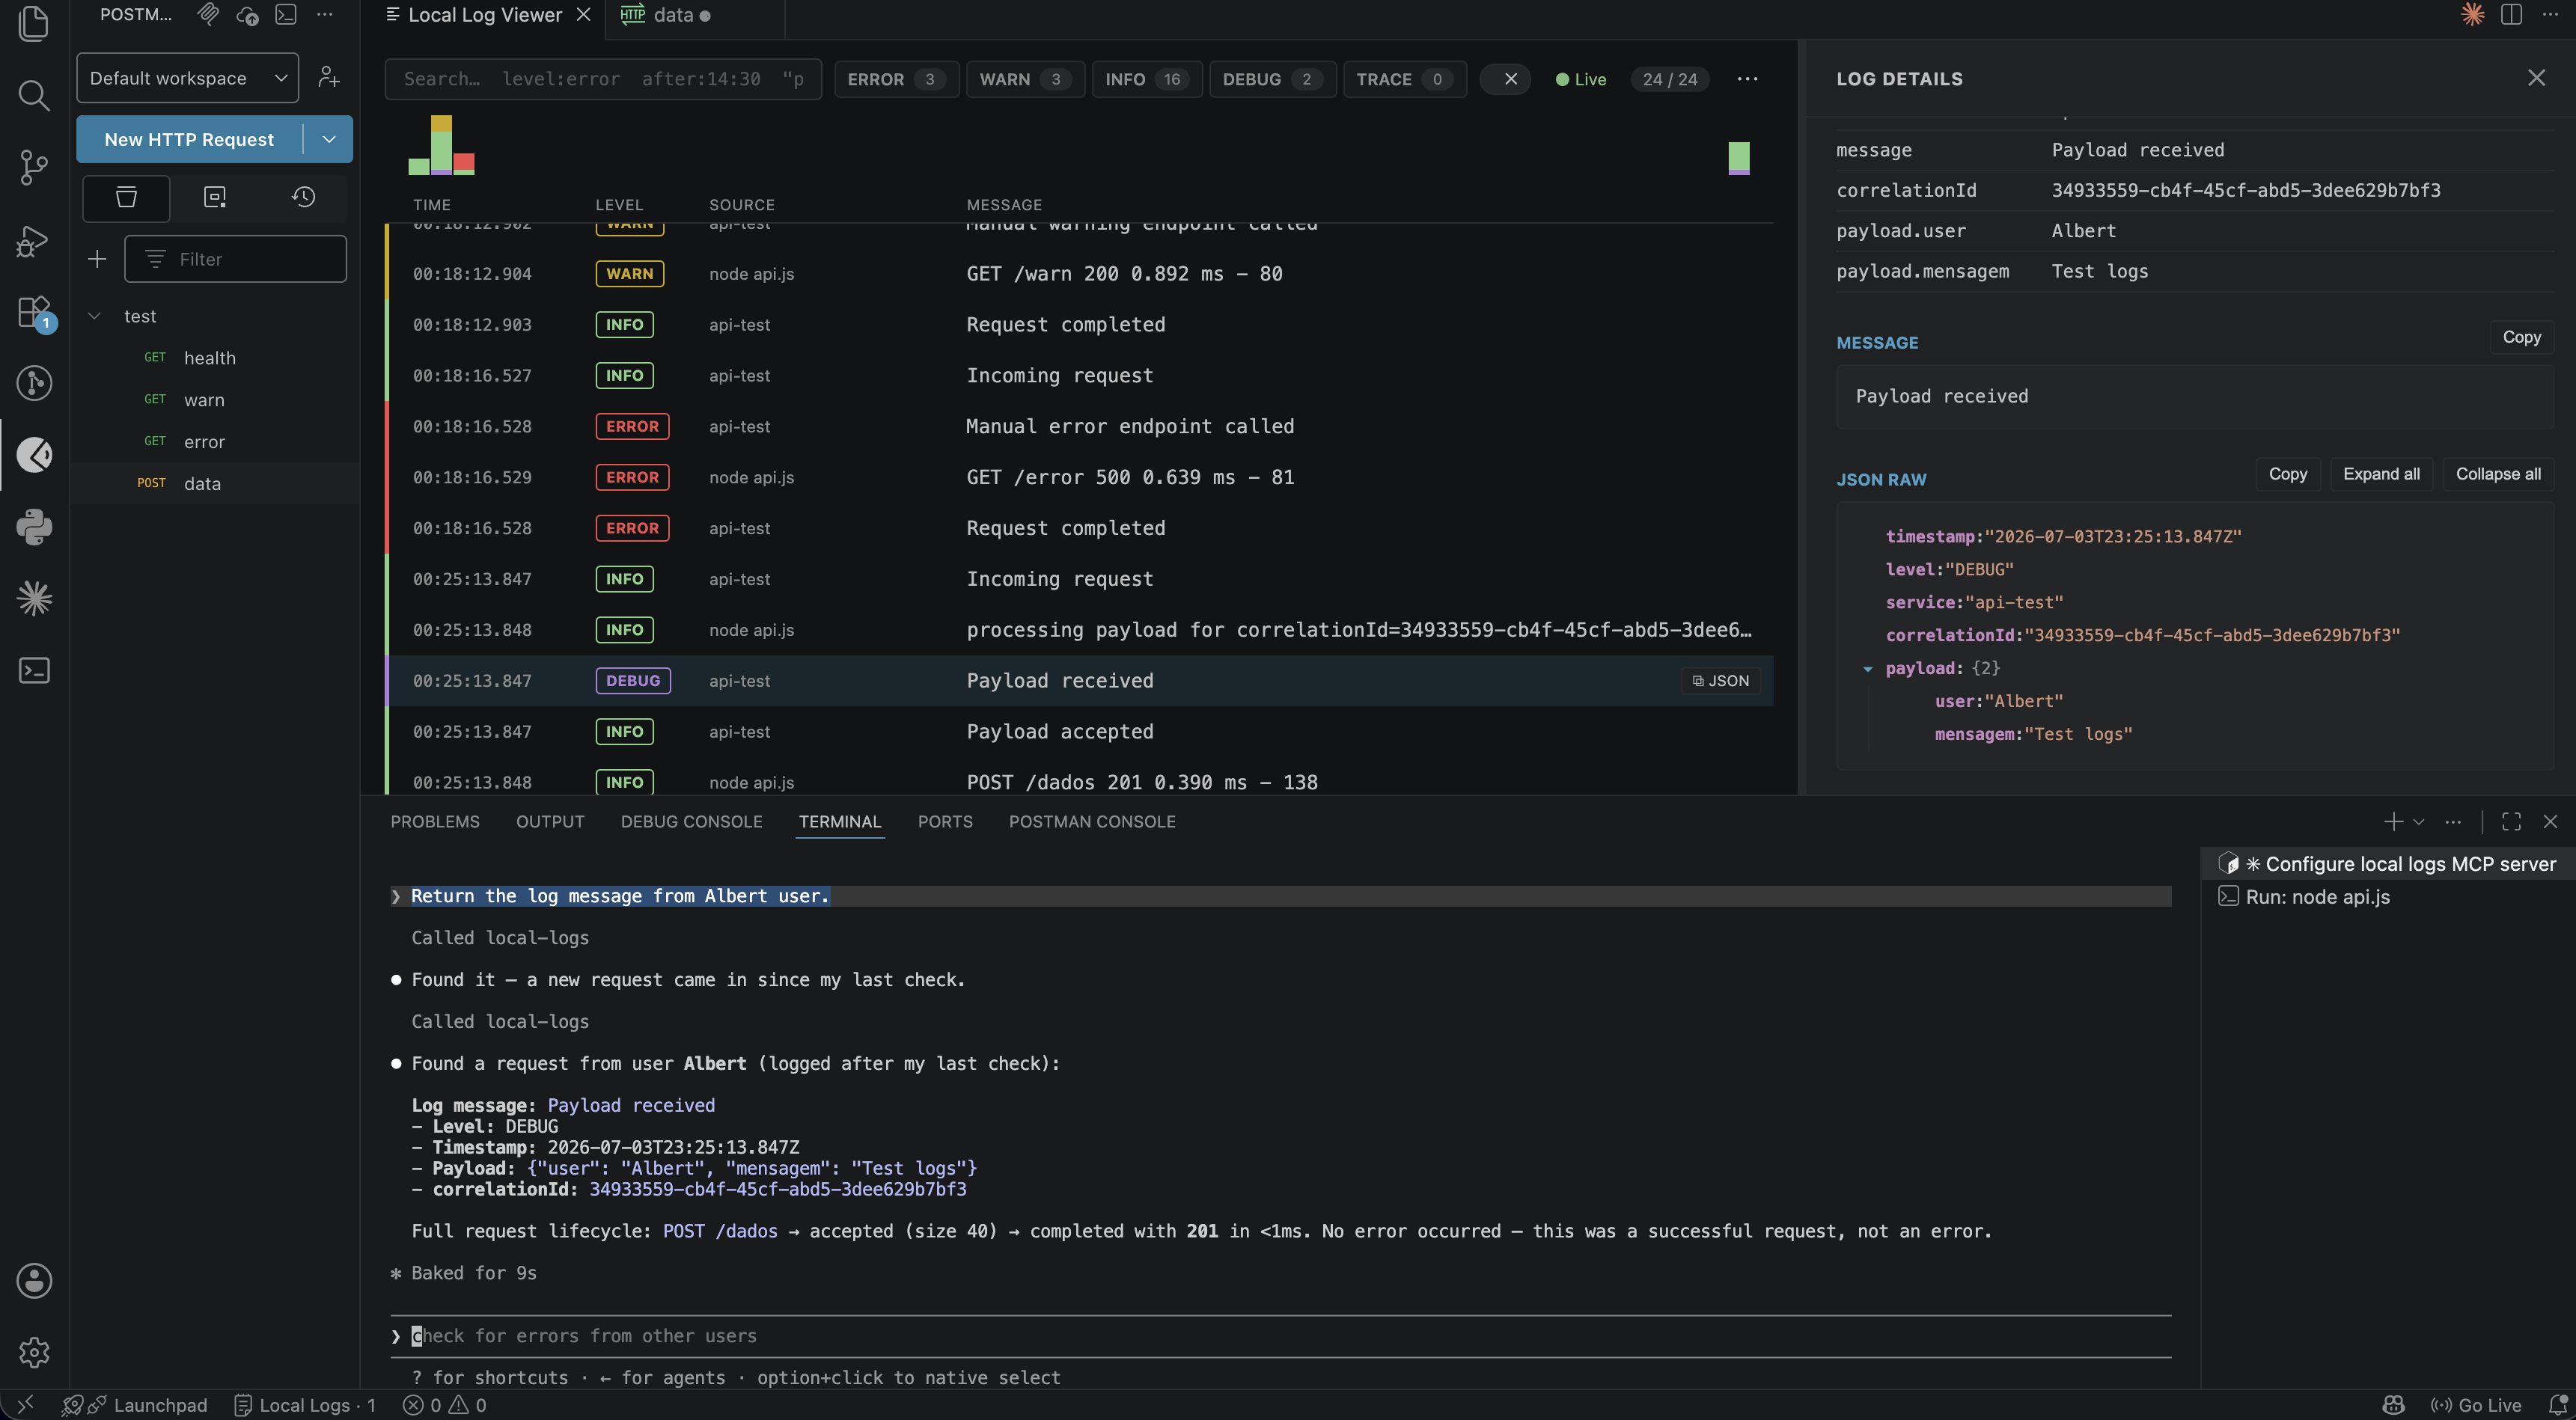
In action — a coding agent connected to the local MCP server, querying the captured logs while it debugs:
Why this extension
- Fully local: no telemetry, no remote log shipping — the webview's Content Security Policy blocks all outbound connections (
connect-src 'none'), and the MCP server never listens beyond 127.0.0.1.
- Secret redaction at ingest: AWS keys, bearer tokens, JWTs, GitHub/Slack/Google tokens, password fields and URL credentials are masked with
[REDACTED] before logs are stored — the dashboard, exports, and every agent query see redacted content by construction.
- Built for volume: a virtualized list keeps the UI smooth at a 10,000-entry history cap, live-tailing while you scroll.
- Any stack: anything that writes to stdout/stderr or a log file, plain text or JSON, mixed is fine.
Features
- Embedded MCP server — read-only, token-aware, request-correlated tools over your captured logs for Claude Code, Cursor, and Copilot agent mode (see above).
get_error_context turns "here's an error" into "here's the whole request that failed" in one call.
- Live dashboard — virtualized list, live-tail with a "jump to latest · N new" pill, millisecond timestamps, comfortable/compact density.
- Advanced search — terms are AND-ed; supports
"quoted phrases", -exclusions, field:value filters and safe /regex/i (see syntax below) — the same grammar the MCP tools use.
- Severity facets — one-click Error/Warn/Info/Debug/Trace pills with live counts.
- Volume timeline — stacked histogram by severity; click a bar to filter to that time bucket, drag to select a range, clear from the toolbar chip.
- Detail panel — flattened attribute table (click a value to add a
field:value search token), message block, collapsible JSON tree, copy-to-clipboard.
- Copy raw JSON anywhere — hover any row (or press
c on a selected row) to copy the entry's full structured payload, ready to paste into an AI assistant or a bug report.
- Run & capture — execute any shell command (e.g.
npm run dev) in a real integrated terminal while the dashboard captures the stream. Saved commands with an MRU picker and a management UI.
- Follow files — tail
.log/.txt files (rotation-aware), from the dashboard, the Command Palette or the explorer right-click menu.
- Sidebar — Activity Bar view with running captures (inline stop) and saved commands (run/edit/remove). Closing the dashboard does not kill captures; the status bar shows the active count.
- Export — NDJSON, JSON or plain text; all logs or just the current filtered view.
- Safe process teardown — stopping a capture terminates the whole process tree (SIGINT → SIGTERM → SIGKILL escalation;
taskkill /T /F on Windows), so dev-server children never leak.
- Accessible — full keyboard navigation, screen-reader announcements,
prefers-reduced-motion support.
Getting started
- Open the Local Logs icon in the Activity Bar (or press
Ctrl/Cmd+Alt+L).
- Pick Run a Command (e.g.
npm run dev) or Follow a Log File.
- Filter, search and click any row for structured details — or connect an agent via MCP (above) and let it query the same data.
Search syntax
| Query |
Meaning |
error timeout |
entries containing error and timeout |
"connection refused" |
exact phrase |
-healthcheck |
exclude entries containing healthcheck |
level:error |
severity filter (level:, source:, message:, correlationId:, traceId:) |
user.name:alice |
dotted path into the structured payload |
after:14:30 · before:2026-07-02T15:00 |
date/time filters (aliases since:/until:); accepts HH:mm(:ss) for today, YYYY-MM-DD, or ISO date-times |
/timeout \d+ms/i |
regular expression (length-capped and ReDoS-guarded) |
correlationId: and traceId: are auto-populated from the fields Node/Nest loggers actually emit — req.id (nested), reqId, requestId, request_id, x-request-id, and trace_id — so correlationId:abc123 (or the aliases reqId: / requestId: / request_id:) groups a whole request even when your logger only writes req.id.
Press / to focus the search box; a syntax popover appears on focus.
Keyboard shortcuts
| Keys |
Action |
Ctrl/Cmd+Alt+L |
Open the dashboard |
Ctrl/Cmd+Alt+Shift+L |
Run the last command |
/ or Ctrl/Cmd+F |
Focus search (Esc clears) |
↑ / ↓ |
Move row selection |
Enter / Space |
Open details · Esc closes |
c |
Copy the selected entry's raw JSON |
Home / End |
Jump to first / last row |
Ctrl/Cmd+End |
Resume live tail |
Commands
Local Logs Console: Open DashboardLocal Logs Console: Run and Capture CommandLocal Logs Console: Follow Log FileLocal Logs Console: Run Last Command (asks for confirmation by default)Local Logs Console: Manage Saved CommandsLocal Logs Console: Stop All CapturesLocal Logs Console: Export Logs…Local Logs Console: Copy MCP Setup for Coding Agents…
Settings
| Setting |
Default |
Description |
localLogViewer.mcp.enabled |
true |
Local MCP server for coding agents (127.0.0.1, token-protected) |
localLogViewer.mcp.port |
0 |
0 = random port per start; pin per workspace for stable agent configs |
localLogViewer.historyLimit |
10000 |
Max entries kept in history (FIFO) |
localLogViewer.tail.seedBytes |
10240 |
Trailing bytes loaded when a file tail starts |
localLogViewer.redaction.enabled |
true |
Mask secrets before logs are stored/displayed |
localLogViewer.redaction.useDefaultPatterns |
true |
Use the built-in secret patterns |
localLogViewer.redaction.patterns |
[] |
Extra regex patterns to redact (case-insensitive) |
localLogViewer.confirmRunLastCommand |
true |
Confirm before re-running the stored command |
localLogViewer.capture.inheritEnvironment |
true |
Off = children get a minimal env (no secrets from env vars) |
Security
- No network: logs are never sent anywhere; the dashboard's Content Security Policy blocks all outbound connections and inline scripts (nonce-based CSP).
- MCP server: binds to
127.0.0.1 only, requires a Bearer token (stored in your OS keychain), validates the Origin header against DNS rebinding, and is strictly read-only. Disable with localLogViewer.mcp.enabled: false.
- Redaction at ingest: secrets are masked before entering history, so the UI, clipboard copies, exports, and every MCP tool response are redacted by construction. Treat it as defense-in-depth, not a guarantee.
- Workspace Trust: the extension executes shell commands, so it is disabled in untrusted workspaces (
untrustedWorkspaces.supported: false).
- Commands run locally with your privileges — only run commands you trust.
See SECURITY.md for the threat model and how to report vulnerabilities.
Compatibility
macOS, Windows and Linux (CI runs on all three). No proposed VS Code APIs, no runtime dependencies, VS Code ≥ 1.75.
Development
npm install
npm run compile   # host tsc + webview typecheck + esbuild bundle
npm run watch     # parallel watchers, used by F5
npm run lint
npm test
npm run package   # build the .vsix
Open source project standards
Contributions and issues are welcome.
| |