vscode-pharo

A Pharo client extension for VSCode.
Supported files
This extension support .st files and .class.st files (tonel format)
Features
We present here the existing features
Generic feature
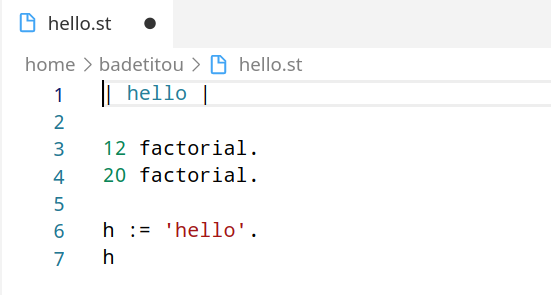
Code highlighting
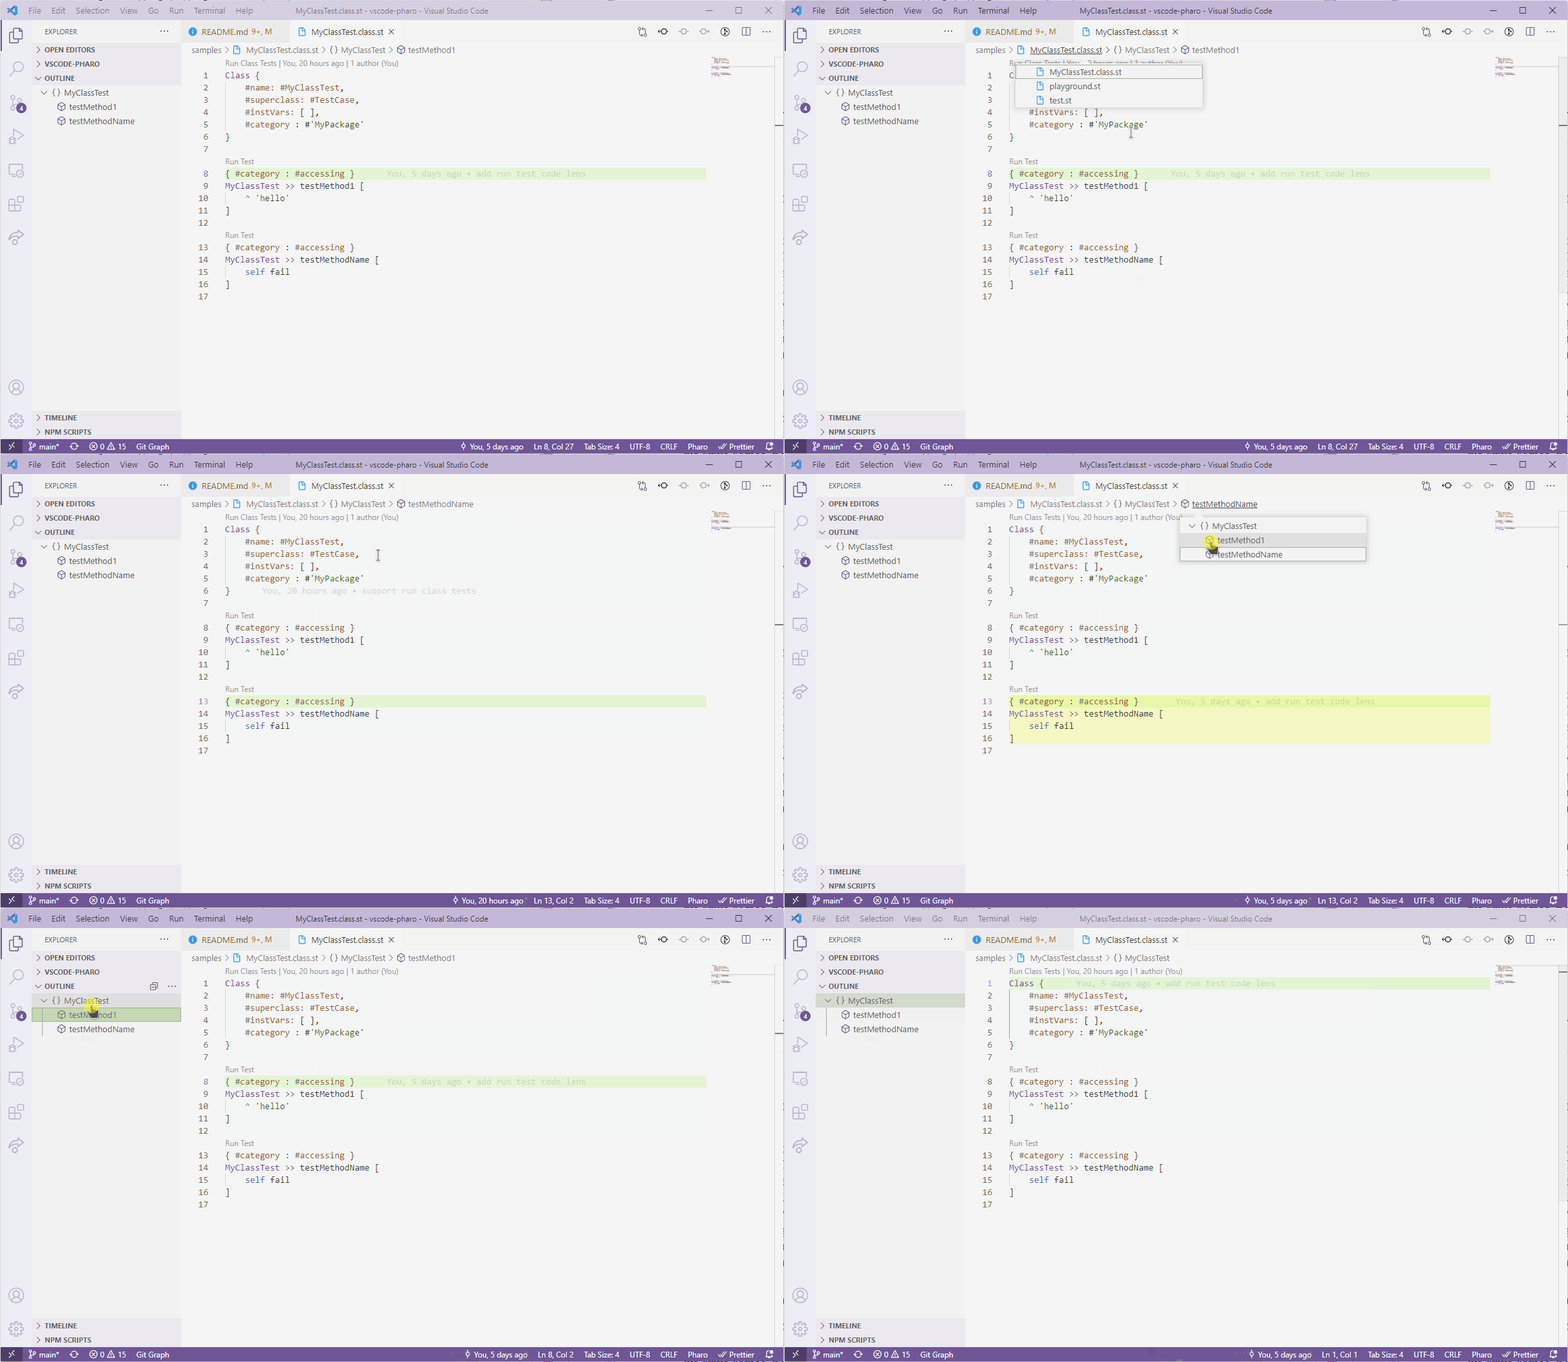
Breadcrumbs & Outline
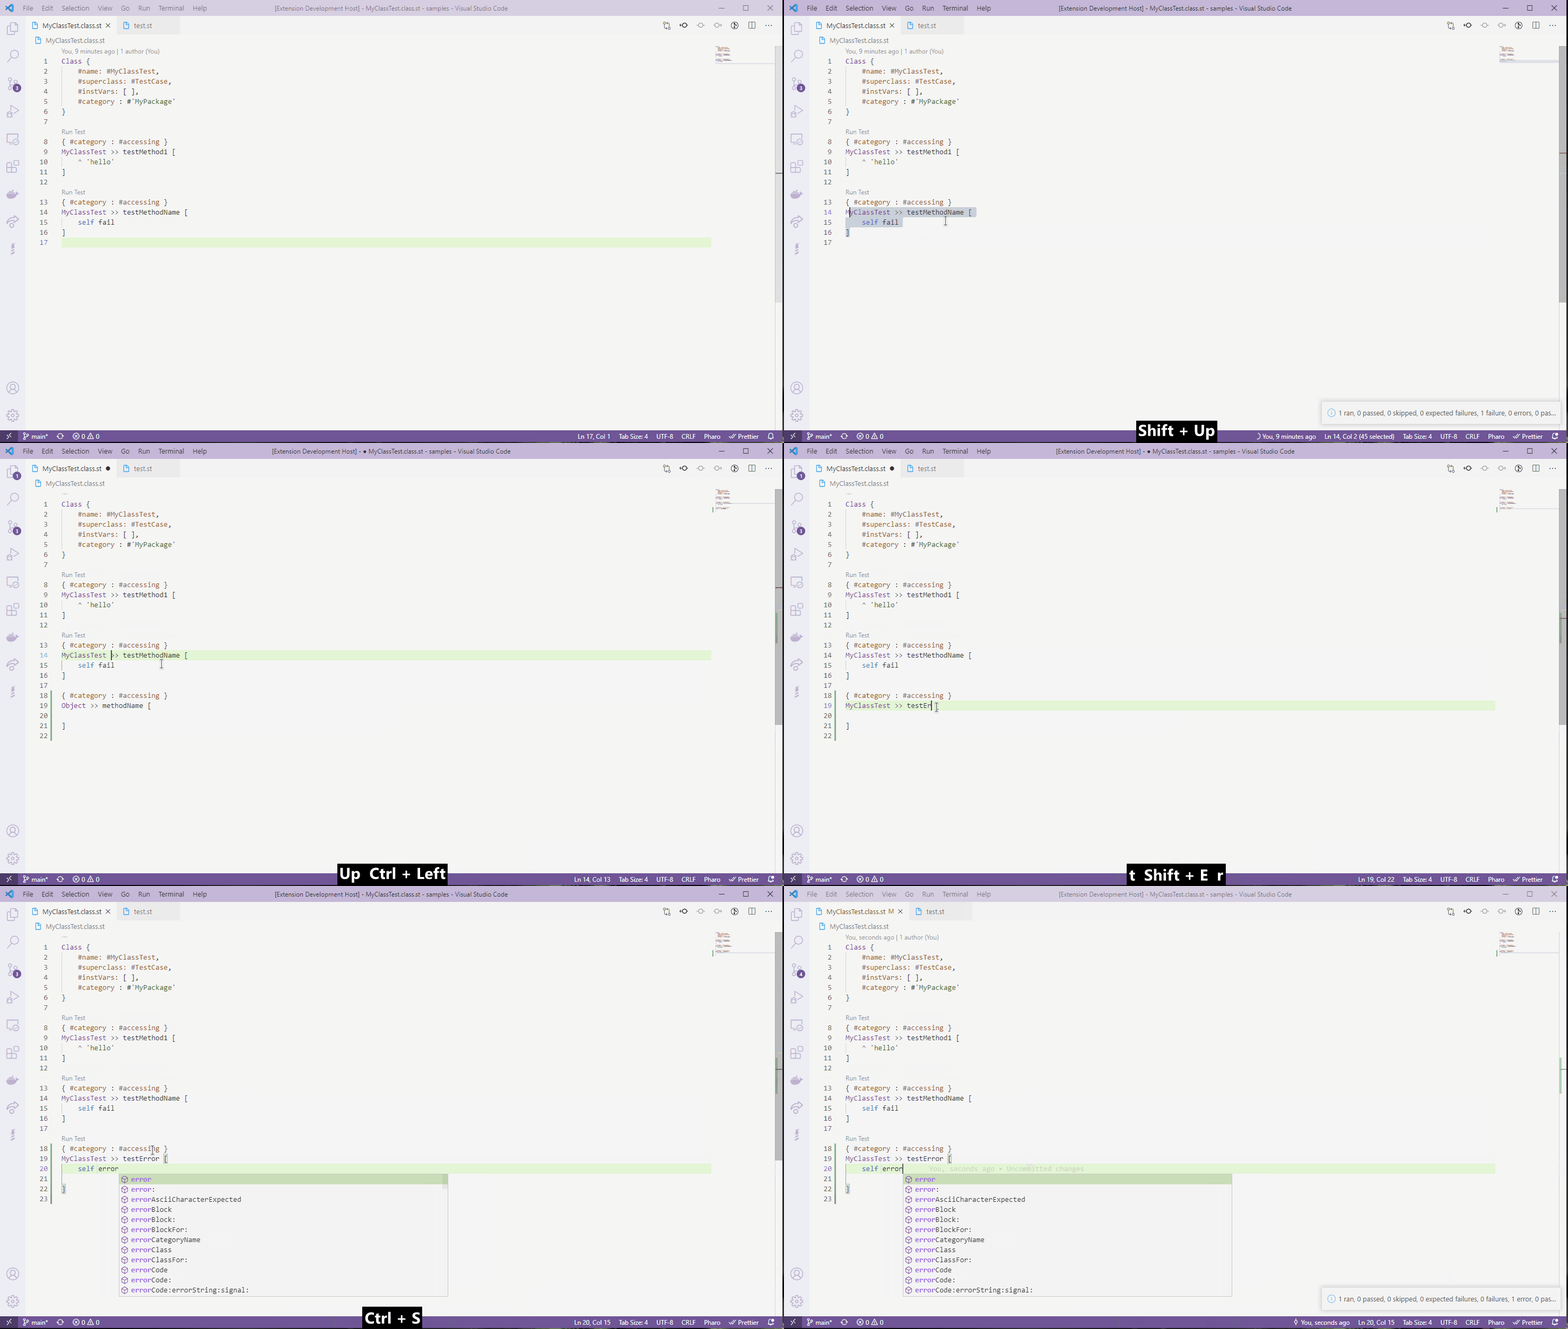
Native tests support
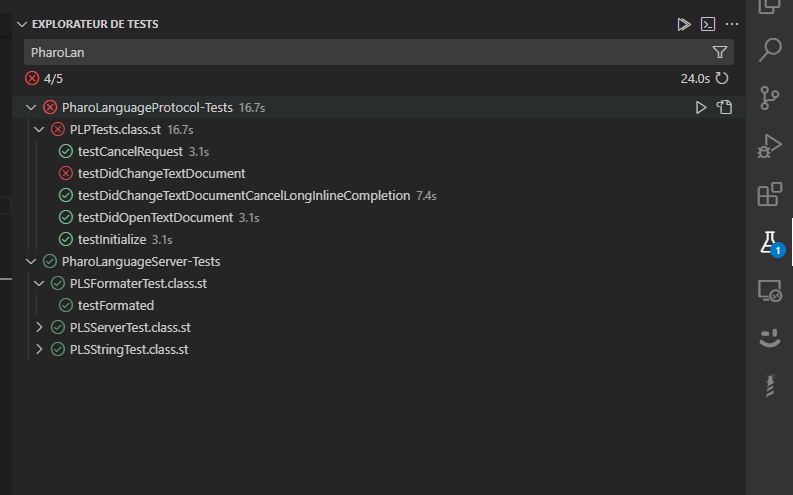
The native Test Explorer integration requires Pharo Language Server 5.0.1 or later.
Supported Language Server feature
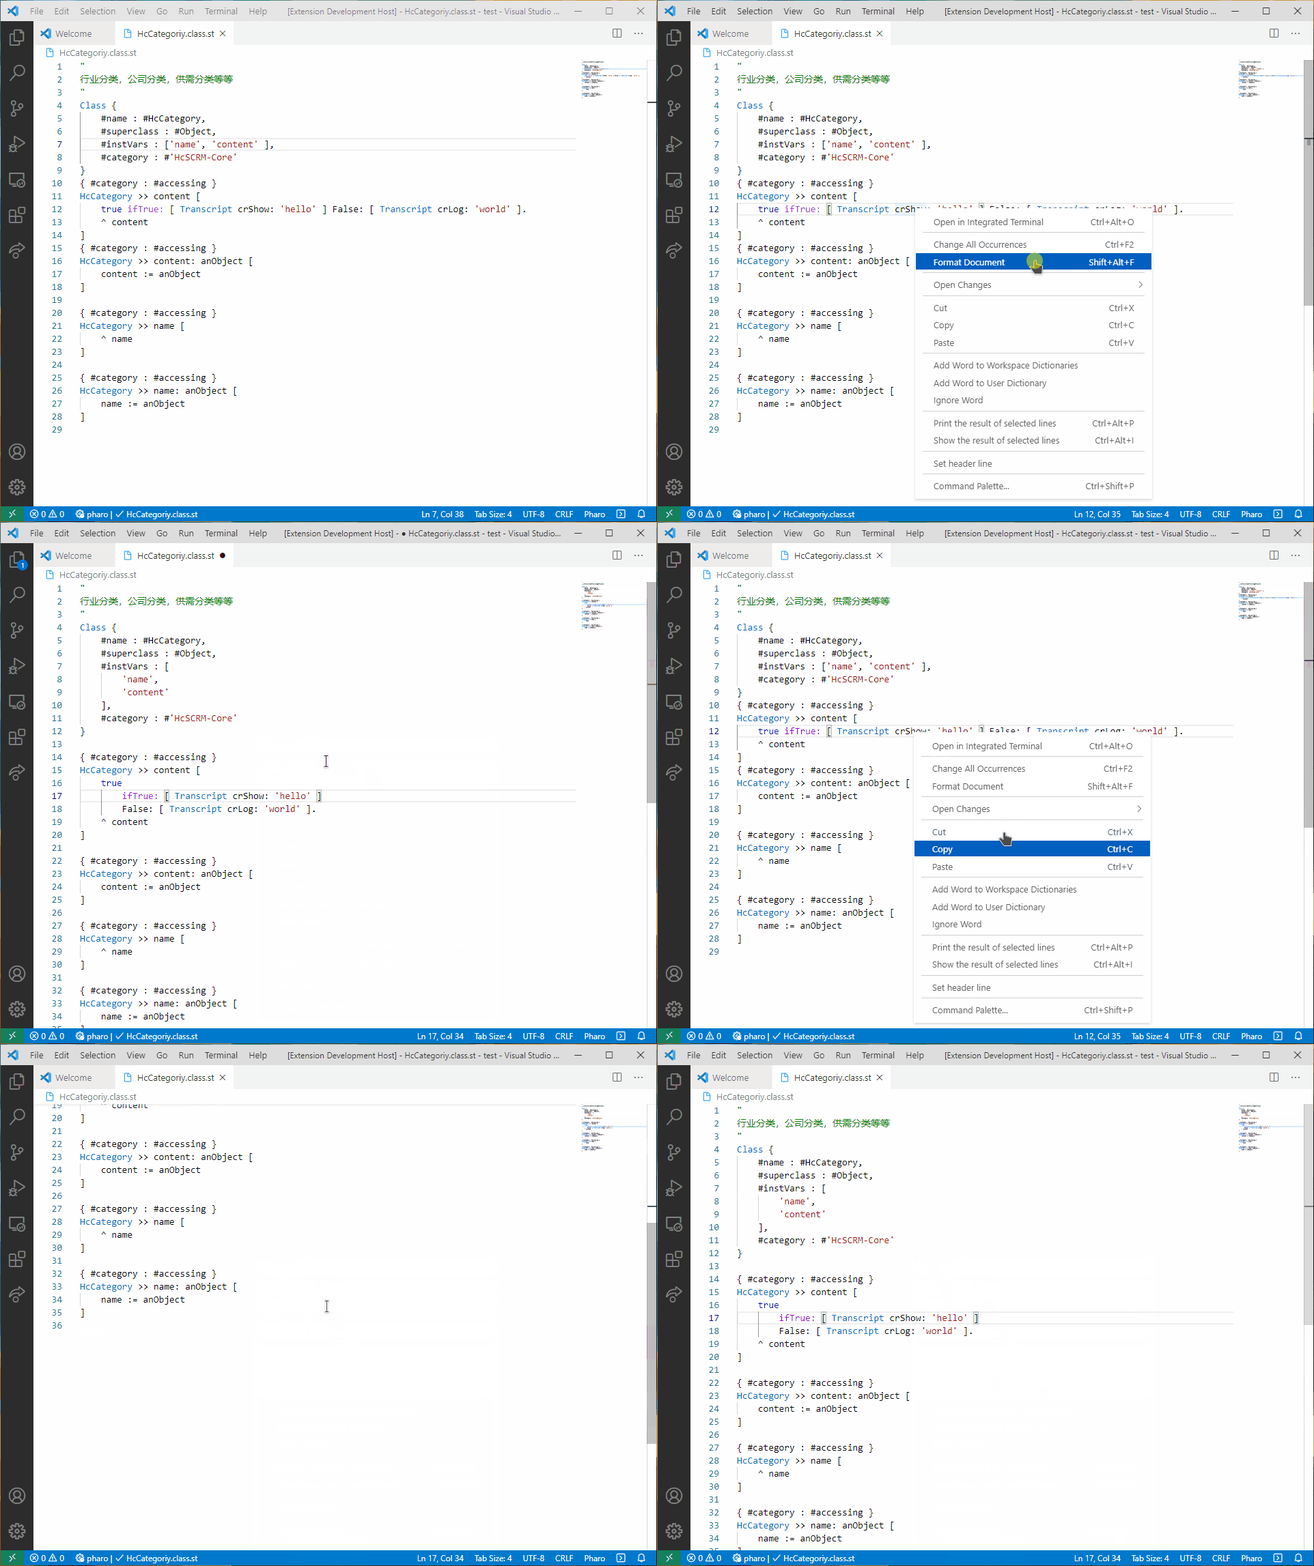
Code formatting
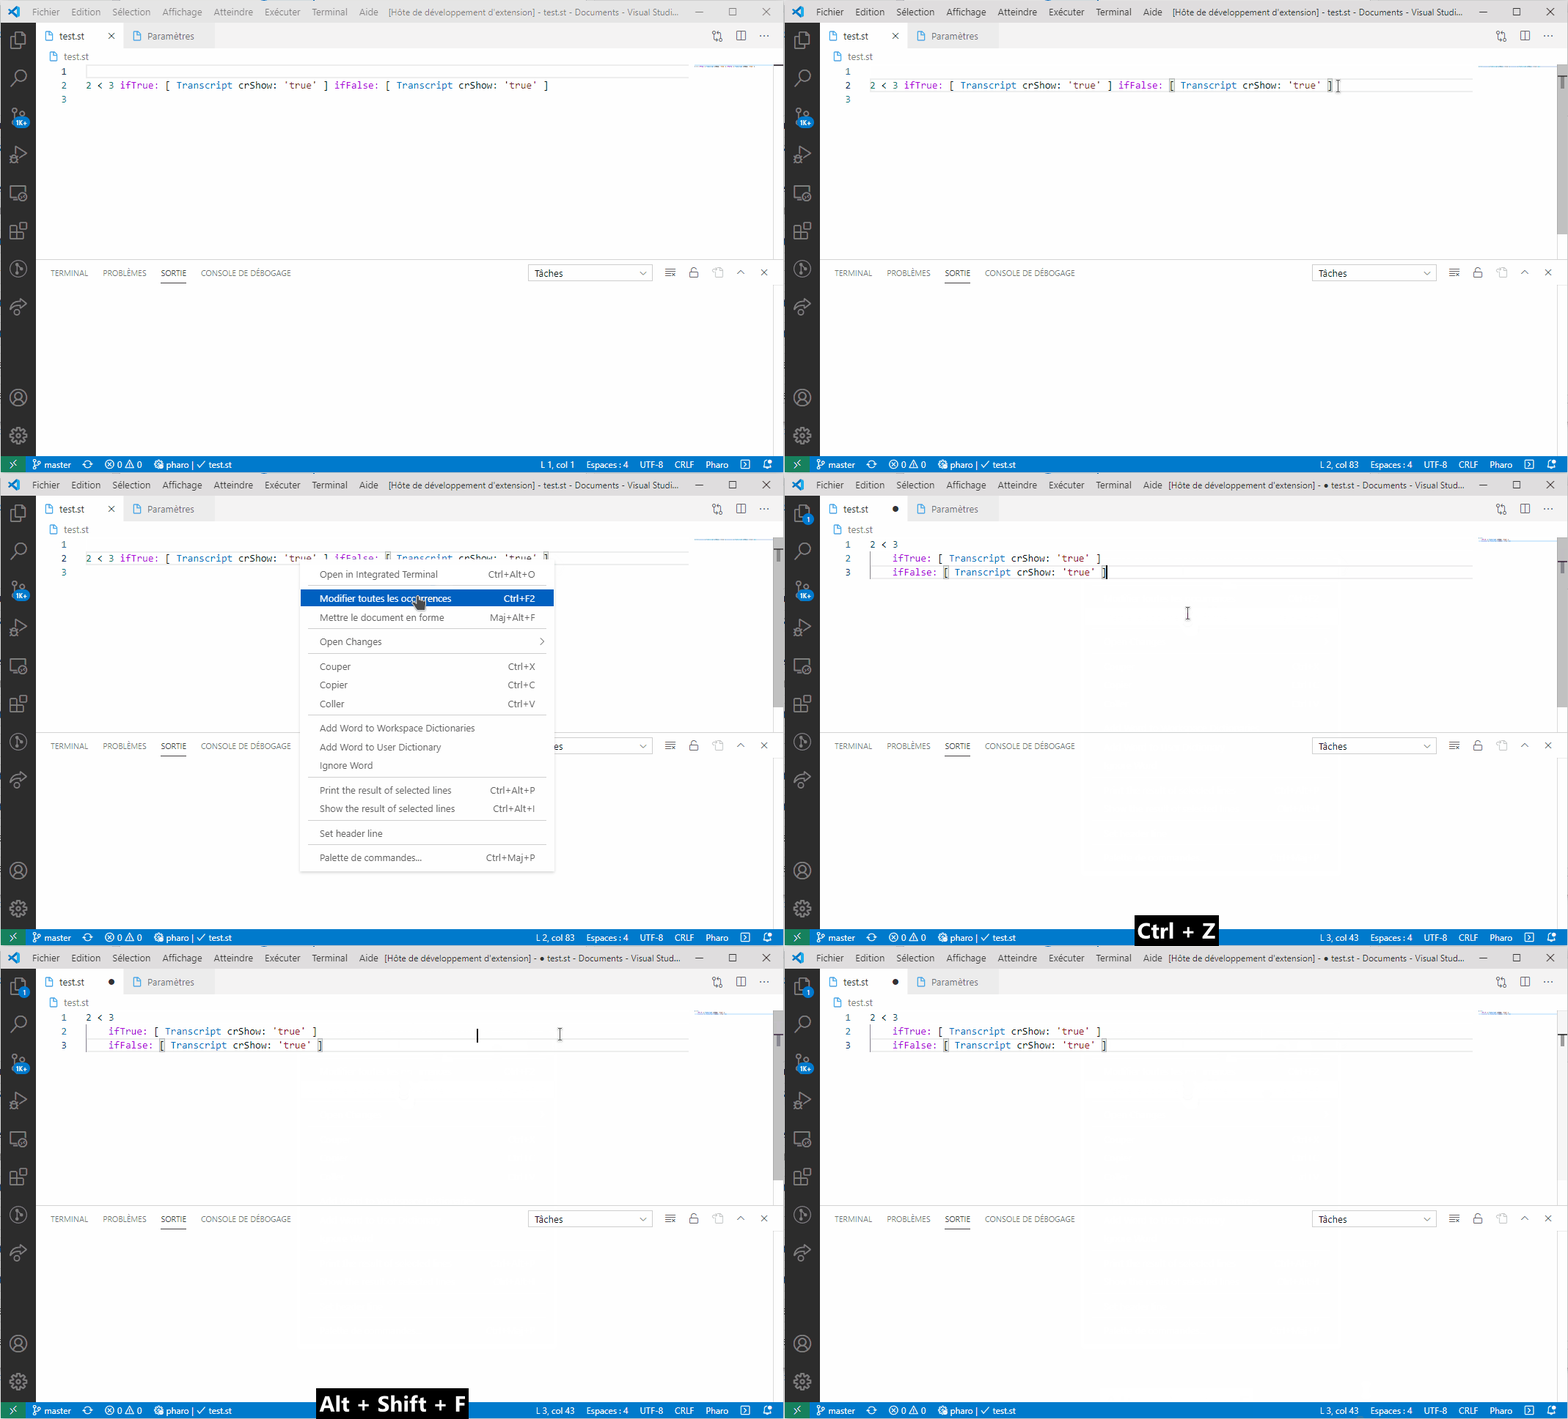
Tonel file formatting
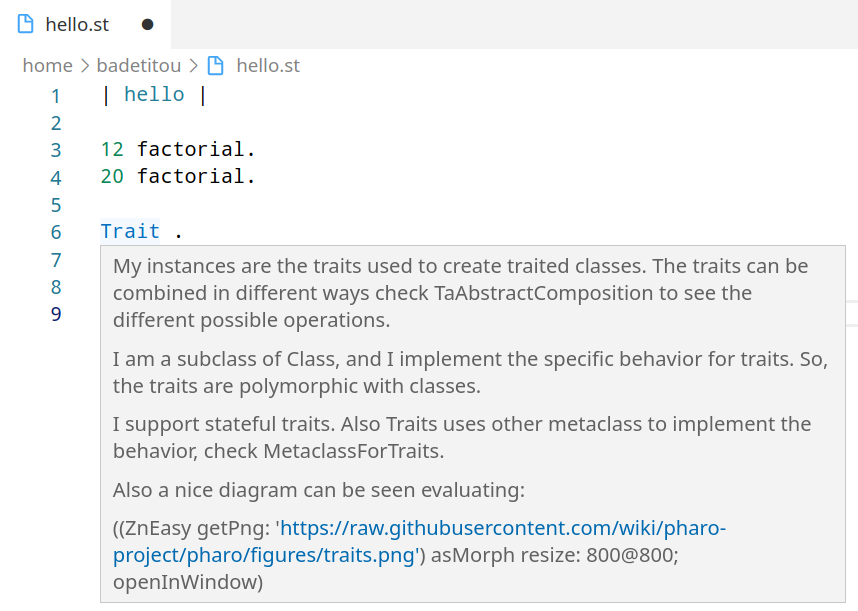
Hover
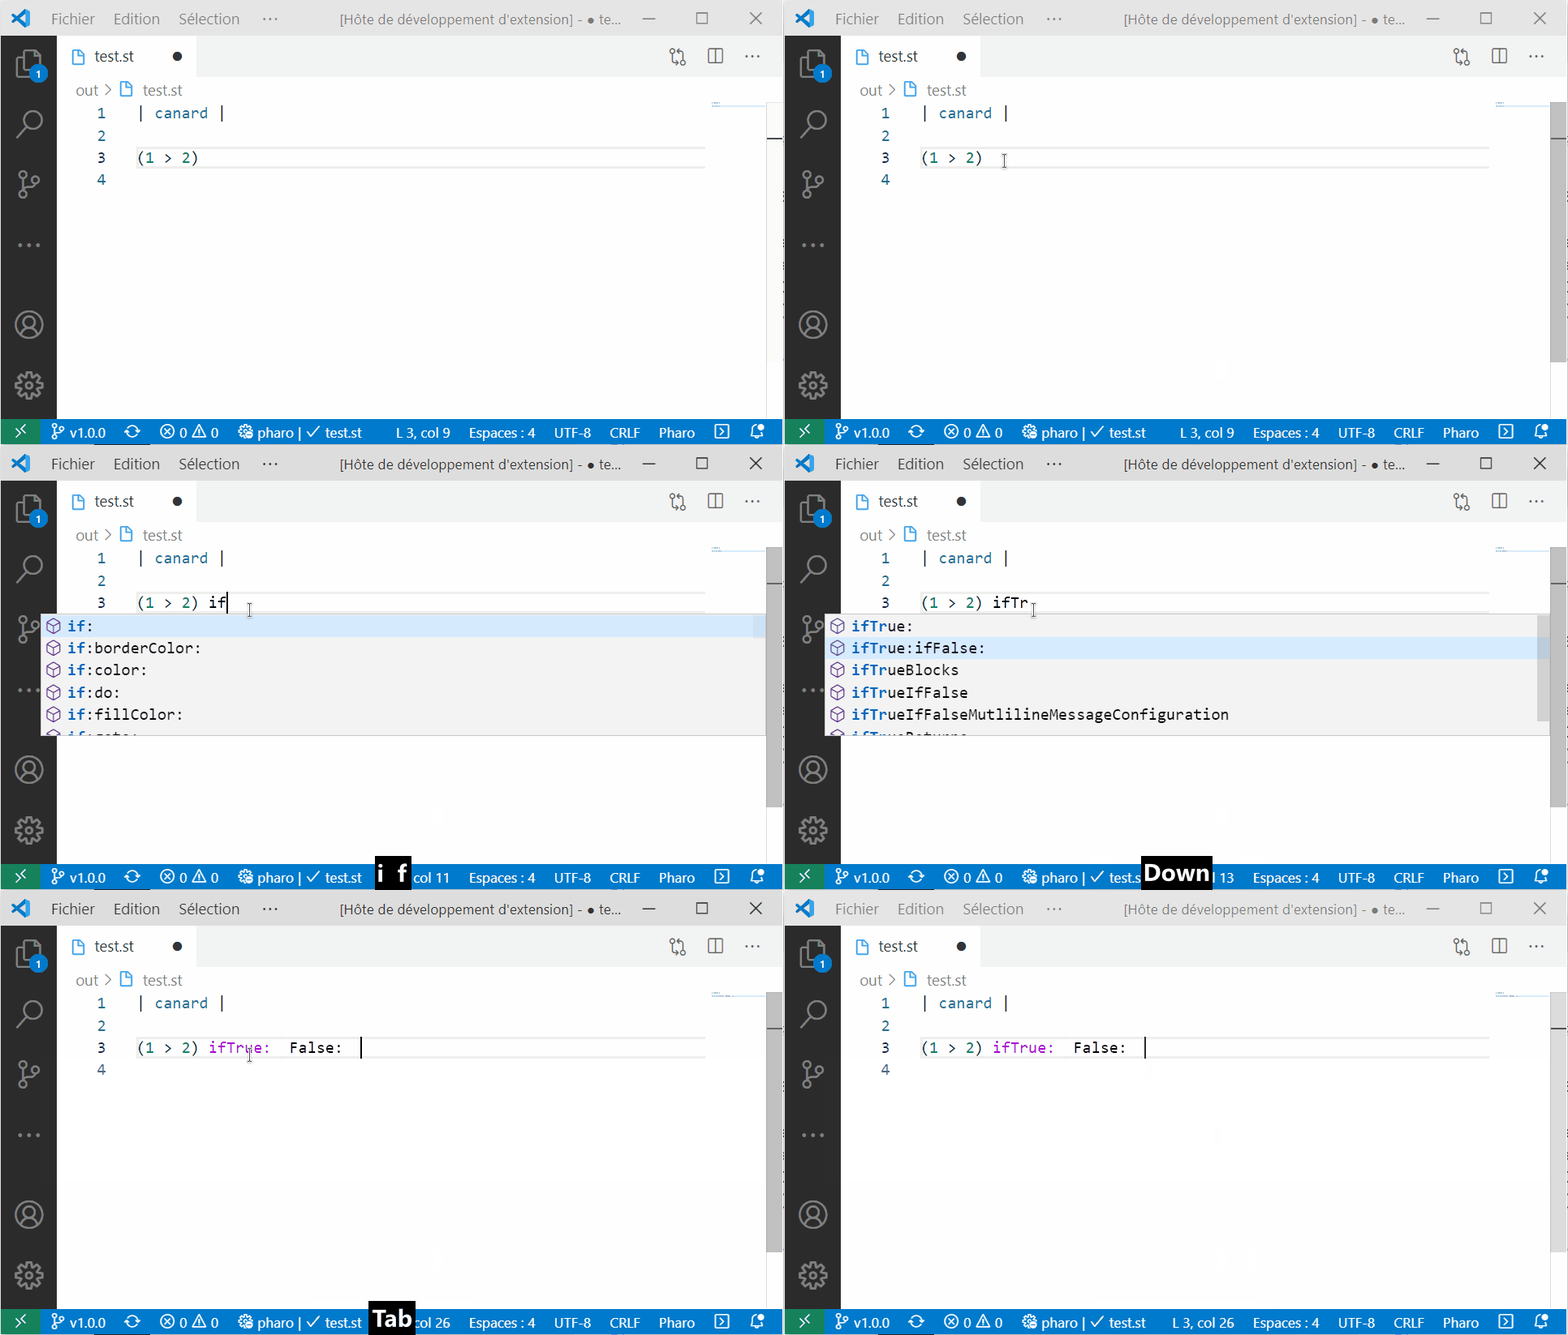
Auto-completion
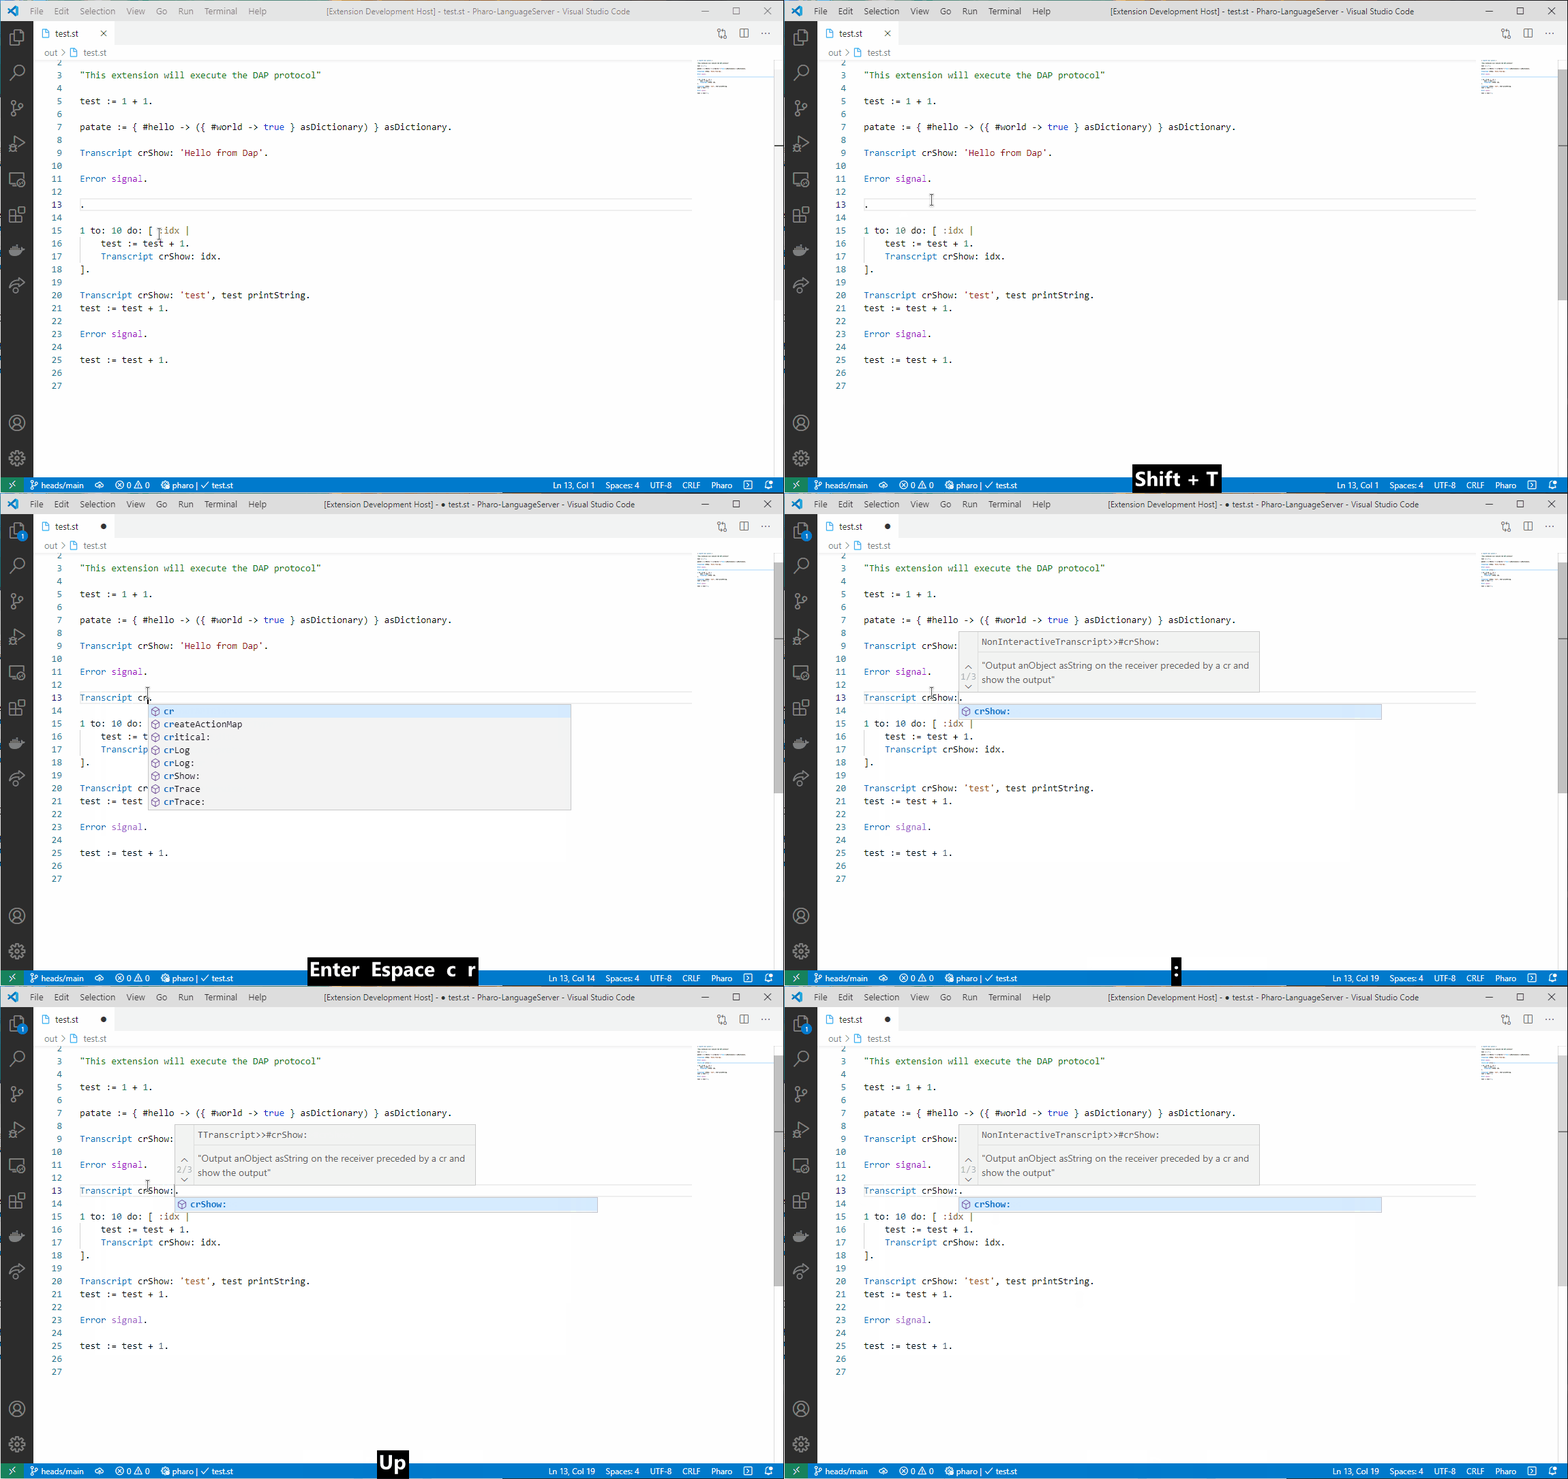
Help with method signature
Diagnostics
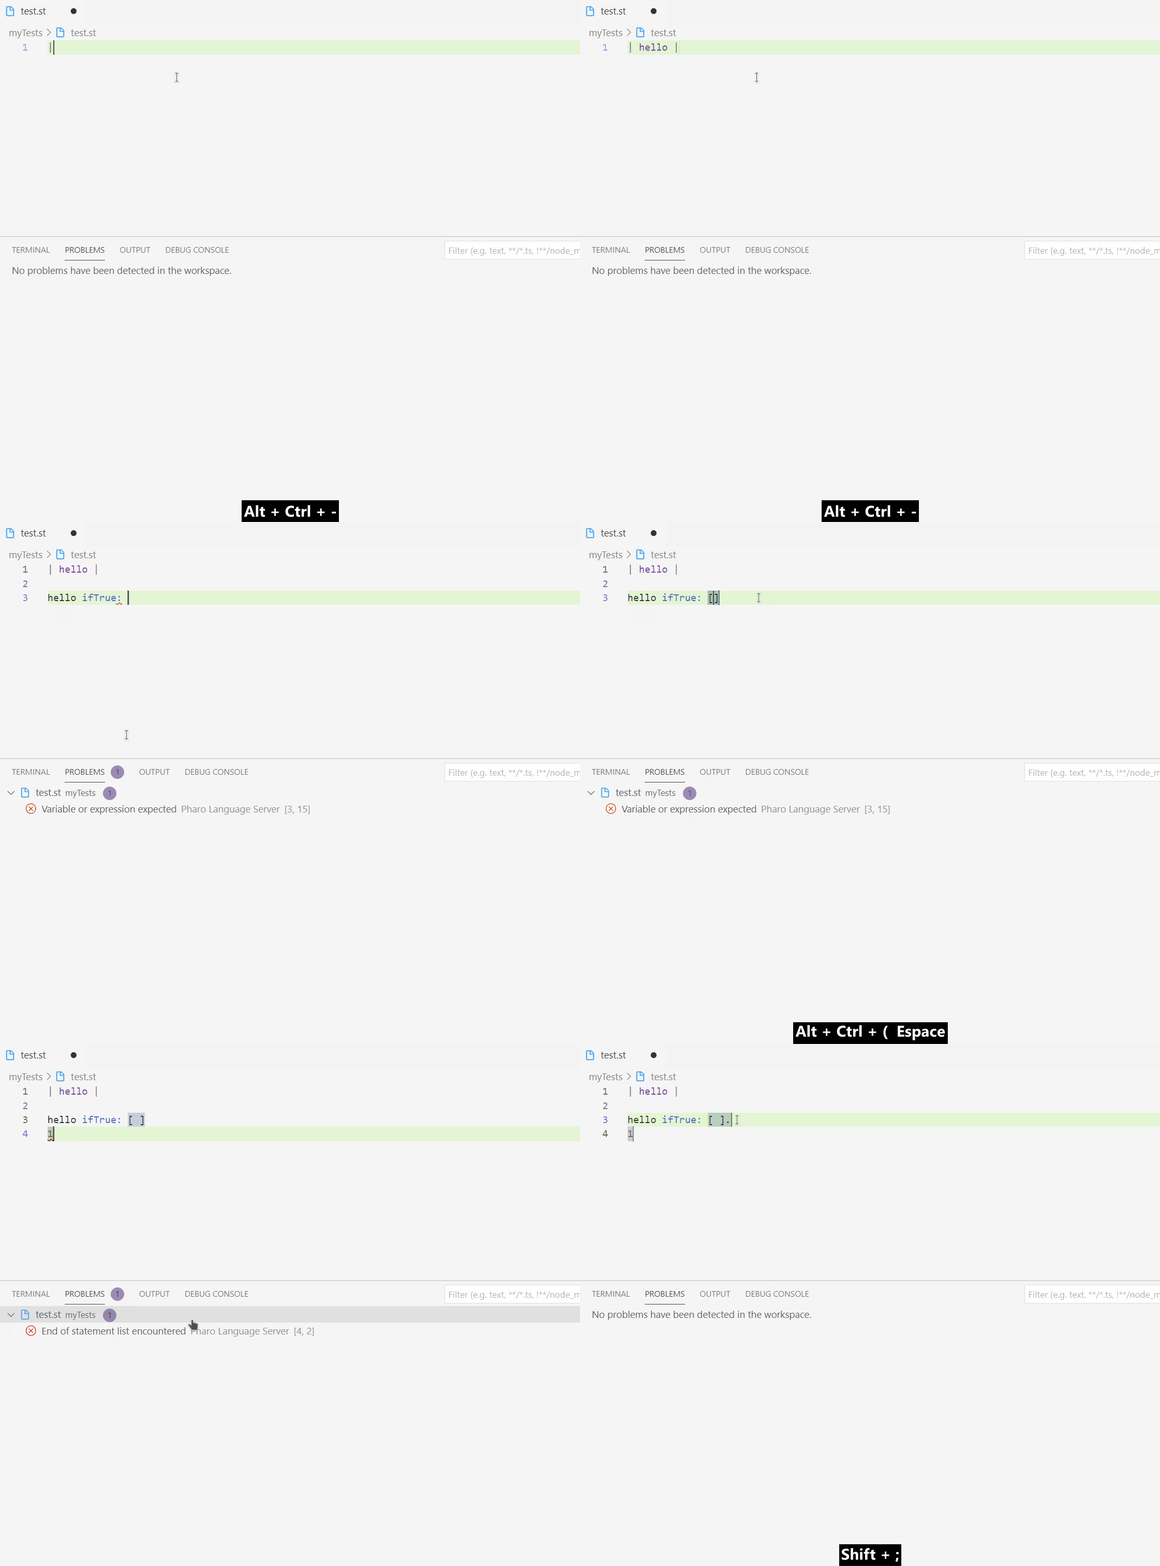
Code critiques
The critiques of Renraku, the code critics of Pharo, show in the Problems panel when a document opens or is saved. Their quick fixes apply the transformation of the rule, or ignore the rule for the method, the class or the package, in the package manifest as in Pharo. The setting pharo.critiques.enabled turns them off.
Code Lens (Run Tests)
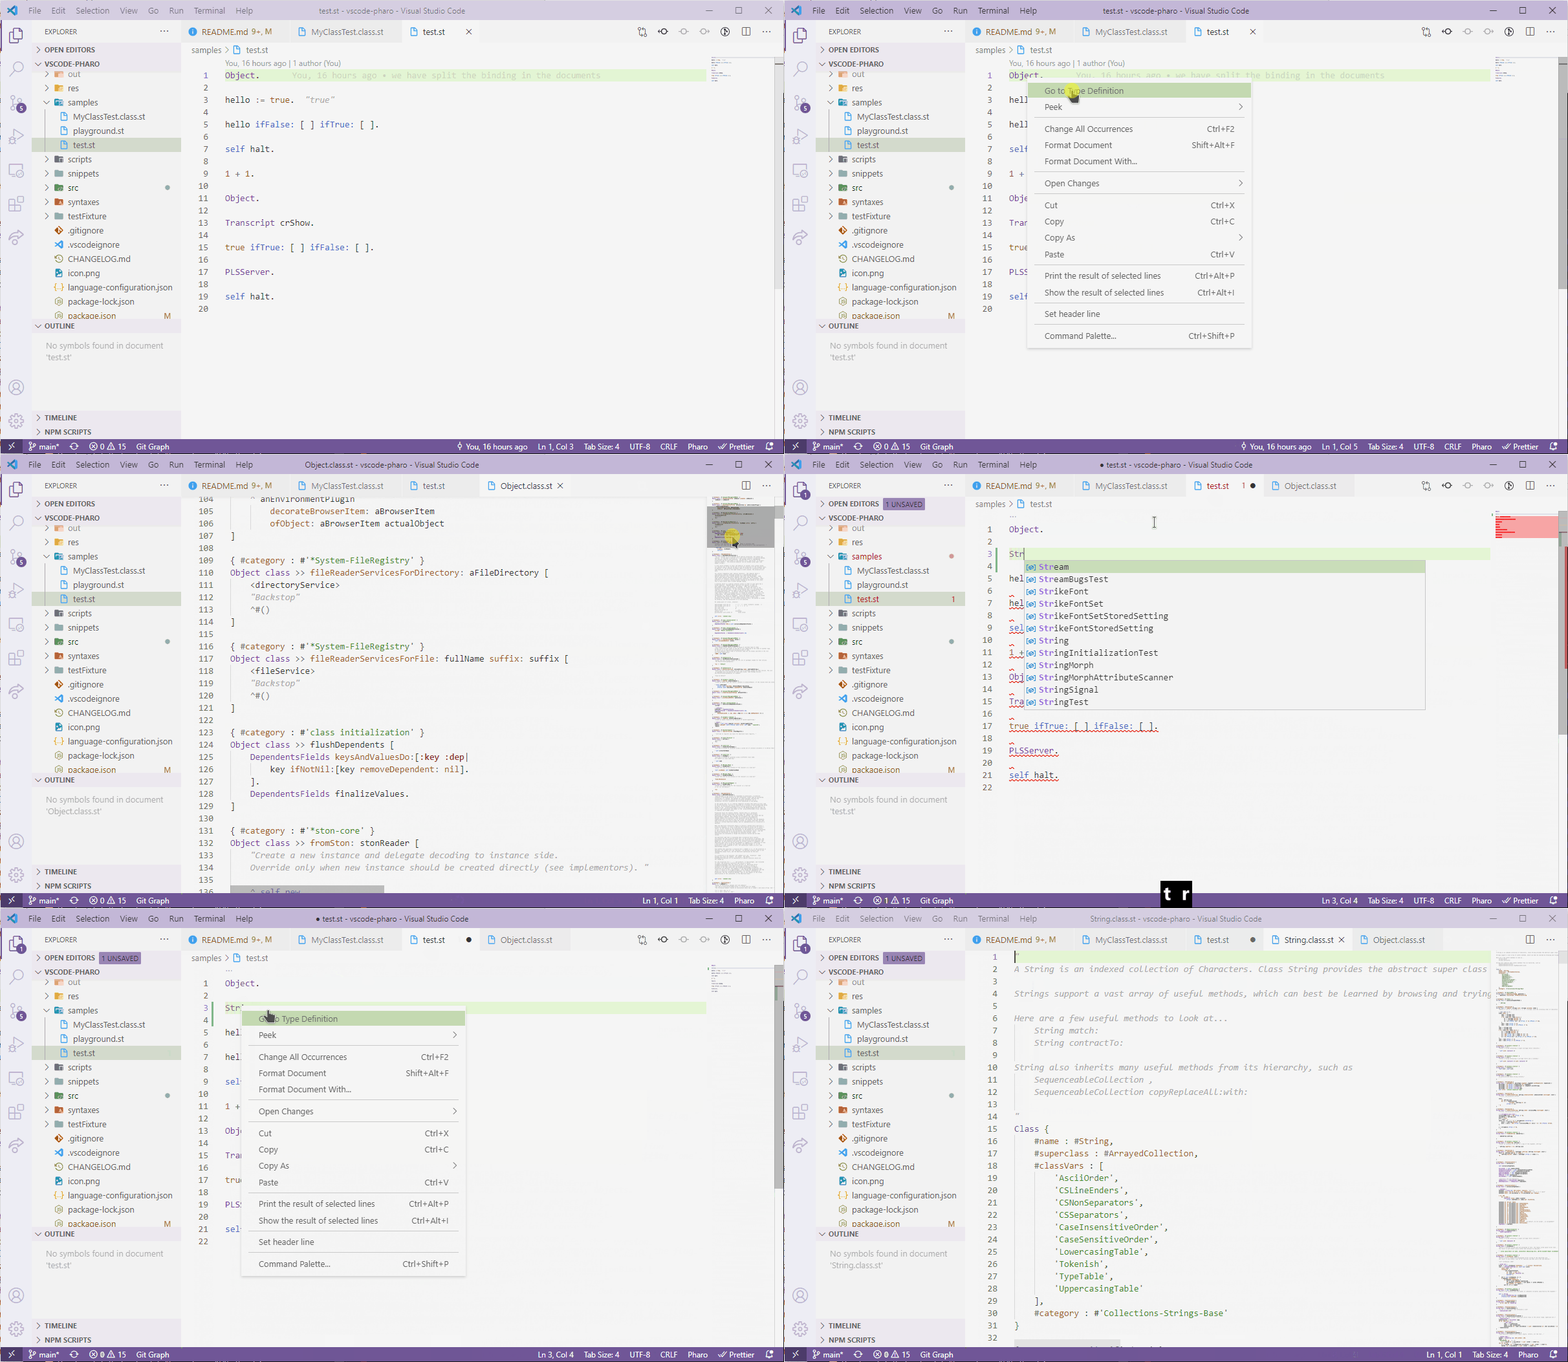
Jump type Definition
Debug Adapter Protocol feature
- Break on halt
- Show the stack
- Show the variables
- Add watch
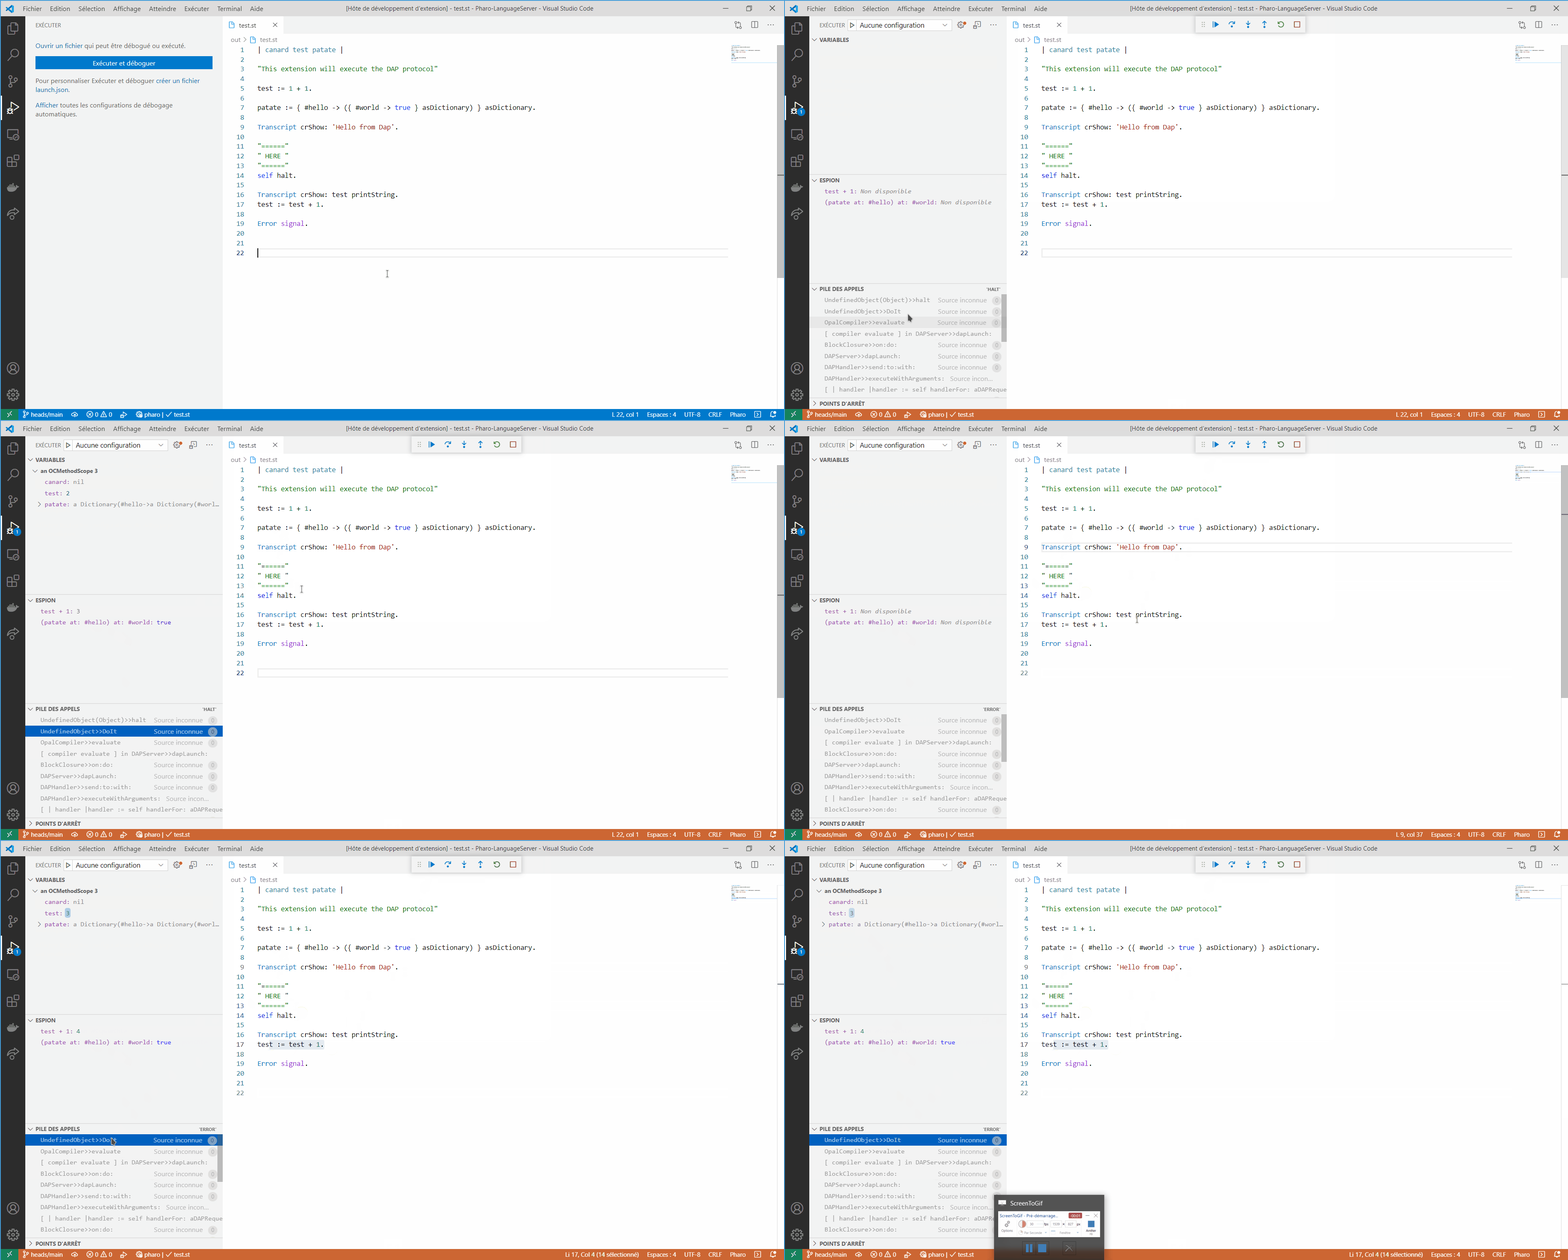
- Step, step in, step out
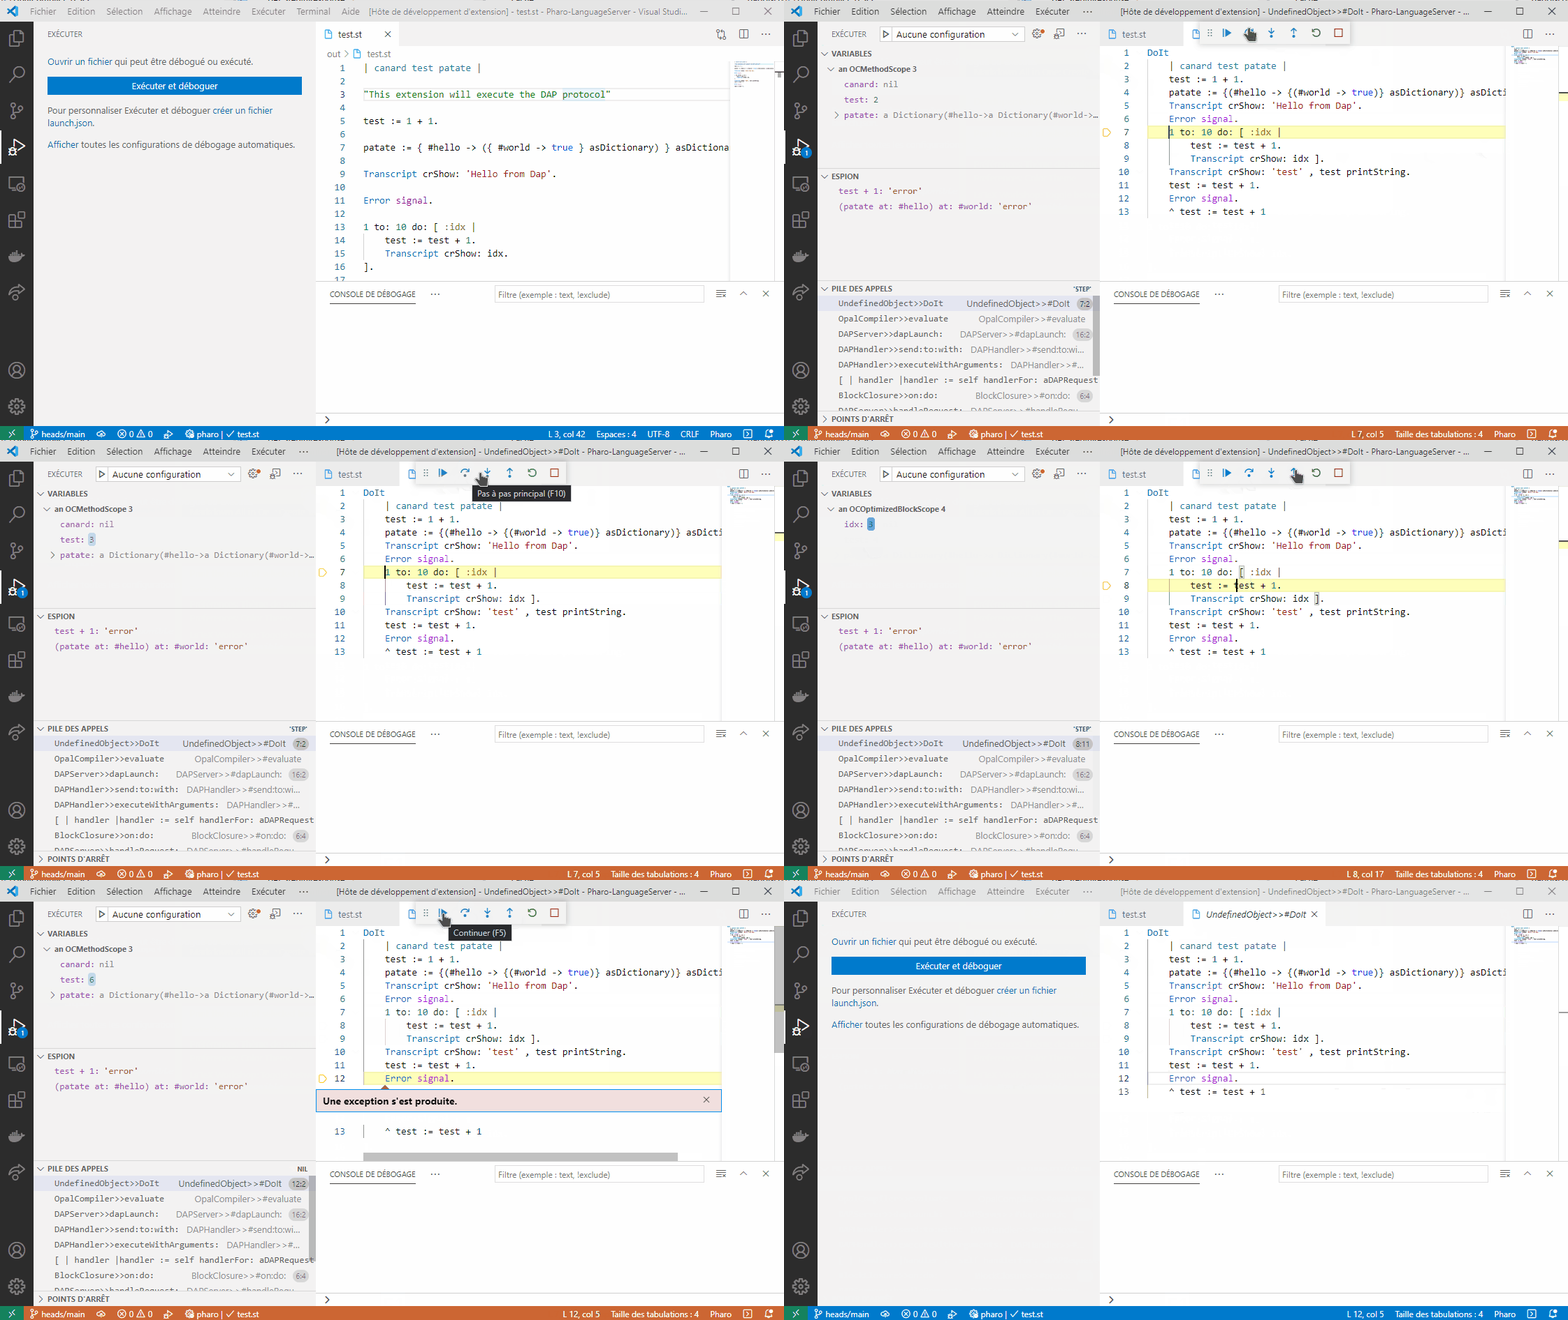
Look at the stopped frame
- The Variables view shows the Context of the frame (
thisContext, arguments and temporaries) apart from its Receiver (self and its slots).
- While stopped, the values of the variables show at the end of the lines of the method, up to the stop (
debug.inlineValues).
- Open in Inspector, in the context menu of a variable, opens its object in the Inspector.
- Each process stopped on an exception is a debug session of its own; Terminate Thread in the context menu of the Call Stack ends the process without resuming it.
Breakpoints are debug points of the image: set them in method editors, with a condition, a hit count or a log message (logpoints write on the Pharo Transcript), or as function breakpoints (Class>>selector). They stay installed when no debug session runs, and a process that hits one opens the debugger. The exception filters of the Breakpoints view choose which unhandled exceptions of the image stop: errors (of some classes), messages not understood, halts, deprecations. See docs/debug-points.md.
Agents
Copilot (agent mode), Claude Code, Codex and OpenCode work on the image of the window through the MCP server of evref-BL/MCP, that the language server starts in the image. Copilot sees its tools without configuration, with the Pharo skills of the extension (/pharo-live-image, /pharo-verify, /pharo-iceberg) and a Pharo agent; Pharo: Configure a CLI Agent… connects a CLI agent to it. Set pharo.mcp.enabled to false to not start it. See docs/agents.md.
The tools of the image show in VS Code: anObject inspect, run anywhere (playground, test, agent), opens the Inspector view, and aClass browse or aMethod browse the editor of the class or method. The questions Pharo asks (confirm:, request:, chooseFrom:, the file choosers) open the dialogs, input boxes and Quick Picks of VS Code instead of a window nobody sees, and the jobs of the image show their progress. With pharo.debugMode, they stay in Pharo. The language server needs the pls-ui capability; see docs/ui.md.
- The Processes view, in the Pharo sidebar, lists the processes of the image with their priority, their state and the method they run; expand a process to see its stack and open its methods. Terminate Process stops a stuck process, after a confirmation that warns for the processes of the system and of the user interface, and Debug Process suspends it in the debugger.
- Profile It (context menu of the editors and of the playground) evaluates the selection, or the line of the cursor, while the profiler of the image samples it, and shows the calls as a flame graph with the methods that cost the most. Click a call or a method to open it.
- The Chest view, next to the inspector, shows the objects kept by name in the chests of Chest. Store in Chest in the inspector keeps the inspected object; an object of the chest can be inspected, removed, or its access code (
(Chest named: 'Default') at: 'cart') inserted in an editor. Chest must be loaded in the image: the view gives the script that loads it.
The language server needs the pls-system capability; see docs/system.md.
Playground
Pharo: New Playground opens a page pharo-playground: evaluated in the active image.
- Do it (
Ctrl+D), Print it (Ctrl+P) and Inspect it (Ctrl+I; Cmd on macOS) evaluate the selection, or else the line of the cursor. The same actions are offered as Code Lens above each paragraph of the page. Print it writes the result after the code, selected, so that typing replaces it; Inspect it binds the result to the variable it and shows it in the Variables view.
- The variables of a page survive between its evaluations and show in the Variables view, whose title button resets them.
- What the image shows on the
Transcript appears live in the Pharo Transcript output channel (Pharo: Show Transcript).
- An evaluation that fails offers to Debug the code in the debugger of the image (DAP), without the variables of the page.
- The pages are kept for each image: Pharo: Open Playground Page… reopens or deletes them, the most recent first.
The playground needs a language server that announces the pls-playground capability.
Moose Book (Notebook for Moose/Pharo)
MooseBook is a way to use a notebook with Pharo. The playground is for trying things in the image; a Moosebook is a file of the workspace, for analyses that are recorded and shared with their results.
Additional feature
The additional feature can be access using the command palette of VSCode
- Save the Pharo image
- Execute and show the result
The Pharo: Show Pharo Language Server Diagnostics command inspects VM/image configuration, process and connection status, and server version.
- Select the active Pharo image with Pharo: Select Active Pharo Image. The extension validates the selected image and VM, asks before switching, saves the running image, updates the current workspace setting, and reloads VS Code. The status bar shows which image is connected; other VS Code windows are unaffected.
Each image keeps its own session: the class and method editors open, the Editor Stack view, the filter and selection of the Projects view, and the class, side, filter and selected method of the Class panel. After a reload of VS Code or a change of the active image, the editors of the image are reopened with the source of the image, and the classes and methods removed from the image since are skipped. The Projects view and the Class panel still follow the active editor when it shows a class.
The Editor Stack view lists the classes and methods visited, open or closed, sorted by visit, name or package; unlike Open Editors, it keeps closed entities to reopen them in one click. Pharo: Previous Class or Method and Pharo: Next Class or Method (also in the title bar of the editors) go back and forward in the history of the visited entities.
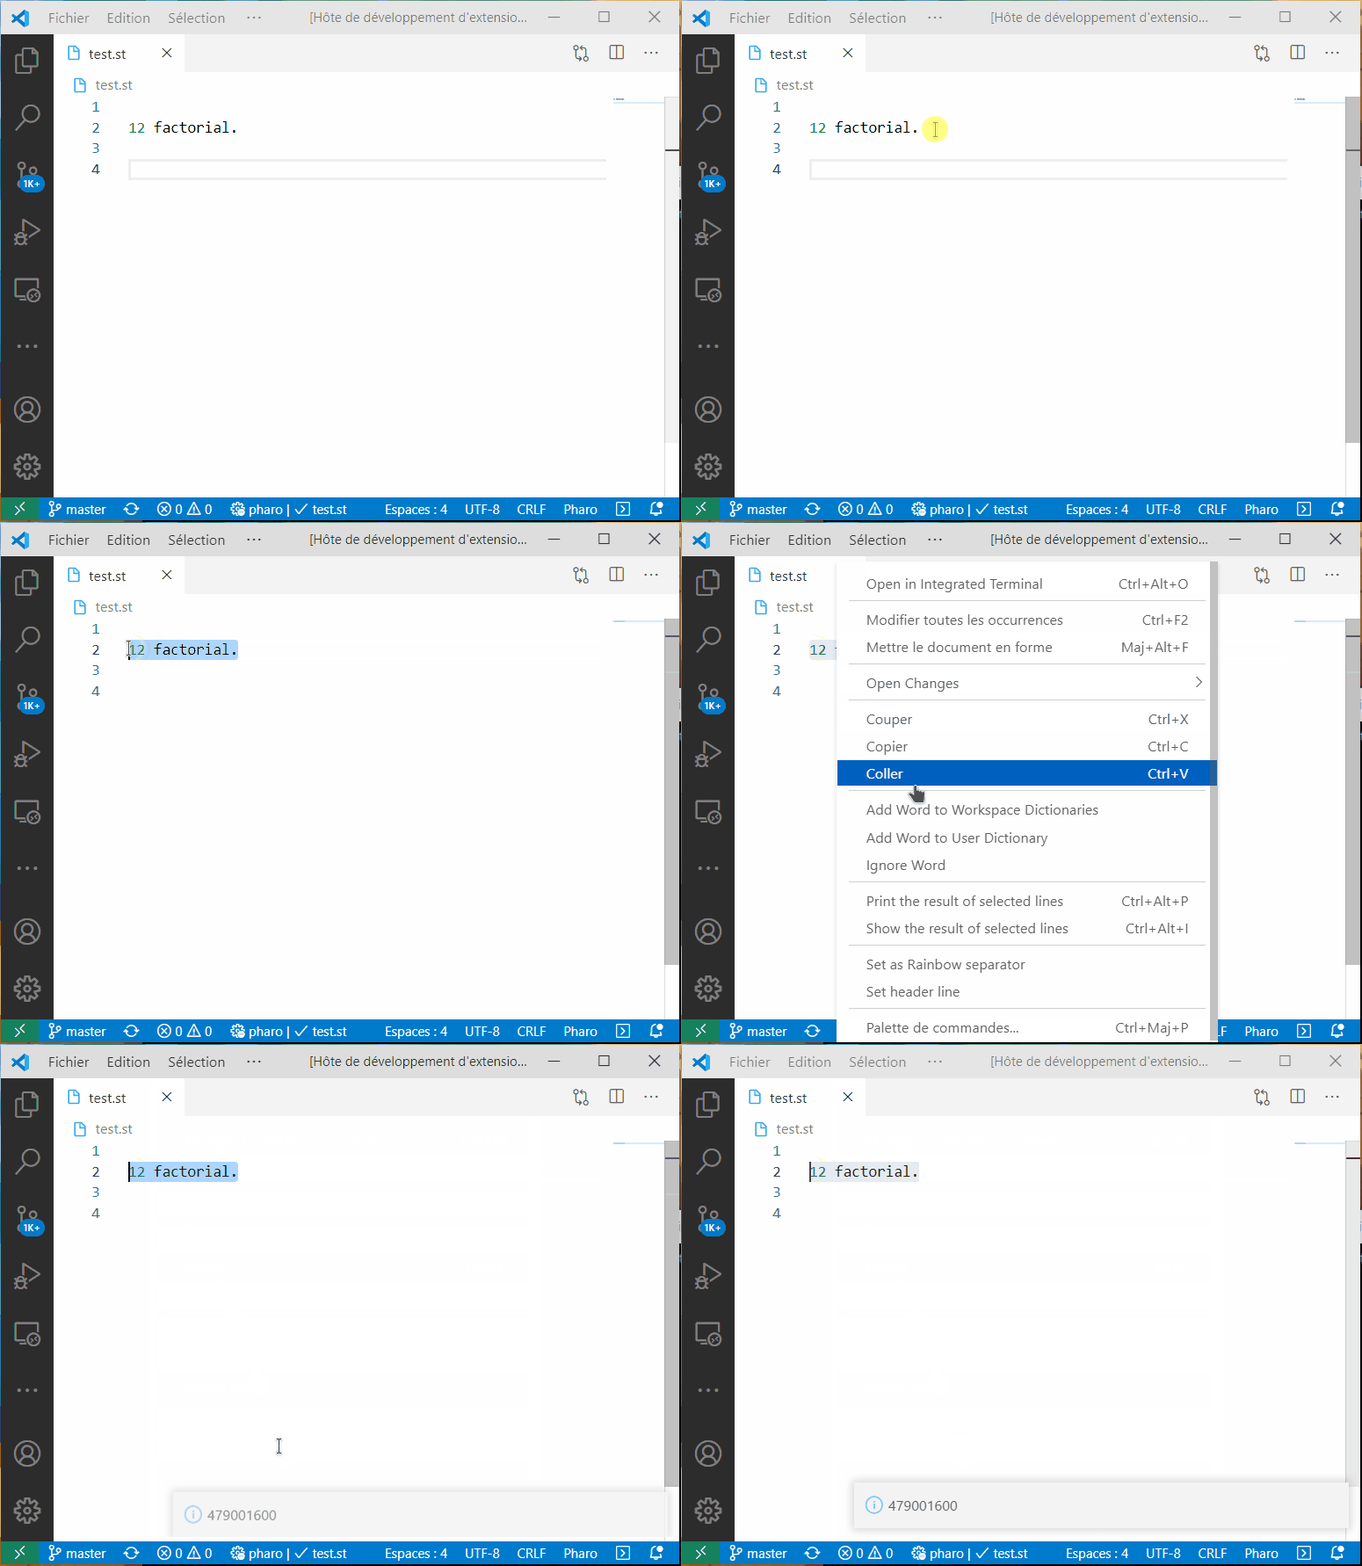
- Execute and print the result
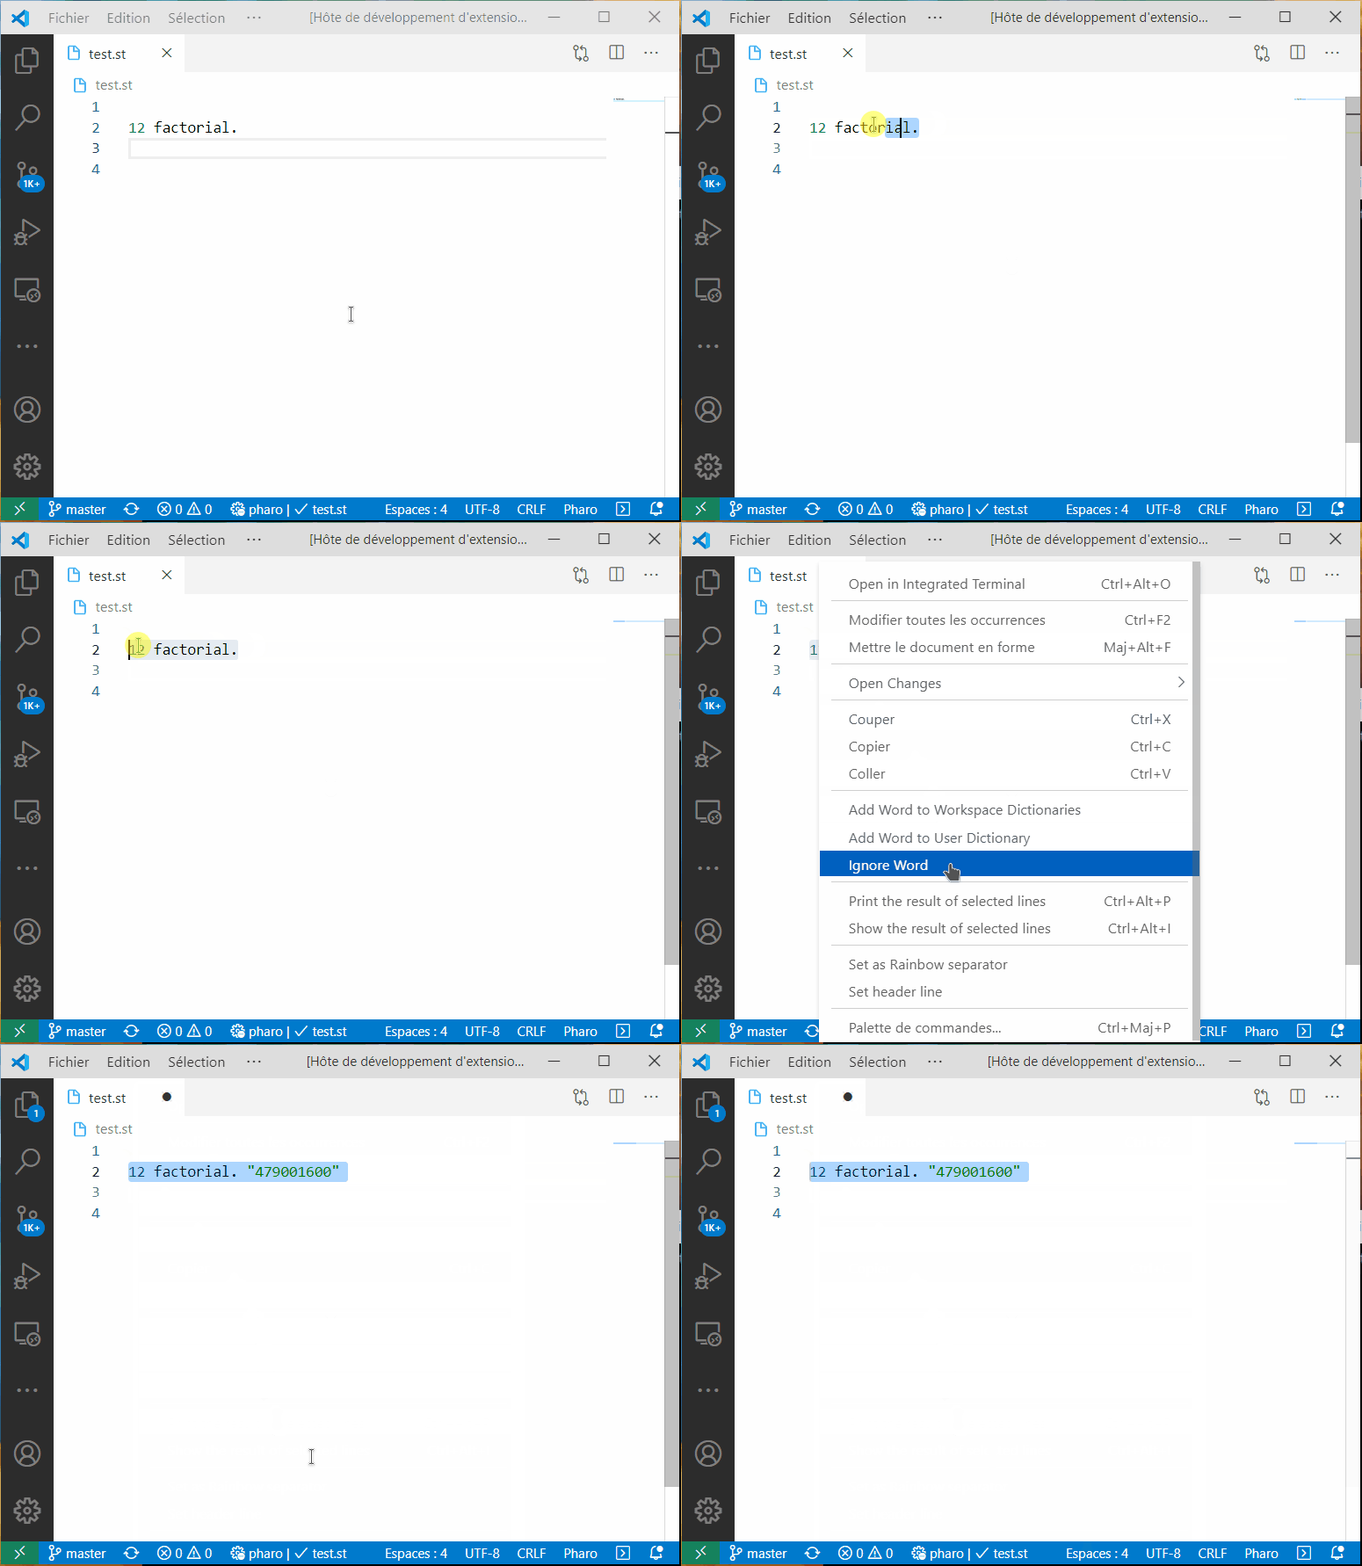
- Keep variable state
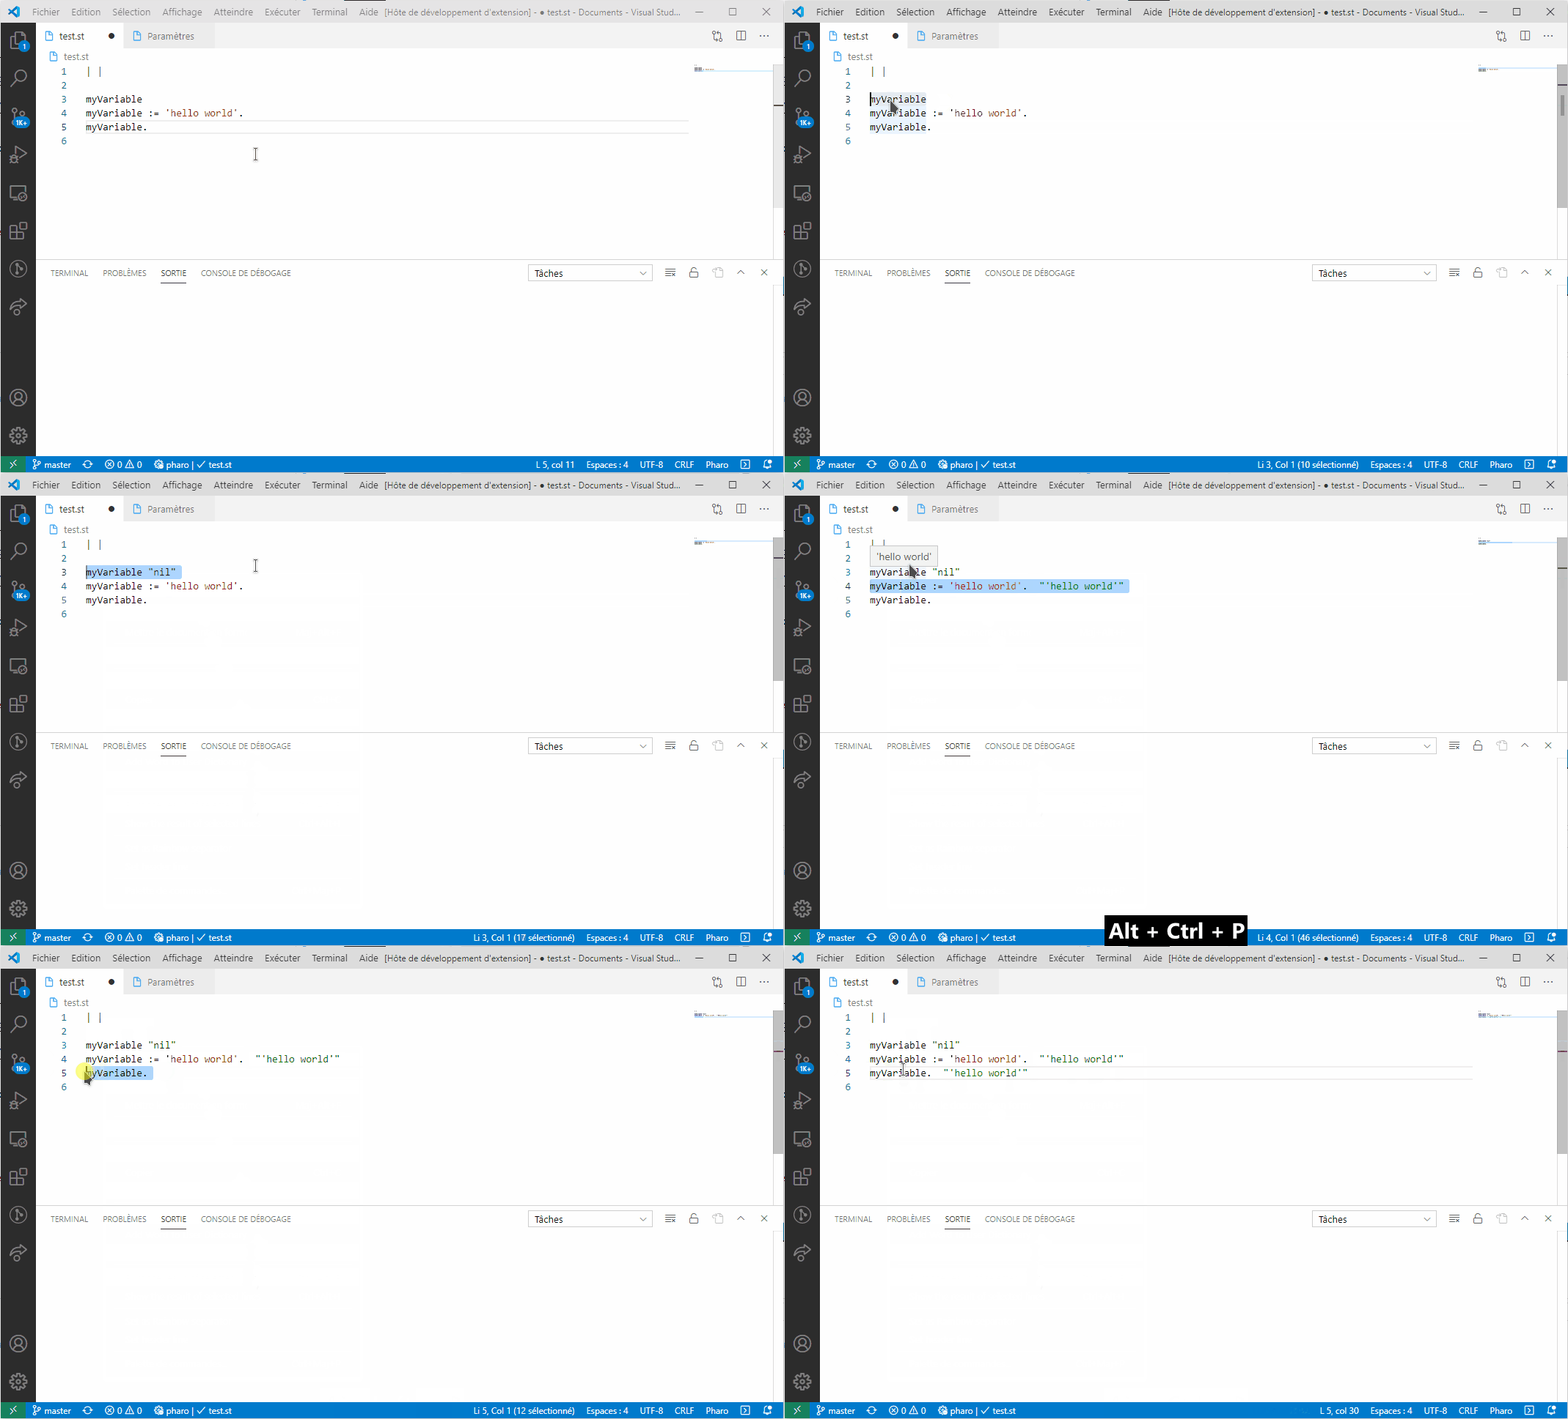
- Show the current server version
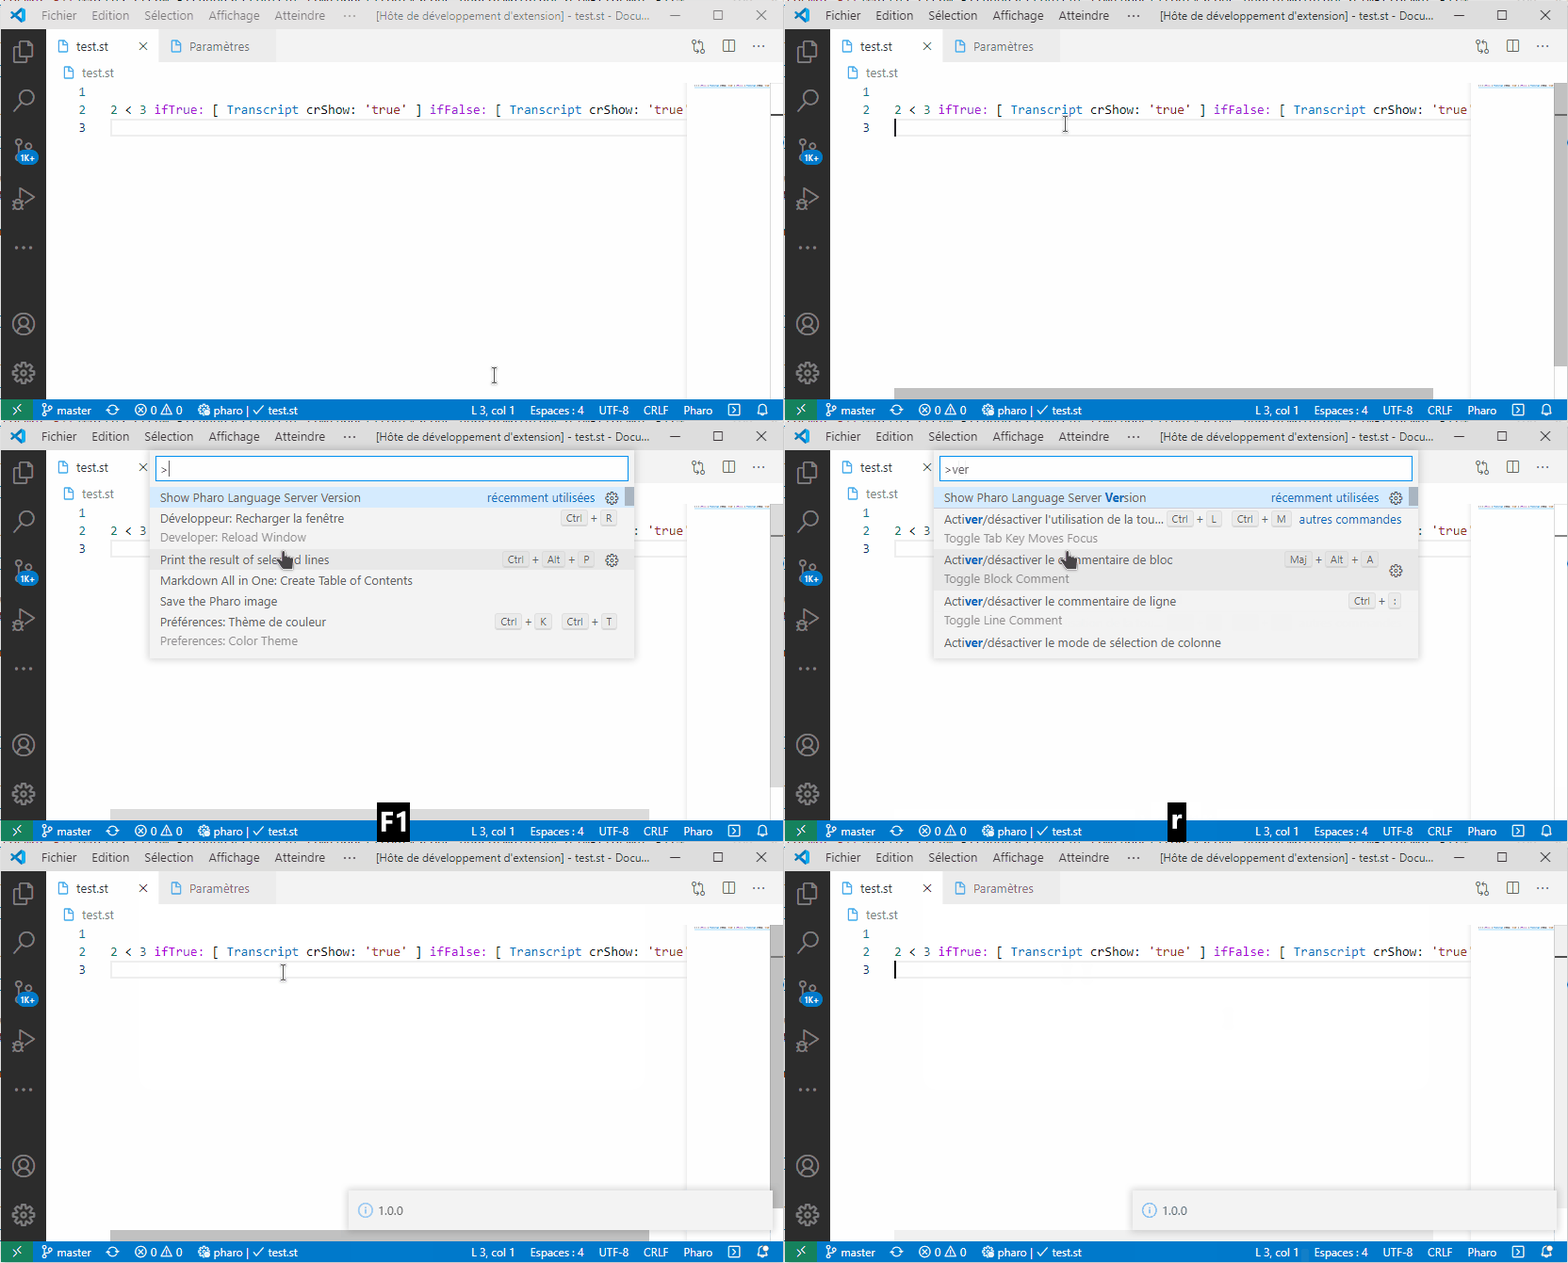
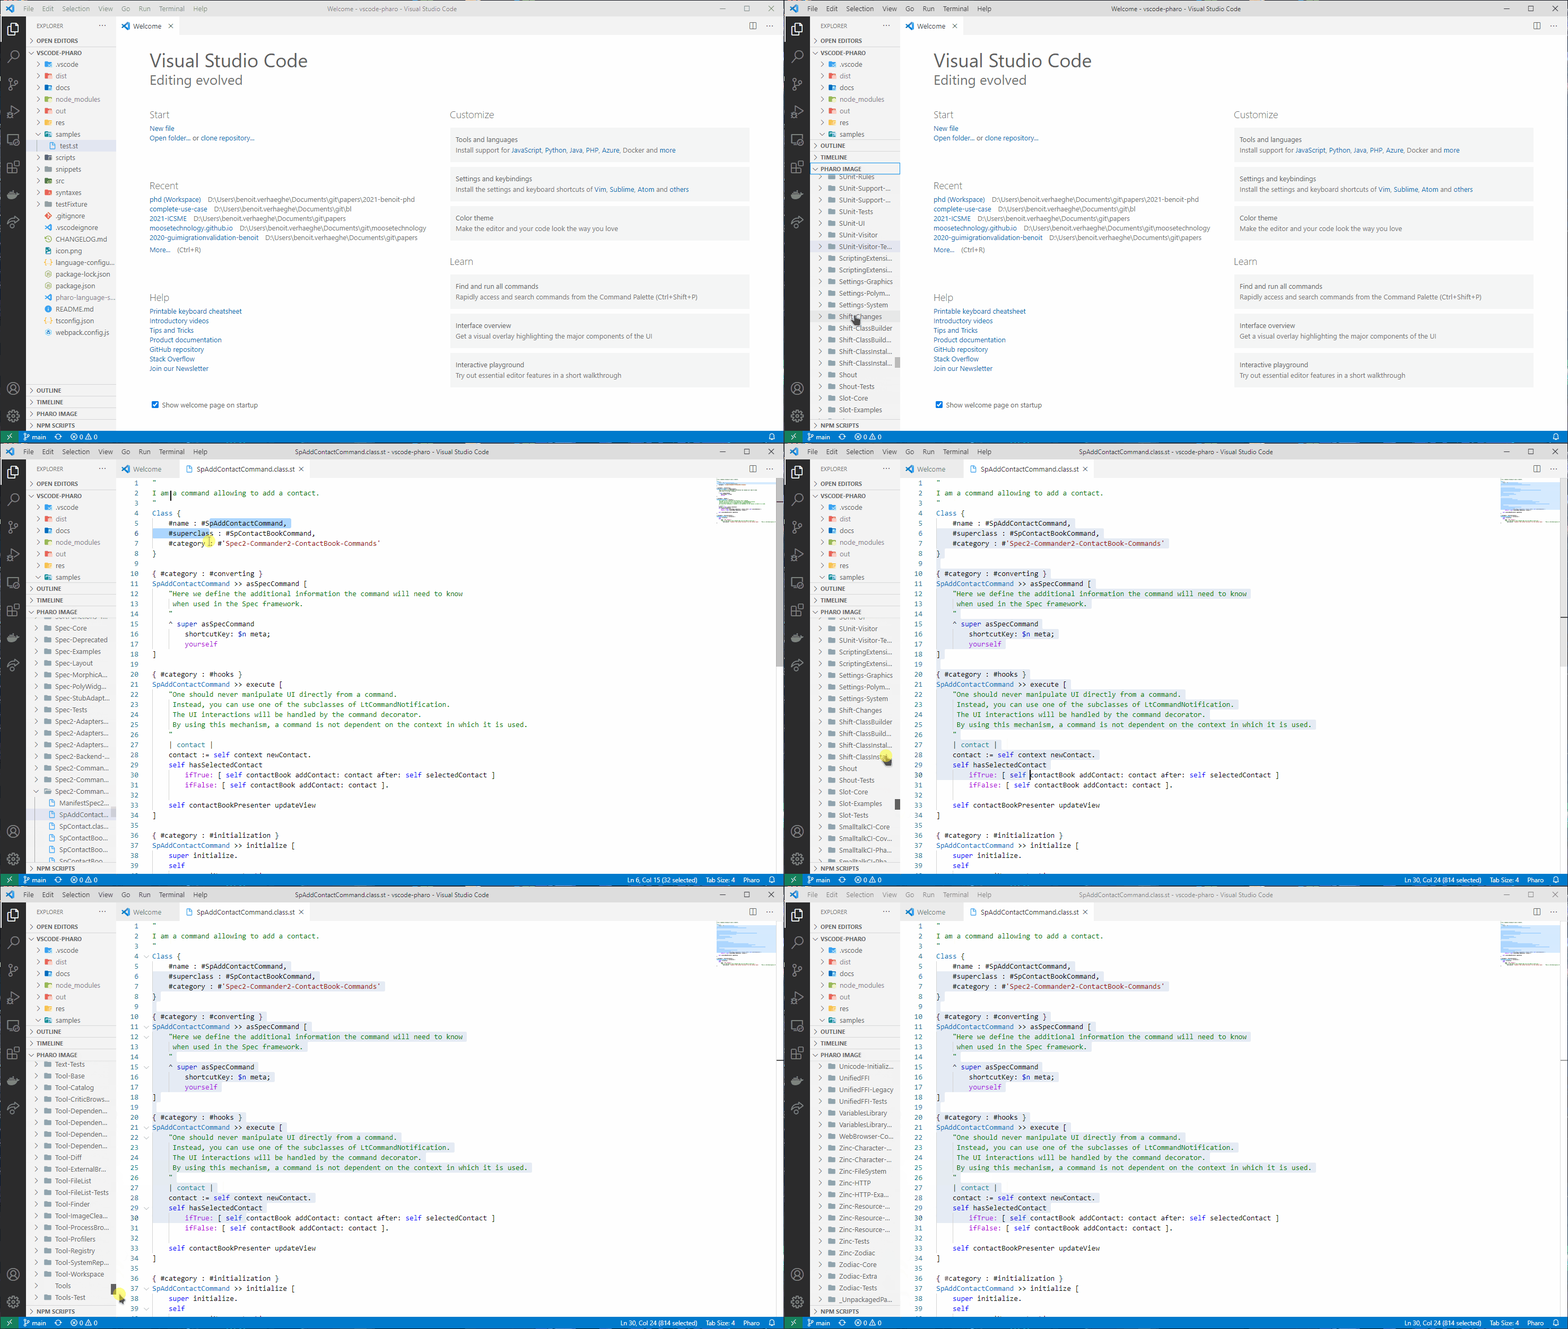
Saving a tonel file in VSCode, save the corresponding methods/class in the Pharo image
Access Pharo Image
Installation
The easiest way is to execute the pharo.installIt command using VSCode command panel.
Specific version of the language server
You can also follow the walkthroughs to download a pre-configured version of the Language Server.
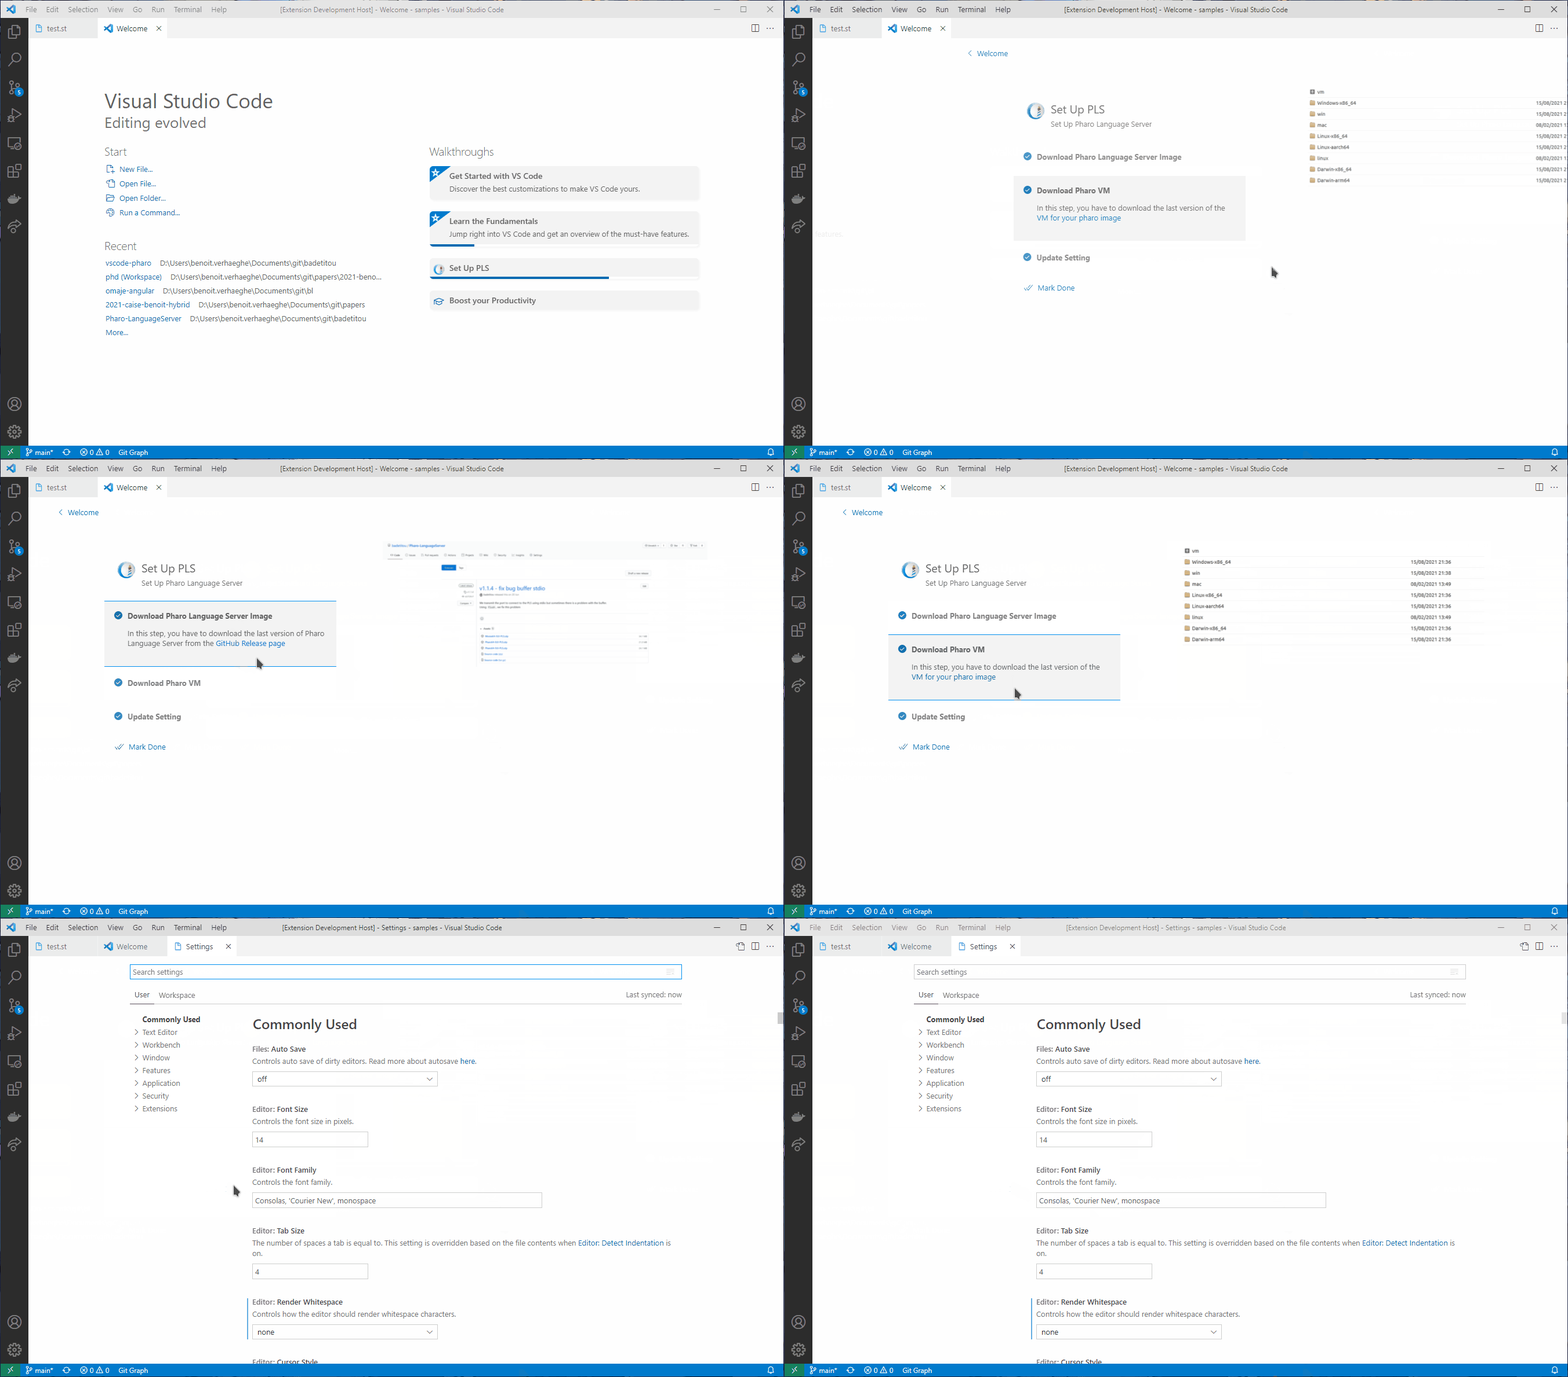
Or, to install the extension in an existing image :
- Install VSCode
- Install the Pharo extension
- Download a Pharo Language Server image or install the server in a pre-existing image
- Download a VM (headless or not) for the image
- Set up the Pharo extension property
- pharo.pathToVM: is the path to the VM executable, or a command available on
PATH (for example, pharo)
- Windows:
C:\path\to\pharo.exe
- Linux:
/path/to/pharo
- MacOS:
/path/to/Pharo.app/Contents/MacOS/Pharo
- pharo.pathToImage: is the absolute path to the image
- pharo.imageWorkspace: expose
pharoImage:/ as a workspace folder (useful for tools that read workspace files, such as AI assistants with virtual workspace support)
The Pharo Test Explorer discovers packages, test classes, and test methods on demand. Run a package, class, or individual method from VS Code's native test controls; failures and execution errors are reported separately with durations and source locations when the Tonel method can be resolved. Use Pharo Tests: Rerun Failed Pharo Tests to repeat the latest failed/error methods, or Pharo Tests: Refresh Pharo Tests after changing the image. Targeted debugging is not exposed yet by the current Pharo test RPC contract.
Iceberg change states
The Iceberg Source Control view separates Image vs Repository resources reported by Pharo, the Iceberg Index, and Unsaved VS Code Buffers. The first two come from the server's Iceberg status contract; dirty editor buffers are tracked locally and are not represented as changes already installed in the running image. Diff actions compare the server-provided current and original resources. The extension does not infer a separate on-disk working tree or image state when the server does not report it.
Manually try the Test Explorer and Iceberg changes
These features need a running Pharo image and Language Server configured with pharo.pathToVM and pharo.pathToImage. Iceberg change groups also require a valid Iceberg repository in the image.
- Run tests: open VS Code's Testing view and expand a package and test class to discover their children. Run one test method with the inline Run button, then run its class or package from the corresponding Run button. The result should appear in the Test Explorer. If a test fails or errors, its message and duration are shown; use Pharo Tests: Rerun Failed Pharo Tests to repeat those tests. Use Pharo Tests: Refresh Pharo Tests after changing tests in the image.
- Inspect Iceberg changes: open Source Control and inspect the repository's Image vs Repository and Iceberg Index groups. These groups show only states reported by Pharo. To check Unsaved VS Code Buffers, edit a repository-scoped
pharoImage: class document and leave it unsaved; its URI must include the iceRepository query parameter for it to be associated with that repository. Saving sends the edit to the running image, so it leaves the unsaved-buffer group; Pharo may then report an image/repository or Iceberg-index change.
Source Control groups are hidden while empty. Image vs Repository and Iceberg Index only show changes reported by Pharo; they are not populated by making an unsaved editor change.
From version v1.0.0, please use at least version v1.1.0 of the Pharo Language Server.
Pharo editor profile
Pharo: Set Up Pharo Editor Profile (also the last step of the Set Up PLS walkthrough) prepares a dedicated Pharo VS Code profile that only shows the views of the extension: the Pharo view in the primary sidebar, the class panel in the secondary sidebar, and the inspector and the Output view (Pharo Transcript) in the bottom panel. Explorer, Search, Source Control, Run and Debug and Extensions are hidden, not removed. The profile keeps your pharo.* settings and only contains the Pharo extensions; your current profile is not modified.
VS Code does not let extensions create profiles, so the command writes a .code-profile file, copies its path to the clipboard and opens the Profiles editor: open the menu next to New Profile, choose Import Profile... and paste the path. Then switch to the profile, or use it for the current folder. Running the command again from the Pharo profile puts the Pharo views back in place, and can recreate the profile to hide the other views again.
Using VMs from the Pharo Launcher
Assuming you have the official Pharo Launcher installed, you can also configure the extension to use the launcher's VMs along with the language server image like so:
https://user-images.githubusercontent.com/3588798/230201074-90226504-fc32-4aac-8bab-89d23ea8f660.mp4
(The example above is using VSCode with macOS 13)
Thanks
This extension is inspired from the one of Leonardo Nascimento for smalltalk.
Thanks a lot Leonardo!