
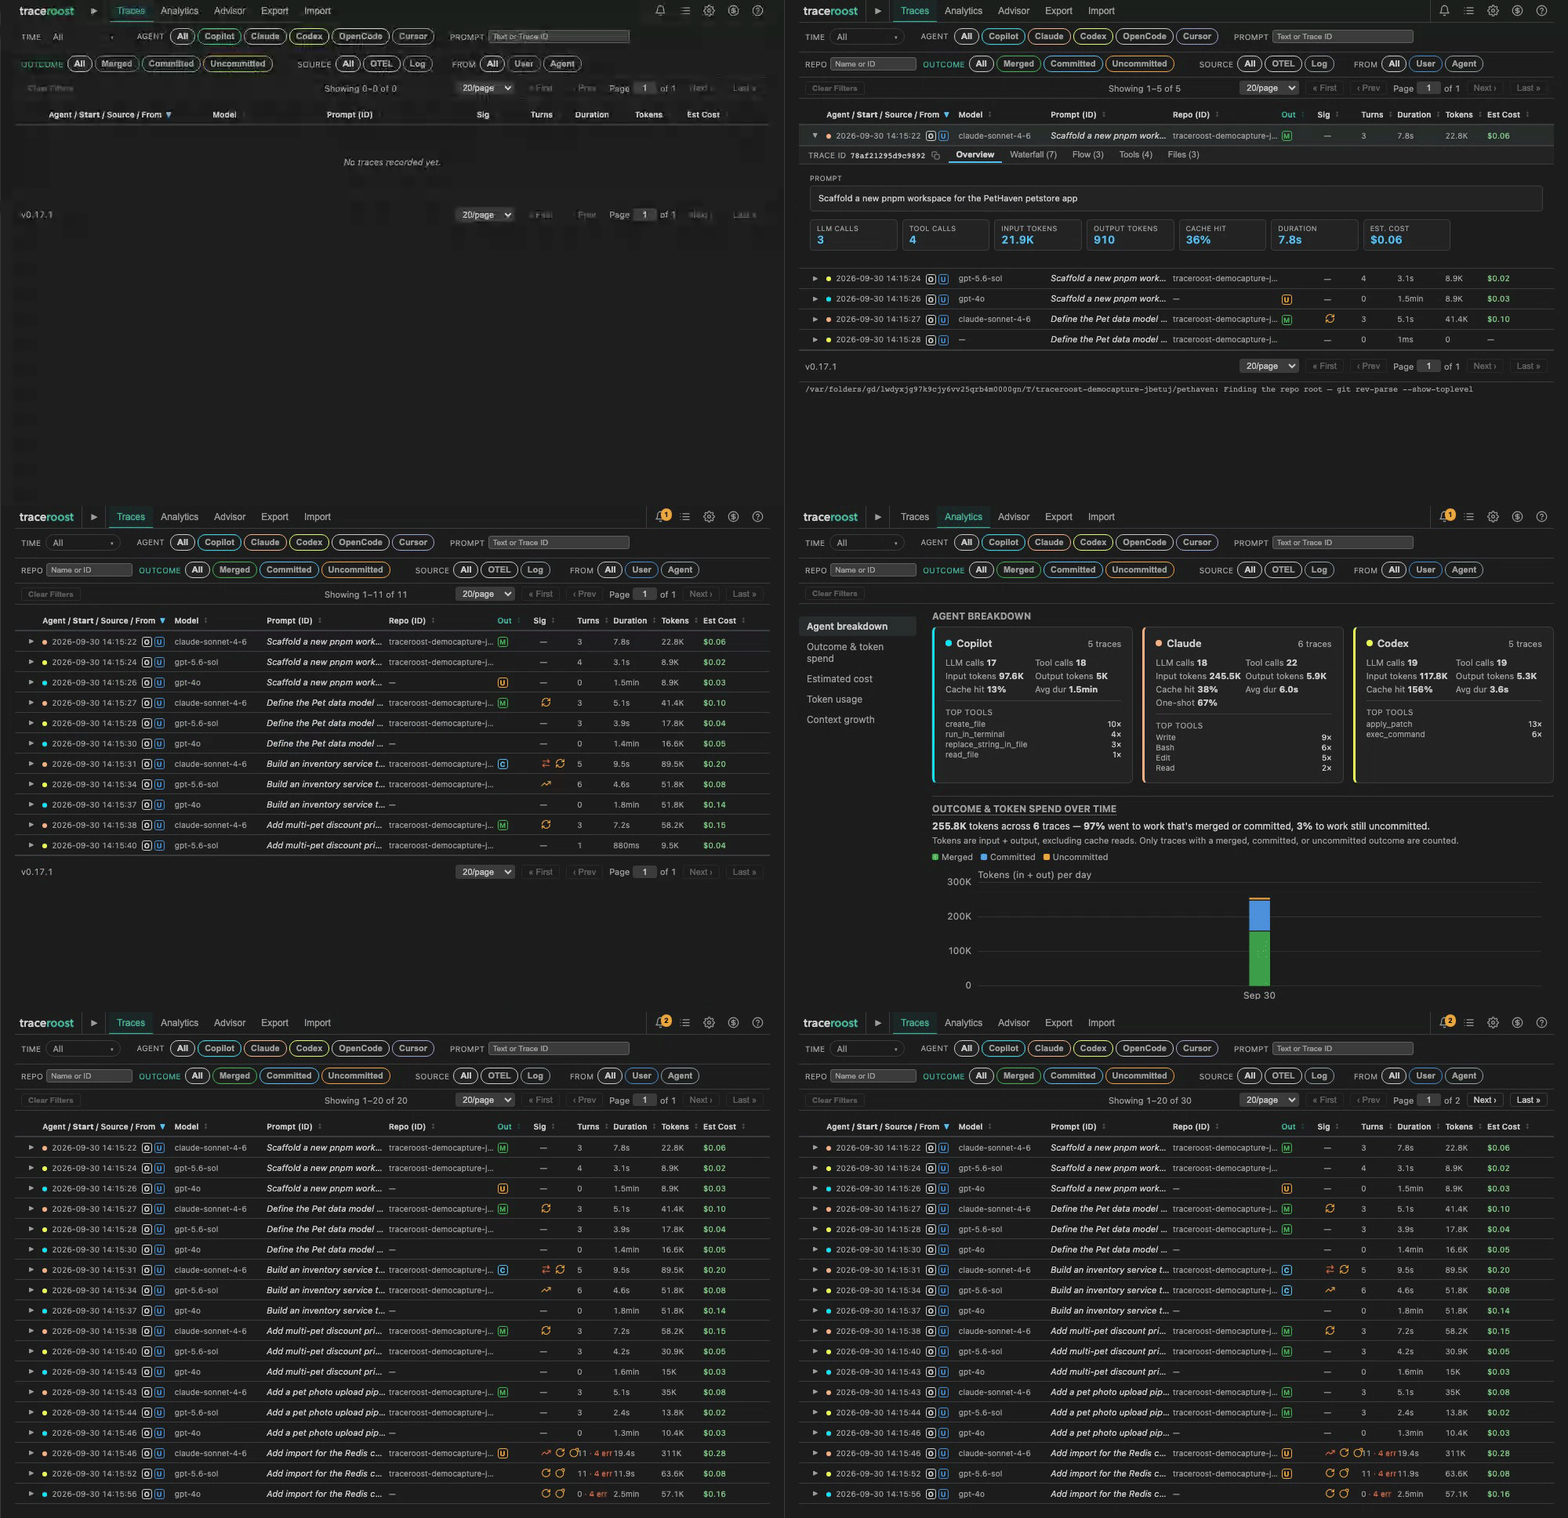
TraceRoost - Agentic AI Monitoring & ObservabilityAgentic AI monitoring and observability — OTEL traces and local log file ingestion for Copilot, Claude Code, Codex, OpenCode, and Cursor CLI. VS Code extension, npx, and Docker. Installation Launch VS Code Quick Open ( Ctrl+P), paste the following command, and press enter.Copied to clipboard |


| Agent | Log file location (Mac/Linux) | Windows |
|---|---|---|
| Claude Code | ~/.claude/projects/<project>/<session>.jsonl |
%USERPROFILE%\.claude\projects\... (also %APPDATA%\Claude\projects\...) |
| Codex CLI | ~/.codex/sessions/YYYY/MM/DD/rollout-*.jsonl |
%USERPROFILE%\.codex\sessions\... |
| Copilot CLI | ~/.copilot/session-state/<session>/events.jsonl |
%USERPROFILE%\.copilot\session-state\... |
| Copilot Chat | ~/Library/Application Support/<IDE>/User/workspaceStorage/…/chatSessions/ |
%APPDATA%\<IDE>\User\workspaceStorage\…\chatSessions\ |
| OpenCode | ~/.local/share/opencode/opencode.db (SQLite) |
%APPDATA%\opencode\opencode.db |
Cursor CLI (cursor-agent) |
~/.cursor/projects/<workspace>/agent-transcripts/<session>/<session>.jsonl |
%APPDATA%\Cursor\projects\... (unconfirmed) |
Copilot Chat traces are scanned across all installed VS Code-family IDEs automatically — VS Code, VS Code Insiders, Cursor, Windsurf, VSCodium, Trae, and Kiro. (That's Cursor the IDE's built-in Copilot Chat scanning — unrelated to the standalone Cursor CLI agent above, which TraceRoost ingests directly.)
Loading is incremental and runs in the background, sorted newest-first so recent traces appear immediately. A 30-second poll picks up new traces as they complete.
Non-default locations: CLAUDE_CONFIG_DIR (Claude Code), CODEX_HOME (Codex) and OPENCODE_DATA_DIR (OpenCode) are honored, each as a comma-separated list of directories.
To disable log ingestion: set traceRoost.enableLogIngestion to false in VS Code settings (or use the toggle in the gear-icon Settings panel).
Clear All Data (Settings) only deletes TraceRoost' own stored copy — it never touches these source log files, and log-sourced traces will simply be re-read on the next scan. TraceRoost has no way to delete the log files themselves; do that directly at the paths above if you want them gone.
What each agent gives you, source by source
The general picture above is the same for every agent — OTEL is richer, logs are zero-config. The specifics (exact fields, what's missing without OTEL, which config unlocks what) differ enough per agent to be worth stating individually:
Claude Code
Log files (automatic, no setup) — ~/.claude/projects/<project>/<session-uuid>.jsonl
Each file is one trace. assistant entries carry per-turn token counts (input, output, cache read/write). user entries carry the prompt text. Tool calls are embedded in message content blocks.
Available from logs: prompt, model, workspace, timestamps, all token counts, tool names, files read/written. Several signals can fire from this log alone (repeated tool calls, edit/revert cycles, runaway steps, hallucinated imports, degraded runaway-cost detection). Not in logs: TTFT, per-tool latency, streaming speed, or the signals that need per-tool error/result detail (error recurrence, chronic tool failures, context flooding, failed check submission) — those need OTEL. See the in-app Help tab's Signals section for the per-signal breakdown.
OTEL (richer, requires env config) — trace spans via /v1/traces and supplemental log records via /v1/logs.
With the recommended configuration (all three OTEL_LOG_* vars): prompt text, token counts, model, tool names, tool arguments, file paths, and full file diff content are all available. The three OTEL_LOG_* vars are not enabled by default — without them, tool arguments are absent and prompt text is omitted.
Codex CLI
Log files (automatic, no setup) — ~/.codex/sessions/YYYY/MM/DD/rollout-*.jsonl
turn_context entries carry the model name. event_msg entries with type: token_count carry per-turn cumulative token usage. The user's prompt text is not present in this format.
Available from logs: model, timestamps, token counts (input, output, cache read). Not in logs: prompt text, tool names, TTFT, latency.
OTEL (richer, requires config) — primarily flat OTLP log records (/v1/logs); adding trace_exporter also emits timing spans. With log_user_prompt = true and both exporters: prompt text, token counts, model, TTFT, tool names and results, and span timing are all present.
GitHub Copilot
Two surfaces, two formats: the CLI writes its own logs; Copilot Chat (the VS Code-family extension) is OTEL-only, no log fallback of its own. The OTEL guidance below applies to both.
CLI log files (automatic, no setup) — ~/.copilot/session-state/<session-uuid>/events.jsonl
session.start carries the model and workspace. user.message carries the user prompt. assistant.message carries per-turn output token counts. session.shutdown carries total context size.
Available from logs: prompt, model, workspace, timestamps, output tokens, total context size, tool names. Not in logs: input tokens per turn (estimated from shutdown totals), TTFT, cache token breakdown.
OTEL (richer, requires VS Code settings) — trace spans via Copilot's built-in OTEL exporter. Prompt text, token counts (input, output, cache read), model, TTFT, tool names, arguments, and results are all present natively. Cache write counts are not exposed — Copilot manages cache creation server-side.
OpenCode
SQLite database (automatic, no OTEL setup needed) — ~/.local/share/opencode/opencode.db
OpenCode stores all trace data in a local SQLite database. TraceRoost reads this directly — no agent configuration or OTEL setup is required. The database uses WAL (Write-Ahead Log) mode; TraceRoost merges the WAL at read time so traces are visible immediately after each run.
Available from the database: trace ID, user prompt (last user message), model name, workspace directory, timestamps, all token counts (input, output, cache read/write), tool calls with names, inputs/outputs, and per-tool error status. Unlike every other log source, that per-tool error status means most signals can actually fire from OpenCode's database alone — it's the one log-only exception noted throughout the in-app Help tab's Signals section.
Not available: time-to-first-token, per-tool execution timing, or streaming speed (no span timing data, since OpenCode has no OTEL path at all). Two signals still don't fire here — edit/revert cycles and hallucinated imports need before/after edit content only Claude Code (its own log, or OTEL) and Copilot (OTEL) capture; OpenCode's parser never records it. Traces show a Log badge and a blue info banner in the Overview tab noting the timing limitations.
Override the default database location with the OPENCODE_DATA_DIR environment variable (comma-separated for multiple directories).
Cursor CLI
Log files (automatic, no setup) — ~/.cursor/projects/<sanitized-workspace>/agent-transcripts/<session-uuid>/<session-uuid>.jsonl
This is Cursor's standalone terminal agent (cursor-agent, installed via curl https://cursor.com/install -fsS | bash), not Cursor the IDE's built-in composer/chat agent — those are separate products with separate storage; see the note in the log-location table above.
Available from logs: prompt, tool calls (names, arguments, file paths touched), session-level success/failure. Session start/end times fall back to the transcript file's own filesystem timestamps, since the format has no per-turn timestamps.
Not available, confirmed by direct inspection rather than assumed: token/usage counts, model name, workspace path, and per-tool error detail — none of these exist anywhere in Cursor CLI's local storage today. These show as an honest unpriced/unknown gap (matching every other unrecognized-model session) rather than a guessed number. No OTEL path exists for this agent, so there is no richer alternative source to fall back to — Cursor CLI traces always carry a Log badge.
All platforms are actively expanding what they expose, and the GenAI semantic conventions are still being standardized. TraceRoost will be updated as richer data becomes available.
Cost Estimation
The Analytics tab (Estimated Cost section) shows the dollar cost of Copilot, Claude Code, Codex, and OpenCode traces. Cursor CLI traces aren't included: Cursor CLI stores no token counts or model name, so there is nothing to price.
Copilot, Claude Code, Codex, and OpenCode all use token-based pricing — charging per input/output/cache token at per-model rates. Claude Code is billed against the Anthropic API at standard per-token rates (input, cache write, cache read, output) depending on model (Opus, Sonnet, or Haiku). Codex is billed against the OpenAI API. OpenCode is priced by the model each trace used, including OpenCode Zen's models.
The Estimated Cost section includes a per-trace bar chart with a daily aggregate line (right axis), a multi-dimensional table grouped by date and agent showing input, output, cache create, cache read, total tokens, and cost, and a model breakdown table. Some models carry a "long context" surcharge above a per-model token-per-call threshold — see PRICING_SOURCES.md for which ones and the exact thresholds.
All figures are estimates — not your actual bill. Rates are sourced from each provider's public pricing docs; see PRICING_SOURCES.md for the authoritative URL for each billing model and notes for maintainers on keeping rates current.
Exporting and Importing Trace Data
Export
The Export tab writes trace summary files to your workspace root, in your choice of three formats:
- JSON (default) — one structured record per trace: prompt text, agent and model, timing, token and cache counts, tool-call counts, files read and changed, and loop signals. This is the only format the Import tab reads back in.
- CSV — one row per trace, with array/object fields (models, files, tool counts, loop signals) flattened into semicolon-joined cells. Built for dropping into a spreadsheet.
- Markdown — one section per trace with the same data laid out as a readable report, prompt included as a blockquote. Built for sharing.
Each format is available both as the full export and as a redacted export (prompt text and file paths replaced with [redacted]) — filenames follow export_sessions_<timestamp>.<ext> (or export_redacted_sessions_<timestamp>.<ext> for the redacted version), with <ext> matching the format chosen (json, csv, or md).
Exports draw from the full SQLite trace history, not just the active window, so all past traces are included regardless of when they ran.
Note:
pnpm run demo -- --file <export.json>can replay a JSON export from this tab, but only approximately — a trace summary carries no per-turn timeline, so each trace is rebuilt as synthetic spans. For a faithful replay, use the raw spans written by theTraceRoost: Export OTEL Datacommand (spans still in the live window only) or a captured fixture. See DEMO.md for the full replay/demo toolchain.
Import
The Import tab loads traces from a previous TraceRoost JSON export file into the current installation — useful for migrating data to a new machine, sharing trace history across team members, or restoring a local backup. CSV and Markdown exports are one-way (for external consumption) and can't be imported back.
- Open the Import tab in the dashboard
- Drag-and-drop an
export_sessions_*.jsonfile onto the drop zone, or click Choose file - Review the preview: total traces, breakdown by agent source, and the date range covered
- Click Import — progress updates live as traces are written; already-existing traces are skipped automatically
Import works in both VS Code extension mode and standalone server mode.
Recommendations & Signals
The Traces tab (Overview sub-tab) and Analytics tab surface two categories of signal per trace:
Efficiency insights — problems you can fix by adjusting your prompts:
- Context bloat (input tokens growing rapidly across turns)
- Files read multiple times, duplicate searches, large tool results
- Tool failures, high turn count, oversized starting context
- Low cache hit rate, tool definition overhead
Signals — behavioral patterns indicating the agent is stuck or spiraling. These appear first in the list with a ↺ icon:
| Signal | Description | Trigger |
|---|---|---|
| Tool Call Deadlock | Same tool + arguments called 30+ times (critical at 50+) | Agent not retaining tool results |
| State Corruption Spiral | A file edited then reverted to a prior state | Agent oscillating between conflicting constraints |
| Hallucination Amplification Loop | Same error recurring 3+ times | Fix attempts not resolving the root cause |
| Ambiguous Success / Escalating Scope | Too many steps for the task complexity | No clear completion condition |
| Infinite Loop — Context Accumulation | Input tokens growing while output ratio collapses 70%+ | Agent stuck, accumulating context without progress |
| Chronic Tool Unreliability | 20%+ of tool calls failed (5+ calls made) — many different one-off failures, not one repeating | Agent guessing at file locations, commands, or available tools |
| Context Flooding Risk | A tool result over 10,000 characters landed in context | Missing line ranges or scope on a read/search |
| Fabricated Dependency | An edit imports a package absent from the manifest and unresolvable on disk | Hallucinated package name |
| Unverified Submission | The session's last test/build check failed with no fix attempt after | Session ended before confirming the fix |
| Multi-Step Oscillation | A multi-step tool sequence (e.g. run tests → read log) repeated 5+ times with no edit | Agent retrying the same approach without new information |
| Redundant Context Reload | The same file read 3+ times with no write in between | Agent losing track of what it already read |
| Avoidable Cache Miss | A call re-wrote context it could plausibly have read from cache | Tool definitions, system prompt or settings changing between turns |
| Cache TTL Expiry | A cache miss followed a gap longer than the cache's TTL | Turns spaced further apart than the cache lives |
| Poor Cache Utilization | Little of the trace's context came from cache | Something invalidating the cached prefix every turn |
| Budget Overrun | Trace cost exceeded the cap set in TRACEROOST_BUDGET_CAP_USD (off unless set) |
A loop or retry pattern driving cost, or an under-sized cap |
| Model Tier Mismatch | A premium model ran a long, read-only, low-output stretch with no edits | Read/search work that a cheaper model could do |
| Unverified Ship | The trace's changes reached the trunk branch (git outcome Merged) with no test/build check run | Work merged without verification |
Each signal includes a specific recommended action and a Copy button that copies the recommendation prompt to your clipboard so you can paste it into your agent. Use the Ignore button to dismiss signals that represent intentional behavior. The in-app Help tab's Signals section has each signal's exact trigger thresholds and which data source (OTEL or logs) it needs.
Ways to Run
Local (OTEL and log files)
The fastest way to get started — run directly on your machine with no install required. Because it runs natively it has full access to your local log files.
# One-off — the @latest tag forces a fresh fetch (see note below)
npx traceroost@latest
bunx traceroost@latest

# Or install globally and run by command name
npm install -g traceroost@latest
traceroost
Open http://localhost:3000 after the server starts. The OTLP receiver listens on port 4318. Configure agents to point at http://localhost:4318 (see Manual Configuration).
Always include
@latest. A barenpx traceroost(orbunx) re-runs whatever version npx cached the first time you ran it — it does not check npm for a newer release, so you can silently stay on an old version for weeks.@latestforces npx to resolve against the registry. If a bare run already cached an old copy, clear it withrm -rf ~/.npm/_npx(npx) ornpm cache clean --force. A global install (npm install -g) has the same trap — re-run it with@latest, ornpm update -g traceroost, to move forward.
Log file ingestion reads local log files from
~/.claude/,~/.codex/,~/.copilot/, OpenCode's SQLite database at~/.local/share/opencode/, and Cursor CLI's transcripts at~/.cursor/projects/directly. See Local Mode Options for environment variables.Running this in a terminal only lasts until you close it. If TraceRoost isn't running when an agent sends OTEL data, that data is lost — see Background Service to keep it running automatically.
VS Code Extension (OTEL and log files)
The extension receives OTEL traces in real time and reads local log files, so you get both live telemetry and full trace history automatically.
Works in VS Code, Cursor, Windsurf, VSCodium, Trae, and Kiro — install from your IDE's extension marketplace or from the VS Code Marketplace directly.
- Install from the VS Code Marketplace
- Open the TraceRoost view from the Activity Bar — this opens a dashboard panel inside your IDE, not a browser tab, so there's no localhost URL to visit for this mode
- TraceRoost auto-configures OTEL telemetry for Copilot, Claude Code, and Codex — restart any running agents to start streaming traces
- Past trace history loads automatically from local log files — no extra setup needed
Docker (OTEL only)
Docker is the least capable way to run TraceRoost — prefer the background service or the VS Code extension. The container is isolated from your host, so:
- No log file ingestion — it receives OTEL traces only, with no log-file backfill of past history or of sessions sent while it wasn't running.
- No agent auto-configuration — auto-config writes to the container's filesystem, not your host's agent configs. Run the setup scripts or follow Manual Configuration.
- No git outcomes — it can't see your local git repos.
# Ephemeral — data cleared on container stop (always pulls latest)
docker run --pull=always -p 127.0.0.1:3000:3000 -p 127.0.0.1:4318:4318 traceroost/traceroost

# Persistent — data survives restarts (macOS/Linux)
docker run --pull=always -p 127.0.0.1:3000:3000 -p 127.0.0.1:4318:4318 \
  -v ~/.traceroost:/data \
  traceroost/traceroost

# Persistent — data survives restarts (Windows)
docker run --pull=always -p 127.0.0.1:3000:3000 -p 127.0.0.1:4318:4318 `
  -v "$env:USERPROFILE\.traceroost:/data" `
  traceroost/traceroost
The image binds to 0.0.0.0 inside the container, so — exactly like a native run with
BIND_HOST=0.0.0.0 — every request to the dashboard, the OTLP receiver and MCP needs the access
token TraceRoost generates on first start. Without it the dashboard shows an "Unauthorized" page
and agents' exports are rejected with 401. To get it:
# The startup log prints the dashboard URL with the token included — open that URL once and the
# browser keeps a cookie, so plain http://localhost:3000 works afterwards.
docker logs <container> 2>&1 | grep -m1 'token='

# Or read it from the config file (HOME is /data in the image, so it lives on the volume and
# survives container re-creation when you mount one):
docker exec <container> cat /data/.traceroost/config.json   # "authToken": "…"
Then pass it to the setup scripts below (--token / -Token, or TRACEROOST_TOKEN), or add it
by hand as OTEL_EXPORTER_OTLP_HEADERS=Authorization=Bearer <token> (Codex: a
headers = { "Authorization" = "Bearer <token>" } entry inside each otlp-http = { … } table).
Configuring Agents for Local / Docker
Use the included setup scripts to configure agents automatically, or see Manual Configuration for the manual steps. For a local native run on 127.0.0.1 (the default) no token is needed; for Docker or LAN mode, add the token:
# macOS / Linux
chmod +x scripts/configure-agents.sh
./scripts/configure-agents.sh                        # native, loopback-bound
./scripts/configure-agents.sh --token <token>        # Docker / BIND_HOST=0.0.0.0
./scripts/configure-agents.sh --host 192.168.1.20 --token <token>   # TraceRoost on another machine
# Windows (PowerShell)
Set-ExecutionPolicy -ExecutionPolicy RemoteSigned -Scope CurrentUser
.\scripts\configure-agents.ps1
.\scripts\configure-agents.ps1 -Token <token>       # Docker / BIND_HOST=0.0.0.0
Upgrading from AgentLens
TraceRoost was renamed from AgentLens — several unrelated projects already used that name. The npm package is traceroost and the Docker image is traceroost/traceroost. The VS Code extension kept its marketplace id (agentlens.agentlens-dashboard) — only the display name changed — so an installed AgentLens extension updates in place, nothing to reinstall. The old agentlens-dashboard npm package and agentlens/agentlens image get security fixes only, from the agentlens branch.
Still on npx, Docker, or the background service under the old name? Moving over is a clean break — settings, the local data directory (~/.traceroost, previously ~/.agentlens), and the background service all move to the new name:
- Remove the old service:
agentlens service uninstall - Install the new one:
npx traceroost@latest service install - Let auto-config rewrite your agents' OTEL settings on the next start (or use Configure OTEL in Settings)
Trace history stored under the old ~/.agentlens directory is not migrated automatically — point DATA_DIR (or service install --data-dir) at it if you need it.
Manual Configuration
The VS Code extension and the standalone (npx) server both auto-configure Copilot, Claude Code, and Codex on every startup, so you shouldn't need any of this by default. It's here for when you do:
- It's idempotent and quiet — only rewrites a config file when something's actually missing or different, and only notifies (once, in a VS Code notification and the Output panel) when it changes something. Disable it entirely with the
traceRoost.autoConfigureAgentssetting. - Changed an agent's OTEL settings by hand? Use the Configure OTEL button in the Settings panel (gear icon) to reapply TraceRoost's values immediately, instead of waiting for the next restart.
- Docker doesn't auto-configure your host agents — the same code runs, but it writes to the container's filesystem. Use the setup scripts below, or the manual steps per agent.
- Replace
4318below with your custom port if you changedtraceRoost.otlpPort.
GitHub Copilot
VS Code-family IDE extension — Add to User Settings (Cmd+Shift+P / Ctrl+Shift+P → Preferences: Open User Settings (JSON)) in VS Code, Cursor, Windsurf, or any VS Code-family IDE:
{
  "github.copilot.chat.otel.enabled": true,
  "github.copilot.chat.otel.exporterType": "otlp-http",
  "github.copilot.chat.otel.otlpEndpoint": "http://localhost:4318"
}
Copilot CLI (standalone) — Add to your shell profile, then open a new terminal:
# macOS / Linux — add to ~/.zshrc or ~/.bashrc
export OTEL_EXPORTER_OTLP_ENDPOINT="http://localhost:4318"
export OTEL_INSTRUMENTATION_GENAI_CAPTURE_MESSAGE_CONTENT=true
# Windows — run once in PowerShell (persists across sessions)
[System.Environment]::SetEnvironmentVariable("OTEL_EXPORTER_OTLP_ENDPOINT", "http://localhost:4318", "User")
[System.Environment]::SetEnvironmentVariable("OTEL_INSTRUMENTATION_GENAI_CAPTURE_MESSAGE_CONTENT", "true", "User")
Claude Code
The CLI and VS Code extension both read the same file. Add to the "env" block:
- macOS/Linux:
~/.claude/settings.json - Windows:
%USERPROFILE%\.claude\settings.json
{
  "env": {
    "CLAUDE_CODE_ENABLE_TELEMETRY": "1",
    "CLAUDE_CODE_ENHANCED_TELEMETRY_BETA": "1",
    "OTEL_TRACES_EXPORTER": "otlp",
    "OTEL_EXPORTER_OTLP_PROTOCOL": "http/json",
    "OTEL_EXPORTER_OTLP_ENDPOINT": "http://localhost:4318",
    "OTEL_LOG_TOOL_DETAILS": "1",
    "OTEL_LOG_TOOL_CONTENT": "1",
    "OTEL_LOG_USER_PROMPTS": "1"
  }
}
CLAUDE_CODE_ENHANCED_TELEMETRY_BETA=1 enables span-level tracing — without it turns and LLM calls are indistinguishable and cache token breakdowns are unavailable. The three OTEL_LOG_* vars unlock tool details, file diff content (needed for the Files tab), and your typed prompt. If settings.json already exists, merge the env block — do not replace the whole file.
Codex
The CLI and VS Code extension both read the same file. Add an [otel] section:
- macOS/Linux:
~/.codex/config.toml - Windows:
%USERPROFILE%\.codex\config.toml
[otel]
log_user_prompt = true
exporter = { otlp-http = { endpoint = "http://localhost:4318", protocol = "json" } }
trace_exporter = { otlp-http = { endpoint = "http://localhost:4318", protocol = "json" } }
log_user_prompt = true includes your typed prompt; without it traces show [trace in progress]. exporter sends log events; trace_exporter sends trace spans. Both point at the same endpoint. If config.toml already has an [otel] section, add only the missing keys.
Local Mode Options
TraceRoost runs as a local web server outside VS Code — useful for CI, remote machines, or when you prefer a browser tab over the VS Code sidebar.
Native process (recommended for local use)
Runs directly on your machine — no Docker required. Gives the server full access to the local filesystem, which is required for log file ingestion. Quick-start commands are in Ways to Run above.
Environment variables:
| Variable | Default | Description |
|---|---|---|
OTLP_PORT |
4318 |
OTLP HTTP receiver port |
UI_PORT |
3000 |
Dashboard port |
MCP_PORT |
4316 |
MCP endpoint for Claude Code and other MCP-compatible agents |
DATA_DIR |
~/.traceroost |
Directory for persistent span data |
BIND_HOST |
127.0.0.1 |
Set to 0.0.0.0 for LAN access — the access token then becomes mandatory on the dashboard, OTLP and MCP ports (see below) |
TRACEROOST_MAX_SPANS |
50000 |
Cap on in-memory/persisted spans; oldest spans are dropped once exceeded |
TRACEROOST_NO_AUTOCONFIG |
unset | Set to 1 to leave every agent's configuration untouched (no auto-configure on startup, and the Configure OTEL button reports that it's disabled) |
TRACEROOST_BUDGET_CAP_USD |
unset | Per-trace dollar cap for the Budget Overrun signal; the signal is off until this is set (also read by the VS Code extension from its environment) |
LAN mode / security. On the default 127.0.0.1 bind only processes on your machine can connect,
so no token is required; the servers still refuse requests from web pages (a foreign Origin
header, a DNS-rebinding Host, or an OTLP body sent as text/plain/form data). With
BIND_HOST=0.0.0.0 (or ::) any Host name is accepted — LAN IP, hostname, Docker service name —
and every request instead needs the bearer token from ~/.traceroost/config.json (authToken),
printed with the dashboard URL at startup. Browsers: open http://<host>:3000/?token=<token> once
(a cookie keeps you signed in). Agents: OTEL_EXPORTER_OTLP_HEADERS=Authorization=Bearer <token>,
or scripts/configure-agents.sh --host <host> --token <token>. MCP clients: send the same
Authorization: Bearer <token> header.
The local server uses the same port as the VS Code extension — only one can run at a time. To run both simultaneously, use different ports:
OTLP_PORT=4319 UI_PORT=3001 bunx traceroost@latest
Background Service (macOS / Windows / Linux)
If TraceRoost isn't running, incoming OTEL data has nowhere to go and is lost — agents don't queue or retry failed exports. A terminal you forgot to reopen, a closed laptop lid, or a reboot all mean a gap in your trace history. Running TraceRoost as a background service avoids this: it starts automatically and keeps running without a terminal open.
# One command — works whether or not traceroost is already installed globally
npx traceroost@latest service install

traceroost service status      # check whether it's running and reachable
traceroost service logs        # print the service's log file
traceroost service logs --follow
traceroost service stop        # stop it
traceroost service start       # start it again
traceroost service restart     # stop + start
traceroost service update      # upgrade to the latest version and restart on it
traceroost service uninstall   # remove it (your data in ~/.traceroost is untouched)
service install fetches the latest traceroost from npm before it writes the service
definition, so re-running it is also how you upgrade. If that download can't happen (offline, npm
registry unreachable), it prints a clear notice that the new version couldn't be downloaded and
installs the service on whichever version is already present rather than failing.
Once installed, the running service does not otherwise auto-update. It keeps running whatever version is installed until you run
traceroost service update(or re-runservice install) — either one pulls the latesttraceroostfrom npm and restarts the service on it.
service install uses whichever OS-native mechanism fits your platform, all installed per-user
with no admin/root privileges required:
| Platform | Mechanism |
|---|---|
| macOS | launchd LaunchAgent — starts at login, restarts automatically if it crashes |
| Linux | systemd --user unit — starts at login; add loginctl enable-linger $USER if you want it to keep running even when logged out (e.g. a headless box) |
| Windows | Scheduled Task at logon — starts when you log in. (Windows has no simple no-admin equivalent to launchd/systemd's crash-restart; a true Windows Service is a heavier install requiring elevation and wasn't worth the extra friction for a per-user local tool) |
Ports, bind host and data directory can be customized at install time (--ui-port, --otlp-port,
--mcp-port, --bind-host, --data-dir), and are remembered across restarts in
~/.traceroost/config.json:
traceroost service install --ui-port 3001 --otlp-port 4319 --data-dir ~/traceroost-data
Since npx always runs from a temporary cache with no stable path to launch from, running
service install under npx installs traceroost globally first (equivalent to
npm install -g traceroost@latest) so the service definition has something fixed to
point at.
Docker (OTEL only)
Docker receives OTEL only. The container is isolated from the host filesystem, so there's no log file ingestion, no agent auto-configuration (use the setup scripts), and no git outcomes. Use the native process option above unless you specifically need a container.
Quick-start commands are in Ways to Run. Additional options:
LAN-accessible — exposes the dashboard to other devices on your network:
docker run --pull=always -p 3000:3000 -p 4318:4318 -v ~/.traceroost:/data traceroost/traceroost
Other devices then open http://<your-ip>:3000/?token=<token> and point agents at
http://<your-ip>:4318 with the token (see token above). Add -p 4316:4316
to expose the MCP endpoint too.
Custom ports — if 4318 is already in use by the VS Code extension:
docker run --pull=always -p 127.0.0.1:3001:3000 -p 127.0.0.1:4319:4318 \
  -v ~/.traceroost:/data \
  traceroost/traceroost
Then point your agents at http://localhost:4319 and open http://localhost:3001.
Node.js (from source)
Requires Node.js 24+ and this repository cloned locally.
pnpm install
pnpm run local
Editions
TraceRoost is built in two editions from the same source:
- core — everything in this README: the dashboard, log/OTEL ingestion, the MCP server, the
Advisor, and the local CLI analysis (
find,trace,patterns,cohort,advise). It contains no TraceRoost Cloud (org link + upload) code at all — not disabled, not built in. Released builds (VSIX, npm, Docker) are core until TraceRoost Cloud launches. - full — core plus TraceRoost Cloud: the Org panel,
traceroost org/--explain-payload/cluster, and forwarding hashed rollups to a linked org (see CLOUD_ARCHITECTURE.md). A from-sourcepnpm run localorF5builds this edition.
node esbuild.js --edition=core builds core; the default is full. See
CONTRIBUTING.md for how the split is enforced.
Automation Prompts File
When an automation threshold is crossed, TraceRoost can write the generated prompt to a markdown file. To act on it automatically, configure your agent to watch or include that file as an input — for example, by pointing Claude Code at it via a hook or referencing it in a system prompt. Without that wiring, the file serves as a persistent, reviewable log you can paste from manually. For simpler workflows, leave Write prompts file off and use the Copy Prompt notification button instead.
How it works
When Write prompts file is enabled for an automation rule, each trigger appends a timestamped entry to an agent-specific file:
| Agent | File written |
|---|---|
| Claude Code | traceroost-prompts-claude.md |
| GitHub Copilot | traceroost-prompts-copilot.md |
| Codex | traceroost-prompts-codex.md |
| OpenCode | traceroost-prompts-opencode.md |
| Cursor CLI | traceroost-prompts-cursor.md |
In the VS Code extension, files are written to the workspace root. In local mode, files are written to the directory where the server is running.
Each entry uses this format:
## 2026-05-21 14:30:22 — Loop Breaker

[TraceRoost Automation: Loop Breaker]

...generated prompt...

---
When Write prompts file is off (default), triggering an automation shows a notification with a Copy Prompt button instead — click it to copy the prompt to your clipboard, then paste into your agent.
VS Code Commands
Open the VS Code Command Palette (Cmd+Shift+P / Ctrl+Shift+P) and search for TraceRoost:
| Command | Description |
|---|---|
TraceRoost: Open Dashboard |
Open the full dashboard in an editor panel |
TraceRoost: Export OTEL Data |
Write the raw OTEL spans currently held in memory to JSON files in your workspace root, one per agent and endpoint (export_<agent>_<endpoint>_<timestamp>.json). The Export dashboard tab exports per-trace summaries instead |
TraceRoost: Export OTEL Data (Redacted) |
Same, with prompt text, tool inputs, tool results, and PII attributes replaced with [redacted] (export_redacted_…) |
TraceRoost: Show Storage Stats |
Report local database size, blob storage size, trace count, date range, and current retention setting to the Output panel |
TraceRoost: Dump Span Attributes |
Debugging aid: print the span names and attributes in the live window (one example per Codex span type, the last few Claude spans) to the Output panel |
The full edition (see Editions) adds TraceRoost: Link This Machine to an Org (Cloud), TraceRoost: Org Link Status (Cloud) and TraceRoost: Unlink (Cloud); released builds are the core edition and don't include them.
Extension Settings
| Setting | Default | Description |
|---|---|---|
traceRoost.otlpPort |
4318 |
Local port for the OTLP trace receiver |
traceRoost.enableOtelIngestion |
true |
Accept incoming OTEL span data. The OTLP server keeps listening on traceRoost.otlpPort regardless; disabling this silently drops received payloads without storing them. |
traceRoost.enableLogIngestion |
true |
Read local log files and databases from Claude Code, Codex, Copilot CLI, Copilot Chat, OpenCode, and Cursor CLI. Disable if you only want OTEL data. |
traceRoost.autoConfigureAgents |
true |
Automatically write OTEL telemetry settings into Claude Code's, Codex's, and Copilot's own configuration on every activation. Disabling leaves your agents' configuration untouched — use the Configure OTEL button in Settings for a one-off manual apply, or configure OTEL manually (see Manual Configuration). |
traceRoost.enableMcpServer |
true |
Start the TraceRoost MCP server so Claude Code and other MCP-compatible agents can query your trace history. |
traceRoost.mcpPort |
4316 |
Local port for the TraceRoost MCP server (when traceRoost.enableMcpServer is true) |
traceRoost.sessionRetentionDays |
90 |
How many days to keep trace history in the local database (pruned on activation and every 24 hours) |
AI Usage Disclosure
TraceRoost was built primarily with Claude. Thank you to Anthropic for building tools that make projects like this possible.
License
MIT, except the src/cloud/, src/test/cloud/, media/src/cloud/, and
standalone/cloud/ directories (the org/cloud client — Business Source
License 1.1) — see NOTICE.md.
Disclaimer
TraceRoost is an independent open-source project and is not affiliated with, endorsed by, or associated with GitHub, Inc. or Microsoft Corporation (GitHub Copilot); Anthropic, PBC (Claude / Claude Code); or OpenAI, LLC (Codex CLI). All product names, trademarks, and registered trademarks are the property of their respective owners. TraceRoost interacts with these products only through their telemetry interfaces and the log files and databases they write locally on your machine.
Third-party changes. TraceRoost depends on log formats, telemetry, pricing, and plan-limit information controlled by third-party vendors, including Anthropic, OpenAI, GitHub/Microsoft, Cursor, and OpenCode. These vendors may change, deprecate, or remove their products, APIs, log formats, telemetry, pricing, or usage limits at any time, without notice. Such upstream changes are outside the control of TraceRoost and its maintainers, and may cause TraceRoost to show incomplete, inaccurate, or missing data, or to stop working in whole or in part. TraceRoost and its maintainers are not responsible or liable for any impact of those changes, including on costs, charges, rate limits, quotas, or decisions made based on data TraceRoost reports. TraceRoost is provided "as is", without warranty of any kind, as stated in its license.