Console Ninja
Console Ninja is a VS Code extension that displays console.log output and runtime errors directly in your editor from your running browser or node application. It's like your browser dev tools console tab or terminal output from your node app, but instead of having to context switch, values are connected to your code and displayed ergonomically in your editor.
Table of contents
Current status
Console Ninja extension comes with 2 feature sets: Community and PRO.
Console Ninja Community feature set includes many fundamental features such as displaying console.log output and runtime errors directly in your editor, showing all recorded logs and errors in the log viewer, etc. Console Ninja Community feature set is free to use, and will always be free to use.
Console Ninja PRO (paid) feature set includes everything from the Community feature set as well as many additional advanced features that can be explored on our website Pro page and are documented in a separate doc section. Unless the feature is documented as being available in the PRO edition, it will always be available in the Community edition for free.
Console Ninja feature sets are designed and will be extended in future with the goal of providing you the best tool in the world for debugging your applications. Whether you are using the free or paid version - we will do our best to make you as productive as possible. With the PRO feature set, we are aiming to 10x your productivity, especially in more advanced debugging scenarios:
- with larger number of logs,
- medium and large company projects,
- realtime value watching and diff-ing,
- zero config code coverage powered analysis,
- and much more.
You may easily switch between feature sets in the extension settings, request a trial period for Console Ninja PRO feature set by using the "Console Ninja: Manage License" command in VS Code, and unlock the full Console Ninja PRO feature set by purchasing a subscription.
Supported technologies
Console Ninja currently supports the following tools:
- Vite, including
- web applications that were generated by Vite CLI such the ones using React, Vue, Preact, Lit, Svelte, Vanilla, TypeScript or JavaScript;
- web applications configured to use Vite;
- web applications powered by app frameworks that are using Vite, such as Nuxt or SvelteKit.
- Webpack, including
- Next.js, including first class support for browser and server side (Node and Edge) logs (Next.js middleware is currently not supported). Turbopack (PRO feature) is also supported.
- Nest.js, if using Nest.js 10+ with SWC as compiler, follow instructions of this comment.
- Remix, including first class support for client and server side logs (no errors).
- Nuxt.
- Astro, including first class support for client and server side logs (no server side errors).
- React Native with Expo, including first class support for logs in iOS and Android emulators (PRO feature), and Web simulator.
- Shopify Hydrogen.
- Qwik.
- Serverless Offline.
- Jest test runner (no errors).
- Cypress.io end-to-end test runner.
- http-server, live-server and serve static HTTP servers.
- Live Server VS Code extension (
off by default, can be turned on in the Console Ninja extension VS Code settings).
- Live Preview VS Code extension (
off by default, can be turned on in the Console Ninja extension VS Code settings).
In addition to the technologies above, Console Ninja also supports node app.js-like workflows including Express, Hapi, Fastify and other similar frameworks. Custom node applications are also supported. To learn more, please refer to the Universal Node applications section.
We have designed Console Ninja in such a way that adding support for new tools is fast and easy, so please let us know if there's another technology you want to use Console Ninja with.
Get started
Console Ninja is designed to fit seamlessly into most typical dev workflows. After you have installed the extension in VS Code and opened your project, you may perform the same steps you usually take:
- run
npm/pnpm/yarn script or CLI command that starts/opens your app in dev/watch/hot-reload mode *;
- start making code changes, such as adding
console.log to your code **;
- if required ***, perform the actions within your app that trigger the modified code, ie. click a button if you have added
console.log to the button click handler;
* If your app is a custom nodejs application then you need to prefix your CLI command with console-ninja, please refer to Universal Node applications for more information.
** Most modern tools run in watch mode with hot reload enabled. If your tool doesn't have such mode, then, the same way as without Console Ninja, you need to refresh your app page to make it run your modified code.
*** Sometimes your modified code may be triggered immediately upon the (hot) reload of the app. For example, when code is located in the root of a component, it will be executed when the app (re)starts. If the modified code is not triggered by the app (re)start, then, the same way as without Console Ninja, you will need to perform your app specific actions to trigger the code execution.
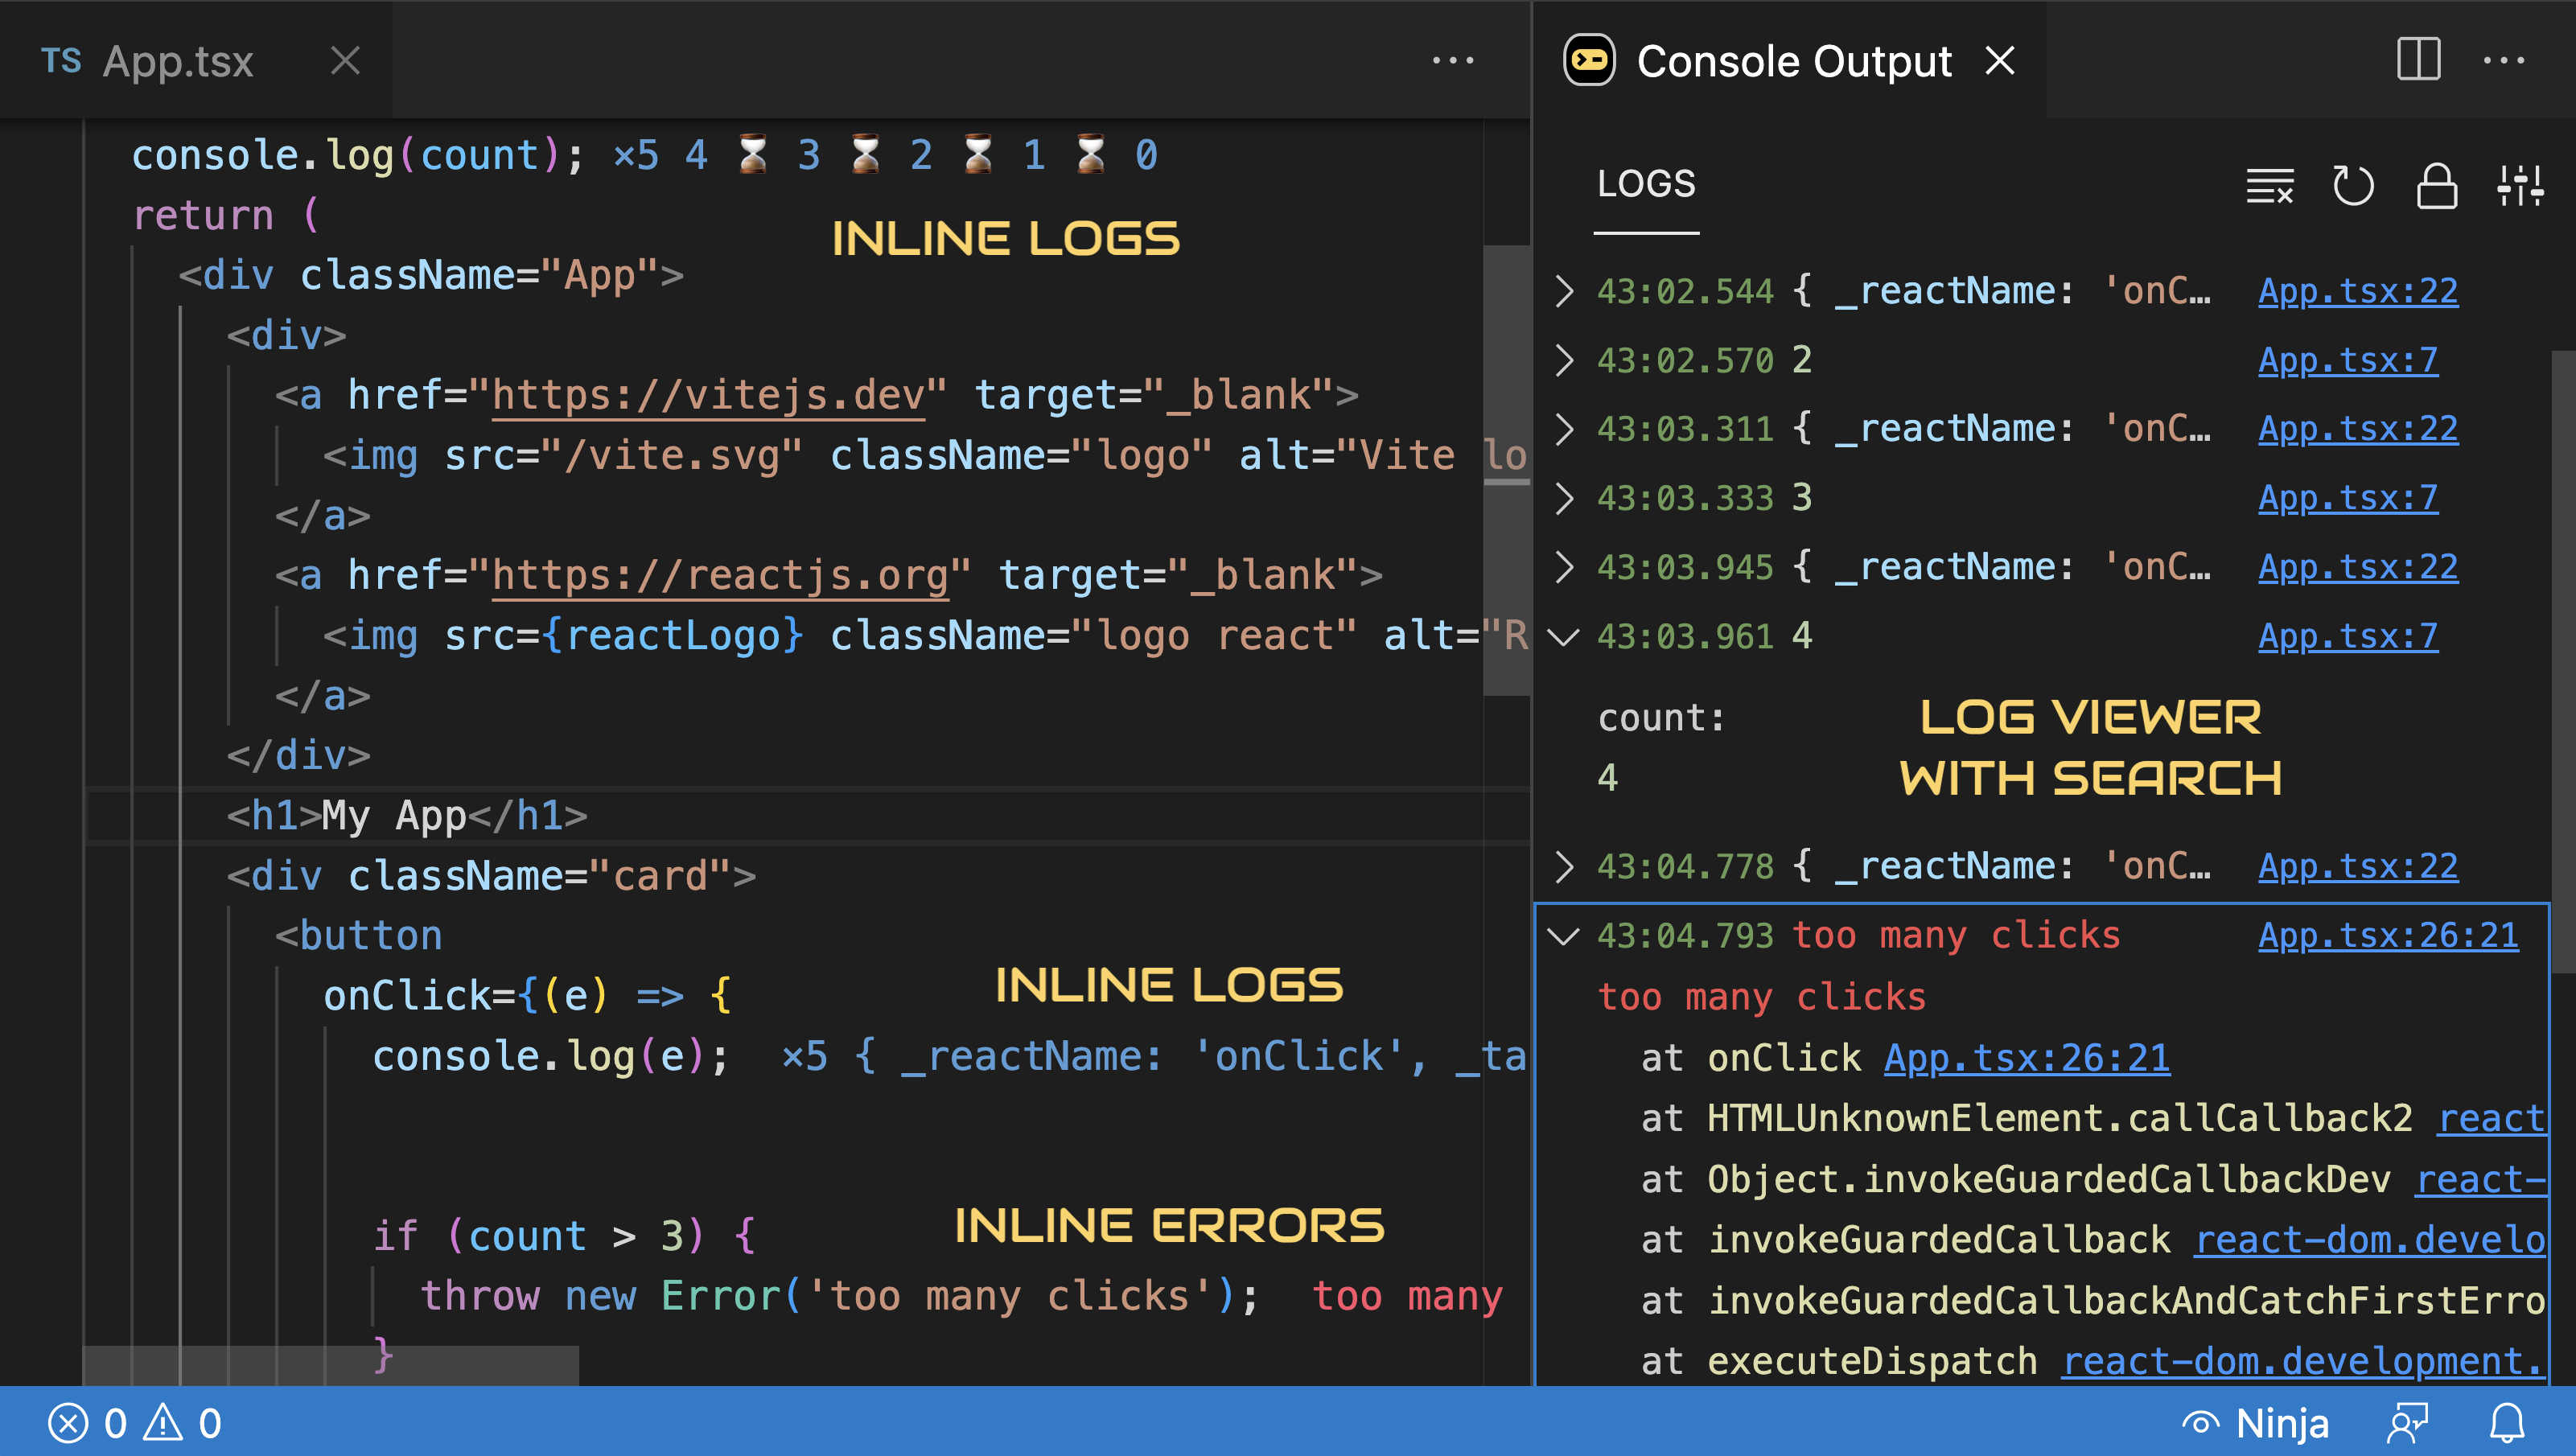
You should now be able to see logs (and errors, if any) in your editor, next to the relevant line of code. Hovering over the console.log or error value will display more details. If you don't see the expected output, please check Console Ninja's current status.
Using the Show Output command displays the log viewer, allowing you to explore more details and navigate between logs and code.
console.log
Adding console.log to your code will display the log output in your editor, next to the relevant line of code. Hovering over the console.log value will display additional details. The log output is also displayed in the log viewer.
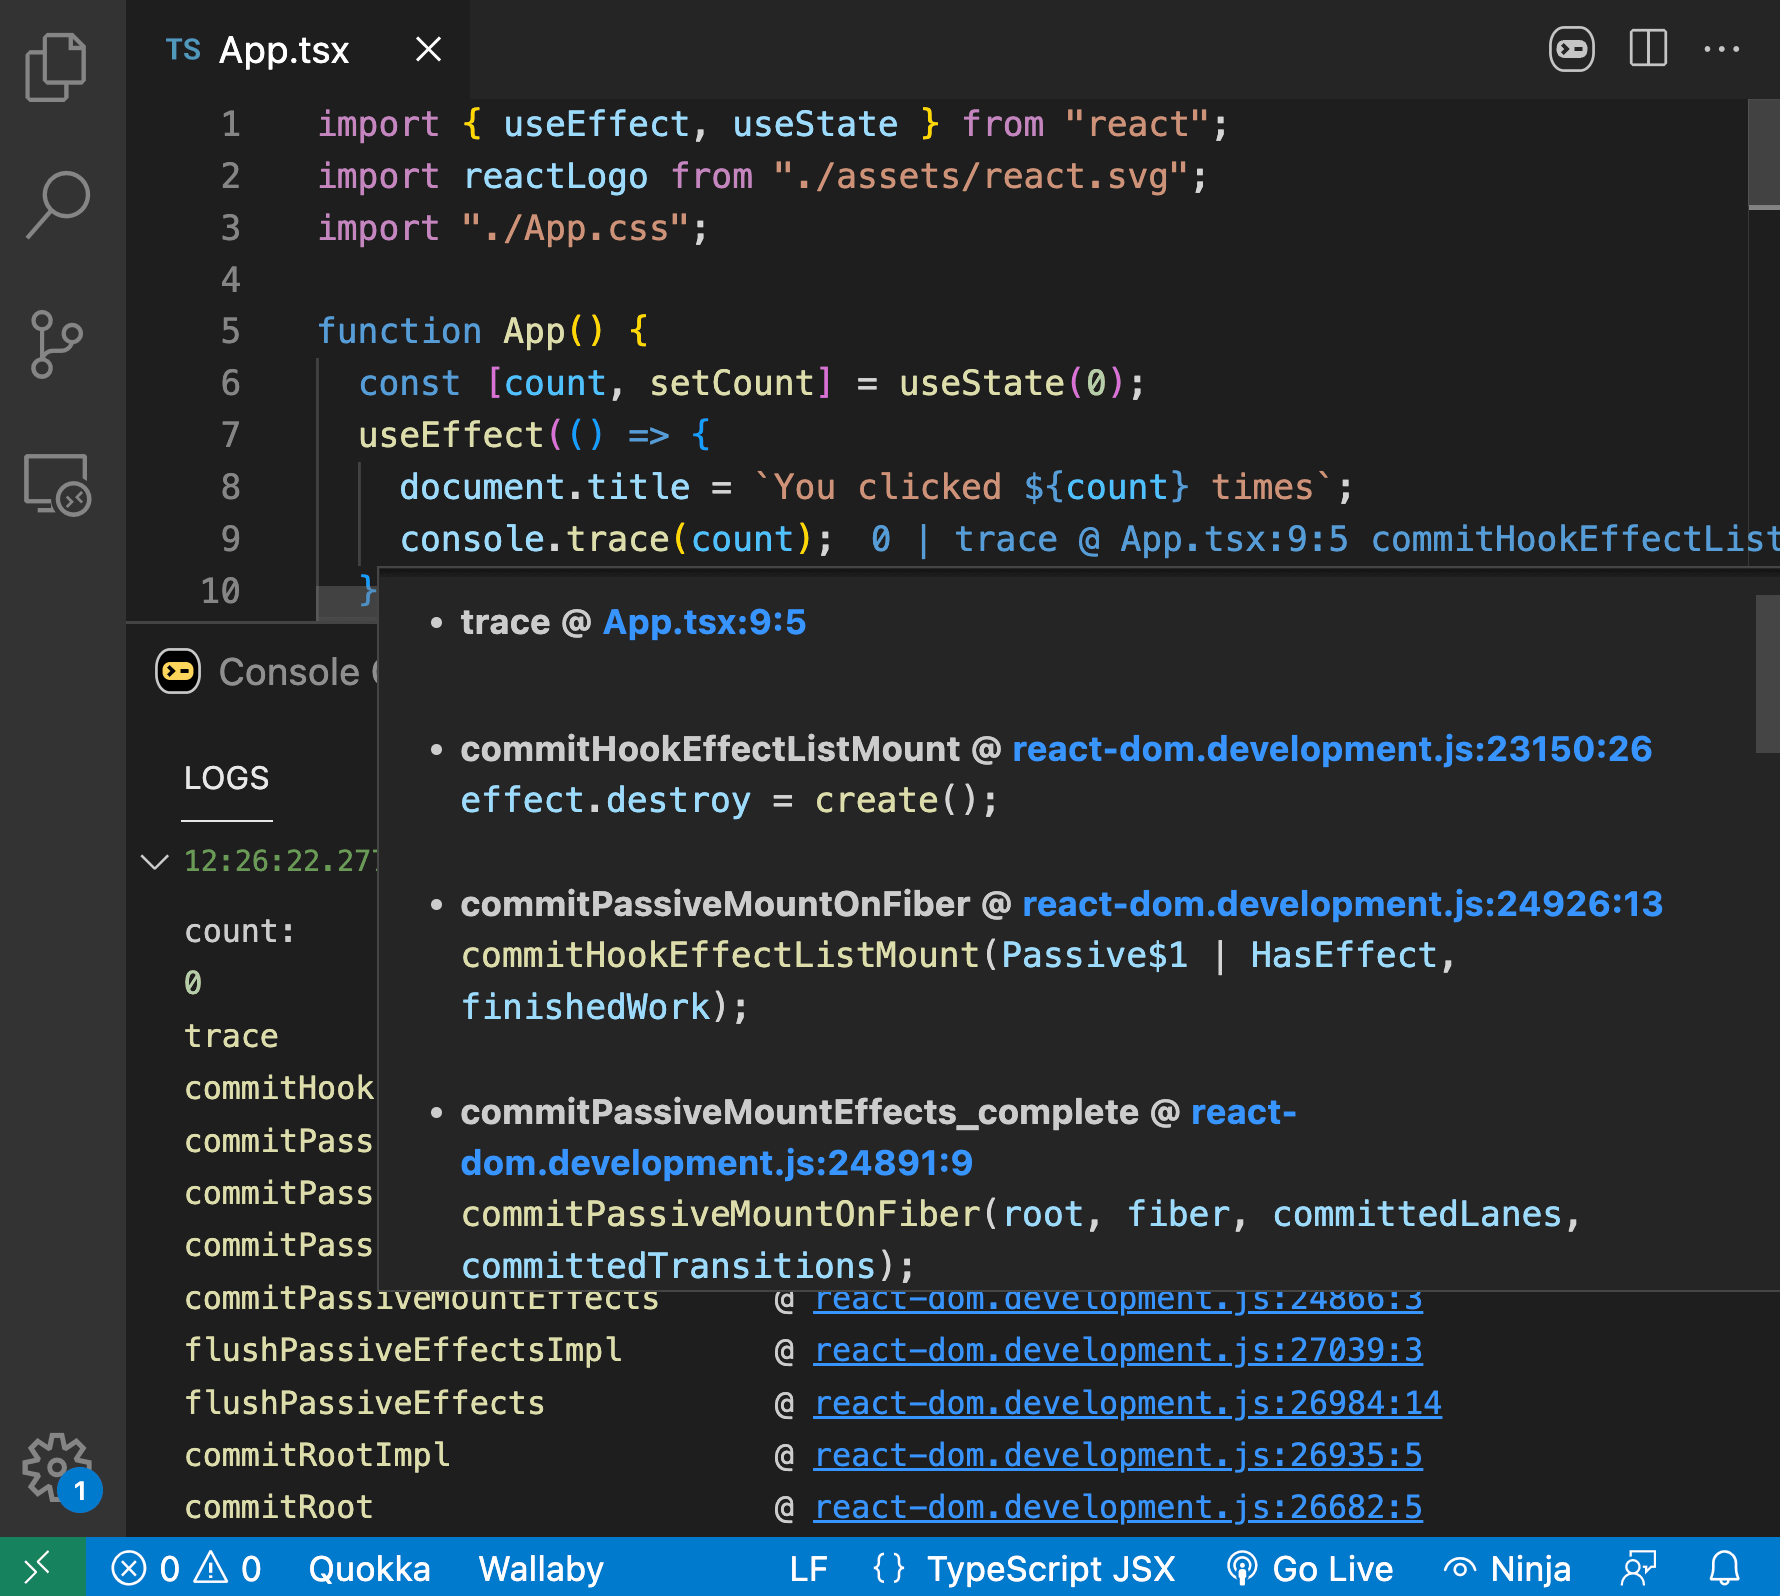
console.trace
Adding console.trace to your code will display the call stack trace right in your editor, next to the line of code with console.trace. The stack trace output is also displayed in the log viewer.
console.time
Adding console.time('some_label') and console.timeEnd('some_label') to your code will display the time it took to execute the code between the calls right in your editor, next to the line of code with console.timeEnd. The time output is also displayed in the log viewer.

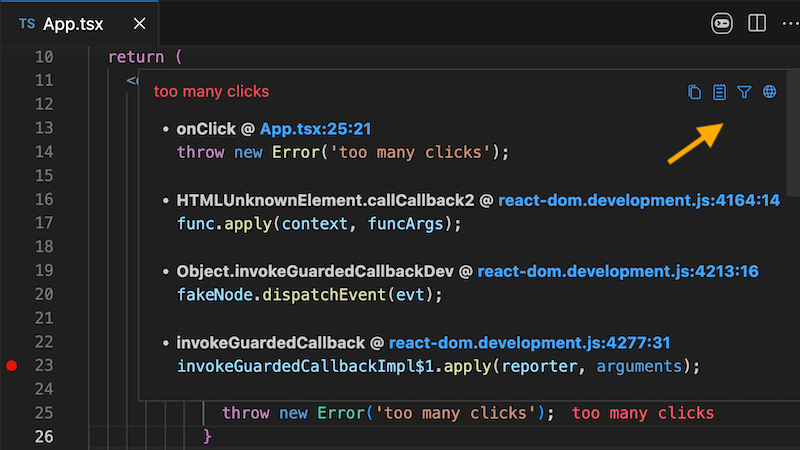
Hovering over Console Ninja output, such as logs or errors, will display more details, such as the log value, timestamp, error message, and stack trace.

The hover tooltip also provides a few actions displayed as icons in the top right corner of the widget, for example:
Show in Console Output action that opens Console Ninja's log viewer and focuses on the log entry.Open Filtering Settings action that opens Console Ninja's output filtering settings.
Log viewer
Using the Show Output command opens Console Ninja's log viewer. The log viewer also appears automatically when your app produces logs or errors. Use Disable Output Panel Auto Display and Enable Output Panel Auto Display to toggle this behavior.
The log viewer shows all recorded logs and errors from your running application in chronological order, with newer entries at the bottom. When the command is triggered on a line with a console.log result, the last recorded log entry is focused in the log viewer.
Universal Node applications
Console Ninja supports virtually any node application (from Node v16.15.0 onward), including Express, Hapi, Fastify, or your own custom node applications. To get started, simply prefix your node app.js command with console-ninja and run it in the VS Code integrated terminal.
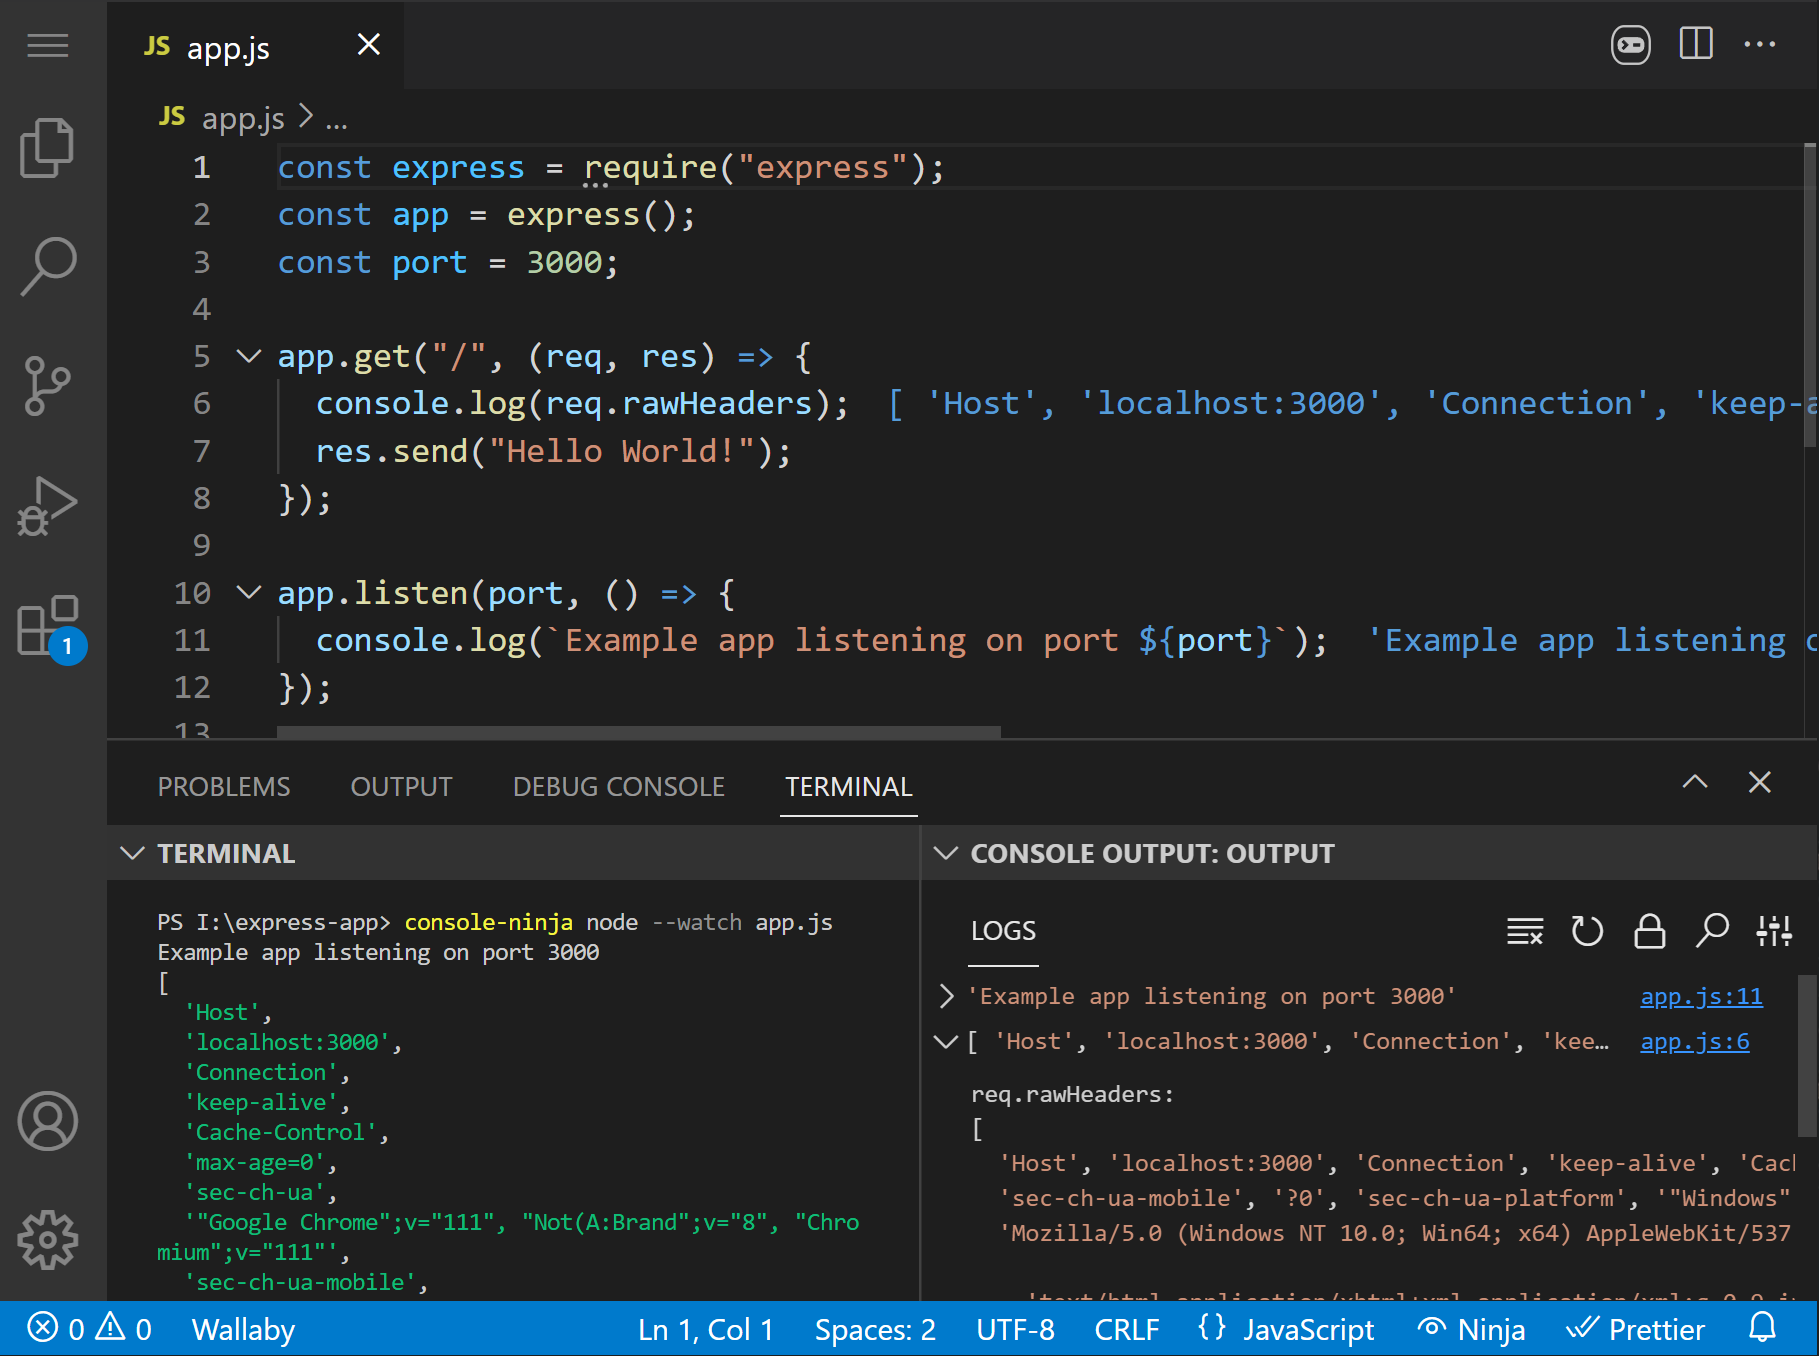
Here are some more examples of how you may use the command:
console-ninja node --watch app.jsconsole-ninja npx nodemon app.jsconsole-ninja npm run devconsole-ninja yarn node app.jsconsole-ninja npx tsx app.tsconsole-ninja npx ts-node app.ts
If you want all subsequent commands in your terminal session to run automatically with console-ninja, simply source/run console-ninja with no arguments first:
Linux/macOS (bash/zsh):
source console-ninja
node app1.js
node app2.js
Windows (PowerShell/Cmd):
console-ninja
node app1.js
node app2.js
If you would like to use console-ninja command in an external terminal, add ~/.console-ninja/.bin to your PATH by running the Console Ninja: Install 'console-ninja' command from the VS Code command palette, then reload your terminal session. On Windows, depending on how you launch apps, you may need to restart the Explorer process or re-login to the system. Use the Console Ninja: Uninstall 'console-ninja' command from the command palette to remove ~/.console-ninja/.bin to your PATH.
The console-ninja.installBinToPath VS Code setting (default: false) lets Console Ninja automatically add ~/.console-ninja/.bin to your PATH on first start.
Please note: if your project uses a tool that Console Ninja supports out of the box then you don't need to prefix your CLI commands with console-ninja the prefix.
Runtime Log Capture Options
Console Ninja serializes values efficiently and automatically dials back traversal when logging gets frequent or expensive. Defaults are tuned for typical dev workflows. Customize via the console-ninja.logCaptureOptions setting. Requires restarting the editor and your dev tool.
Configure in VS Code
- Open the Command Palette →
Preferences: Open Settings (JSON).
- Add or update the
"console-ninja.logCaptureOptions" object (user or workspace scope).
- Save, then restart the editor and your dev tool (e.g.,
npm run dev).
All options (with defaults)
resolveGetters: boolean (default: false)
- Evaluate object getters during serialization. Off to avoid side effects and overhead.
defaultLimits: object — normal traversal limits
- props: number (100) — max object properties traversed per node.
- elements: number (100) — max array/iterable elements traversed per node.
- strLength: number (51200) — max captured length of a single string.
- totalStrLength: number (51200) — max total captured string length per entry.
- autoExpandLimit: number (5000) — max auto-expanded properties across the tree.
- autoExpandMaxDepth: number (10) — max auto-expand depth for nested objects.
reducedLimits: object — stricter limits used under load
- Same shape as defaultLimits. Applied automatically when reduction is triggered.
- Defaults: props (5), elements (5), strLength (256), totalStrLength (768), autoExpandLimit (30), autoExpandMaxDepth (2).
reducePolicy: object — controls when reducedLimits activate and when windows reset
- perLogpoint: object — per logpoint id window
- reduceOnCount: number (50) — switch to reducedLimits for this id after this many hits.
- reduceOnAccumulatedProcessingTimeMs: number (100) — switch after accumulated processing time exceeds this many ms for this id.
- resetWhenQuietMs: number (500) — reset the per-id counters after this period of inactivity.
- resetOnProcessingTimeAverageMs: number (100) — only reset if average per-hit cost is below this threshold.
- global: object — across all logpoints
- reduceOnCount: number (1000) — switch to reducedLimits globally after this many hits.
- reduceOnAccumulatedProcessingTimeMs: number (300) — switch globally after accumulated processing time exceeds this many ms.
- resetWhenQuietMs: number (50) — reset the global counters after this period of inactivity.
- resetOnProcessingTimeAverageMs: number (100) — only reset if average per-hit cost is below this threshold.
Behavior
- Reduced limits are used if either the current logpoint or the global window has triggered reduction.
- A per-logpoint quiet reset also clears the global window, so reductions don’t linger after inactivity with low average cost.
Example configuration
{
  "console-ninja.logCaptureOptions": {
    "resolveGetters": true
  }
}
Troubleshooting
If Console Ninja is not working for you as expected, the first thing to check is the extension status. You may see the status info by hovering over the extension icon in VS Code status bar.

The status popup information dialog explains the current state of the tool and provides some tips on what to do next.
Console Ninja uses a local websocket server to communicate with your editor, and VPNs and firewalls can interfere with this communication. If you are having connection-related issues and are connected to a VPN, try disconnecting from the VPN. If you are using a firewall, you may try temporarily disabling it to see if it is the cause of your problem; if so, refer to your firewall documentation to see how to identify blocked traffic and how to configure it to allow Console Ninja.
If Console Ninja is not working as expected in a multi-root workspace, use the Console Ninja: Select Multi-Root Workspace Project command to ensure the tool runs on your intended project.
By default, Console Ninja logs to ~/.console-ninja/trace.log.
If you encounter issues, check this file for errors or warnings. When contacting support, please include the relevant log content (after removing any sensitive information).
For more detailed logs, set the CONSOLE_NINJA_LOG_LEVEL environment variable to verbose and restart your development tool. For example:
Linux/macOS (bash/zsh):
CONSOLE_NINJA_LOG_LEVEL="verbose" npm run dev
Windows (PowerShell):
$env:CONSOLE_NINJA_LOG_LEVEL="verbose"
npm run dev
How does it work
Console Ninja integrates with locally installed tools that are building/preparing your code, and then inspects and adjusts your code (in a way that doesn't change how it executes) before it gets to the runtime (browser or node process that runs the code).
To integrate with supported tools seamlessly, Console Ninja patches your locally installed node modules. When you stop Console Ninja in the editor with the Pause command, all patches are removed.
If after stopping Console Ninja you observe some runtime issues (such as Console Ninja websocket errors in your browser), try clearing your build tool's cache. Depending on your stack, the following commands should help:
- run
rm -rf node_modules/.cache,
- run
rm -rf .next,
- run
rm -rf .angular,
If the steps above don't help, and you are not sure how to reset your build tool's cache, try re-installing node modules, this should result in your build tool creating new cache and should resolve the issue.
Console Ninja detects if you are running your tool in production mode (by checking CLI flags and process environment variables). When production mode is detected, the tool will not modify your application code even if Console Ninja is running. In the (unlikely) case that you are running production builds on your local dev computer AND are deploying or sharing local builds outside of your machine, we recommend running the Console Ninja Pause command in your editor prior to running your build to guarantee that no instrumented code ends up in your production code.
Console Ninja instrumentation is limited to sending runtime values for console.log and errors to your locally running editor only (localhost hosted websocket server). The runtime data from your app is never sent outside of your local machine. If the code of your application is somehow instrumented by Console Ninja and then used outside of your local machine for some reason:
- in browser, it will simply do nothing if the app host is not
127.0.0.1, localhost, or one of your network adapter's IP v4 addresses. To connect from a different host name, use the console-ninja.allowedHosts VS Code setting. Note: the PRO edition also supports the use of * and ? for wildcard matching (e.g. *.example.com), and regular expressions (e.g. /^.*\\.example\\.com$/).
- in node, it will fail to connect to
localhost and will not stop your app from working.
To disable Console Ninja Welcome message displayed in build tools CLI and browser that has a link to this docs section, you may use the console-ninja.showWelcomeMessageInTools setting in VS Code.
Quokka.js
Quokka.js is another awesome tool from our team. Like Console Ninja, Quokka.js allows you to see various execution results without leaving the comfort of your editor.
The fundamental difference between Console Ninja and Quokka.js is that Quokka runs new scratch files or existing code files as a self-contained program. Quokka allows you to quickly execute and iterate code in an isolated playground without unnecessary application execution. Console Ninja on the other hand runs within your application (started by your dev server, or test runner), and allows you to debug any end to end scenarios within your running app.
Wallaby.js
The Wallaby.js tool from our team runs your JavaScript and TypeScript tests immediately as you type, highlighting results in your IDE right next to your code.
While you may use Console Ninja to display logs from supported test runner CLIs, test errors are not handled by Console Ninja; this is because test errors are caught/handled by test runners themselves, and special processing is required to format and display test results.
Wallaby not only displays logs and test errors inline (and in a separate ergonomically designed view), but is also packed with features, such as inline code coverage and a time travel debugger, that provide superpowers to your current testing framework/stack, such as Jest, Vitest, Mocha. etc.
Error Lens extension
Error Lens is a VS Code extension that provides inline output for VS Code Problems output window, typically static code analysis errors from your code linter or language service, such as a linter rule violation or TypeScript types-related error.
In contrast, Console Ninja runs within your application and displays runtime logs and errors.
PRO features
Console Ninja PRO feature set includes everything from the Community feature set as well as many additional advanced features that can be explored on our website Pro page, and are documented below.
Log Viewer Pro
In addition to the log viewer features available in the Community edition, the PRO edition includes additional features to provide an even more powerful way to analyze complex output.
Indentation guides
Indentation guides provide a clear visual representation of the nested structure of
your objects.
Expand/collapse controls
Expand/collapse controls allow you to collapse and expand nodes within nested objects.
These features allow you to focus on specific sections of your logs without being overwhelmed by the
sheer size and complexity of the output.
Breadcrumbs
Breadcrumbs feature provides a quick way of navigating the nested structure of your large logged objects.
After clicking on a value inside a large object or using Enter plus navigation keys to browse the object, you can see the current property path in the breadcrumbs panel at the top of the log viewer. You can click on any of the breadcrumbs to scroll to the corresponding node and highlight it.
Log entry highlighting
This feature allows you to highlight log viewer entries that are logged from the same place in your code. No need to add prefixes like console.log('!!! HERE', obj) to your logs any longer - highlighted entries are decorated with a visually distinct colored & numbered indicator. Highlighting makes it easier to quickly identify specific log entries in scenarios with a lot of logs.
Both console.log statements and logpoints can be highlighted.
Toggle Log Highlight command allows you to toggle highlighting of the current log location. The command is available from the editor command palette, from the log hover tooltip and as a code action (via the editor line light-bulb).
Clear All Log Highlights command allows you to clear all current log entry highlights.
Log entry filtering
Adding multiple console.log statements, or even better, some logpoints may quickly result in large and hard-to-manage output. At the same time, removing log statements to limit output can be distracting and you may still need them for your debugging session.
To address the issue, log entry filtering allows you to filter log viewer entries by their file and/or line.
Unlike the output filtering, that applies to all output (including inline output) at the time of capturing it, the log entry filtering only applies to the displayed log viewer entries. The log entry filtering also does not stop Console Ninja from capturing logs and errors, so you can still see all logged results when the filter is reset.
Log entry diff view
You may select any two values to compare them in a diff view.
Date and time display modes
Change Date and Time Display Mode command to show/hide date/time part of each displayed log entry, as well as display an entry time relative to the oldest display entry time, or relative to the previous entry time. The option to instantly switch between the absolute and relative timelines can be tremendously helpful in scenarios where you need to quickly understand the time gap between log entries.
Log Map
Log Map lets you view your app output grouped by source code location. While open, you can monitor a specific location and instantly see how its value changes as your code or app behavior changes.
Logpoints
While using the console.log feature provides an excellent way to log expression values, oftentimes you may want to display or capture expression values without modifying your code. There are also many times when inserting console.log can get tedious, such as:
- when logging an arrow function expression return value or the function parameter value (i.e. logging
e or e.prop in a.map(e => e.prop));
- or logging a JSX expression value (i.e. logging
count in <span>count is {count}</span>).
- or logging an expression in the middle of another expression (i.e. logging the result of
a.b() in a.b().c(); without calling a.b() twice).
Console Ninja Logpoints allow you to log the value of any expression in your code, without modifying your code, by simply placing a VS Code breakpoint in your code. When Console Ninja is running (and the VS Code debugger is not), the breakpoint will not stop your code, but will act as a logpoint and will log the value of the expression next to your code and to the Console Ninja log viewer.
To use the feature, you may simply place a breakpoint (F9) on any line. If you want to be more precise about what to log on a line, you may place an inline breakpoint (Shift + F9) near/inside the expression that you would like to log.
In the example below:
- inline breakpoint on the line 8 outputs the value of the
document;
- inline breakpoint on the line 23 outputs the value of the
e parameter of the onClick button handler;
- inline breakpoints on the line 24 and line 30 outputs the value of the
count variable.

Once a breakpoint is placed and Console Ninja is ready to output some values for it, a special ⚡️ indicator is placed at the line with the breakpoint. If a breakpoint is placed and there's no special indicator visible, it means that it is placed in a location where Console Ninja cannot find anything to log (for example, on a line without executable JS/TS code).
Because logpoints are VS Code breakpoints, you can remove them in bulk using the Console Ninja: Remove all Breakpoints in File command or the Remove All Breakpoints command. Please note that this second command removes all breakpoints in all files.
React hooks logging
When a logpoint is placed on a line with a React hook with dependencies, Console Ninja logs the values of the dependencies that triggered the hook's callback function execution. This way you can spot the difference between current and previous hook dependency values with ease.
Network Logging
Network logging captures the details of network requests made by your browser to your application.
Only requests related to files currently opened in your editor are logged. Both the fetch and XMLHttpRequest APIs are supported.
In community edition the URL, method (e.g. get, post), and status (e.g. 200, 404, 500) are available. PRO edition also logs the request and response content. The content-type of payloads is used to determine the best way to display
captured content (e.g. JSON content is displayed as expandable objects). Large values are automatically collapsed.
Network logging can be paused using the Toggle Network Request Logging command or using the toggle icon in Console Output. It can also be disabled entirely in the
Console Ninja extension settings via the console-ninja.output.showNetworkRequests setting.
Function logpoints
Function logpoints are special types of Console Ninja logpoints that allow logging every line of a function and its argument values, without modifying your code. Function logpoints are useful when you want to log the execution of a function, but do not want to insert console.log statements in the function body or place a logpoint on every line of the function.

To use the feature, you may simply place a breakpoint (F9) on a line of code where a function/method is defined. If there are multiple expressions or functions defined on a line, you may place an inline breakpoint (Shift + F9) near/inside the function keyword or method name, or at the start of an arrow function expression (🔴() => ...).
To override the value logged for a line within the logged function, inline breakpoint (Shift + F9) may be used near/inside a specific expression within the line.
Code Coverage
Function logpoints also collect accumulated code coverage for your function calls. The coverage is displayed in the gutter of the editor, and is
updated as you interact with your application or change your source code.
Here is what the coverage indicators mean:
- If you see a gray square next to a line of code, it means that the line of
code is has not been executed yet.
- If you see a yellow square next to a line of code, it means that the line
of code is only partially executed.
- If you see a green square next to a line of code, it means that the line
of code has been executed at least once.
- If you see a red square next to a line of code, it means that the line of
code is the source of an error, or in the stack of an error.
The colors of gutter indicators can be changed in Console Ninja settings.
The Clear all output command can be used to reset the accumulated code coverage state. This may be useful if you want to collect and inspect the coverage state for a specific interaction with your application.
The Toggle Uncovered Code Regions command allows you to quickly
highlight regions of your code that have not been executed (on lines with gray and yellow gutter
indicators).
File code coverage
To collect and display accumulated code coverage for all functions in a source file, you may use the Toggle File Code Coverage command. The coverage is displayed in the gutter of the editor, and is updated as you interact with your application or change your source code. The displayed indicators are the same as for function logpoints.
Class logpoints
Class logpoints are special types of Console Ninja logpoints that allow logging every line of all functions of a class without modifying your code.
To use the feature, you may simply place a breakpoint (F9) on a line of code where a class is defined.
To override the value logged for a line within the logged function, inline breakpoint (Shift + F9) may be used near/inside a specific expression within the line.
Predictive Logging
Predictive logging captures additional values based on logpoints and console.log usages. Lines with predicted values will display a ⚑ icon; hovering over this icon will show the captured values. Placing a logpoint on a line with a prediction will cause the values to display as if they were from a logpoint, both next to your code and in the Console Output window.
By default, console.log will not trigger predictive logging, but can be configured to do so using the console-ninja.allowConsoleLogToTriggerPredictions setting. Predictive logging can also be entirely disabled using the console-ninja.predictiveLoggingEnabled setting.
In addition to the hover tooltip features available in the Community edition, the PRO edition includes additional actions:
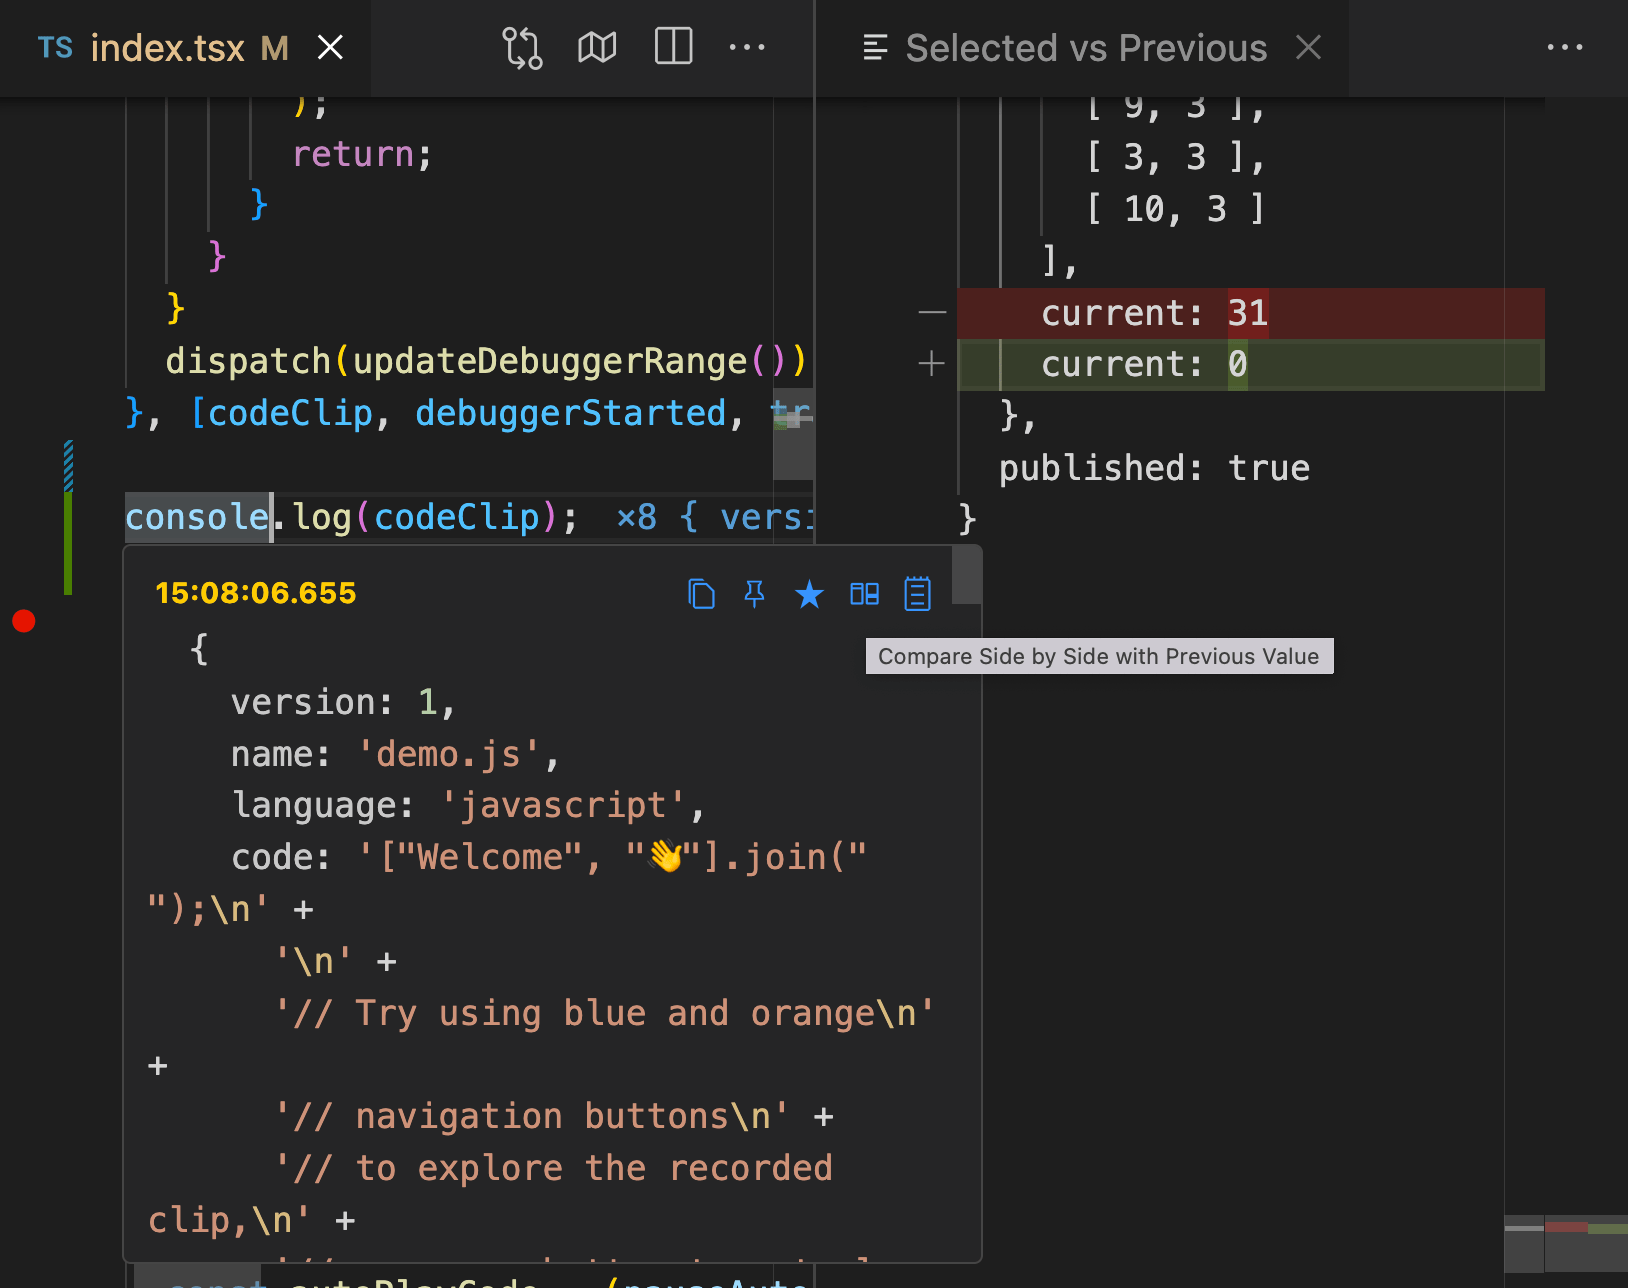
Copy to Clipboard action that copies the logged value or the error details to the clipboard. It's also available as a code action (via the editor line light-bulb).Show in Console Output action that opens Console Ninja's log viewer and focuses on the log entry.Highlight in Console Output action that highlights the log entry in Console Ninja's log viewer. The feature is also available as a code action (via the editor line light-bulb) and from the editor command palette.Compare Side by Side With Previous Value action that allows you to compare the current value with the previous value in the editor diff viewer.Watch Value action that allows you to keep the value of any logged expression displayed. The feature is available for both console.log and logpoints. The feature is also available as a code action (via the editor line light-bulb) and from the editor command palette.
Output Filtering Pro
Console Ninja PRO edition includes output filtering features to make working in large projects or projects with a lot of output easier. Unlike the log viewer entry filtering, that only applies to the displayed log viewer entries, the output filtering is applied to all output, including inline output.
Capture and display errors setting allows configuring whether to capture and display errors in the editor and in the log viewer. This is useful when you are working on a project with a lot of reported errors and you want to focus on logs only.
Capture and display logs only from files opened in editor setting allows configuring whether to capture and display logs from all files or only the files that are opened in your editor. This is useful when you are working on a project with a lot of files with logs and you want to focus only on output from files that you are currently working on.
Display logs from multiple running tools together in a single list setting allows to merge output from multiple running project tools, such as next.js server and next.js browser logs, Jest logs, etc., and display the output together in the log viewer. The merged output provides a holistic view of your running application, eliminating the need to
switch between multiple output sources. This integrated view of logs from all of your tools
provides an intuitive and efficient way to understand the complete behavior of your application.
Capture and display logs only from logpoints setting allows configuring whether to capture and display logs from console.log and other console.* statements. This is useful when you are working on a project with a lot of console.log statements and you want to focus on output from your logpoints only.
Quick Search Pro
In addition to the log viewer search features available in the Community edition, the PRO edition provides an easy way to search
across all of your project logs and errors with minimal distraction.
The Search Logs command allows you to search across all of your project logs and errors.
Quickly navigate to the specific line of code
associated with a log, as well as view the entire log in the
log viewer. Additionally, you can navigate between matching
log entries within the log viewer itself.
Separate navigation actions (either to open the code only or open the log viewer only) are available for each search result as side buttons.
Tracepoints
Console Ninja Tracepoints allow you to trace the execution of any block of code and understand where it is being called from, without modifying your code. Similar to logpoints, you may place a tracepoint (Add Tracepoint command) on any line/column, even in the middle of some expression, or next to a function parameter. When the code execution reaches the tracepoint, Console Ninja will log the current stack trace and the value of the expression located at the tracepoint position.
Timepoints
Console Ninja Timepoints allow you to measure the execution time of any block of code, without modifying your code, by simply placing a pair of timepoints in your code.
First, place a timepoint (Add Timepoint command) on the line where you want to start measuring the execution time. Then, place another timepoint (Add Timepoint command) on the line where you want to stop measuring the execution time. The timepoints will be highlighted by Console Ninja, and the execution time will be displayed next to the end timepoint and in the Console Ninja log viewer.

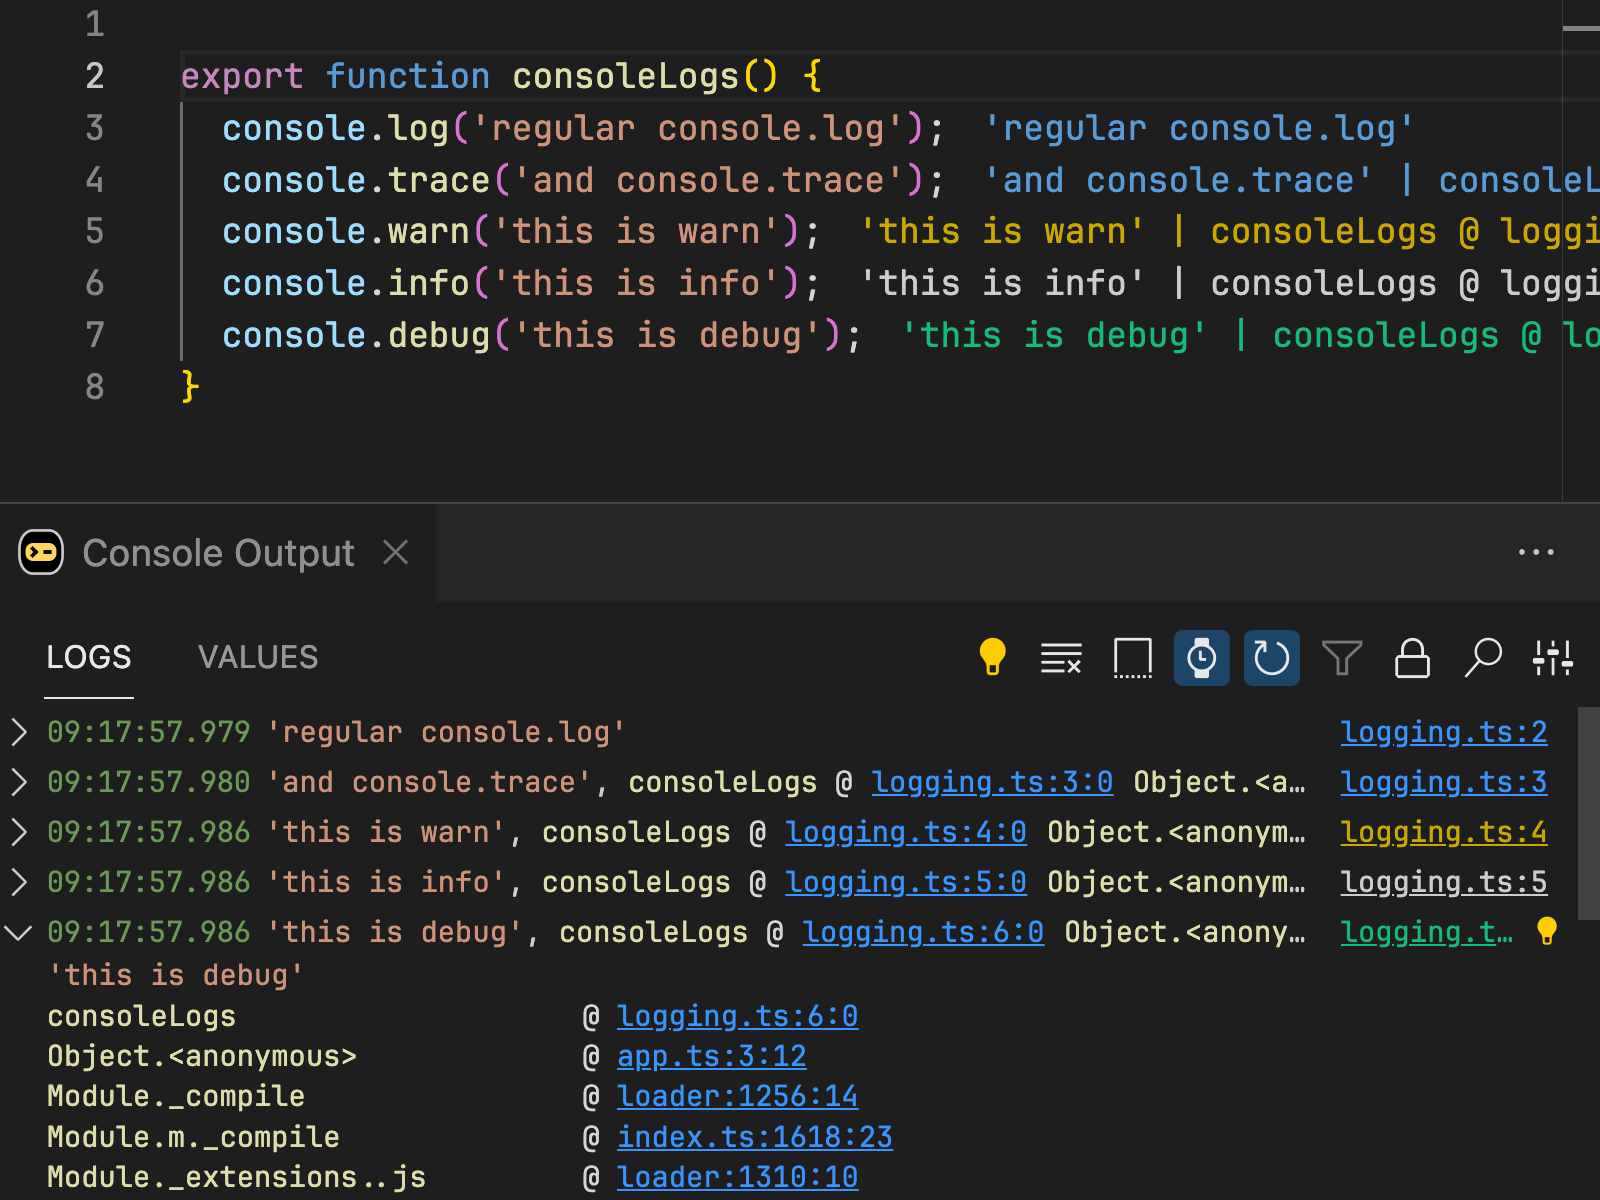
console.warn, console.info, console.debug, $inspect rune
console.warn, console.info, and console.debug offer functionality very
similar to console trace, but also present inline values and
log viewer location links in colors gathered from your active VS Code theme. This can help quickly identify important entries when many values are logged.
Svelte $inspect is a special rune that allows you to log the value of any expression. When Console Ninja is running, the $inspect(val) call will log the value of the expression next to your code and to the Console Ninja log viewer.
GitHub Copilot Integration
The best AI model for investigating application errors is the one with the most context - provided by the user and the right tools. Console Ninja automatically equips AI with everything it needs: detailed error messages, stack traces, contextual insights, and complete log data for smarter debugging.
How to use Console Ninja with GitHub Copilot
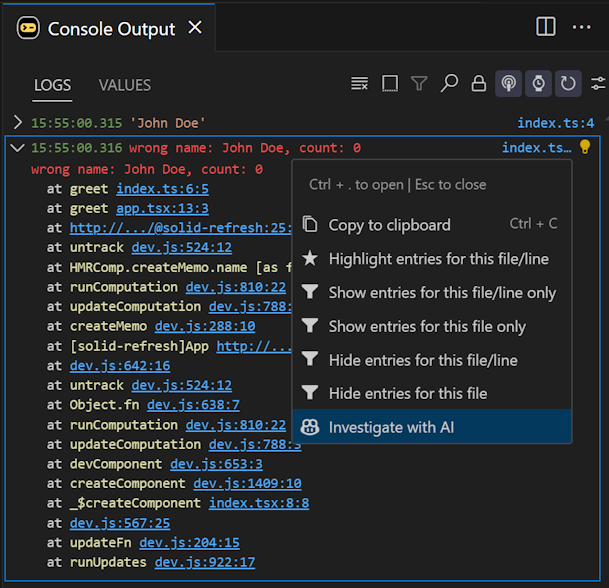
To get started, install the GitHub Copilot (which has a free tier for everyone) and restart VS Code. Then, click the Investigate with AI icon next to an application error.
Console Ninja will open a new Copilot Chat to ask the AI model to investigate the error. The AI model will analyze the provided error details. The AI will analyze the provided details and may request additional context - such as source code or logs - from Console Ninja as needed.
Finally, the investigation results will be displayed in the chat.
In addition to the hover tooltip icon, you can also use:
- The
Console Ninja: Investigate with AI command from the command palette
- The
Investigate with AI context action from the editor lightbulb menu
- The
Investigate with AI icon in the Log Viewer
How it works
The Console Ninja extension registers @console-ninja as a Copilot chat participant. When you click the Investigate with AI icon, Console Ninja automatically:
- Opens a new Copilot Chat with
@console-ninja
- Uses the selected AI model (when possible)
- Provides the model with necessary context and a description of Console Ninja’s tools for error investigation
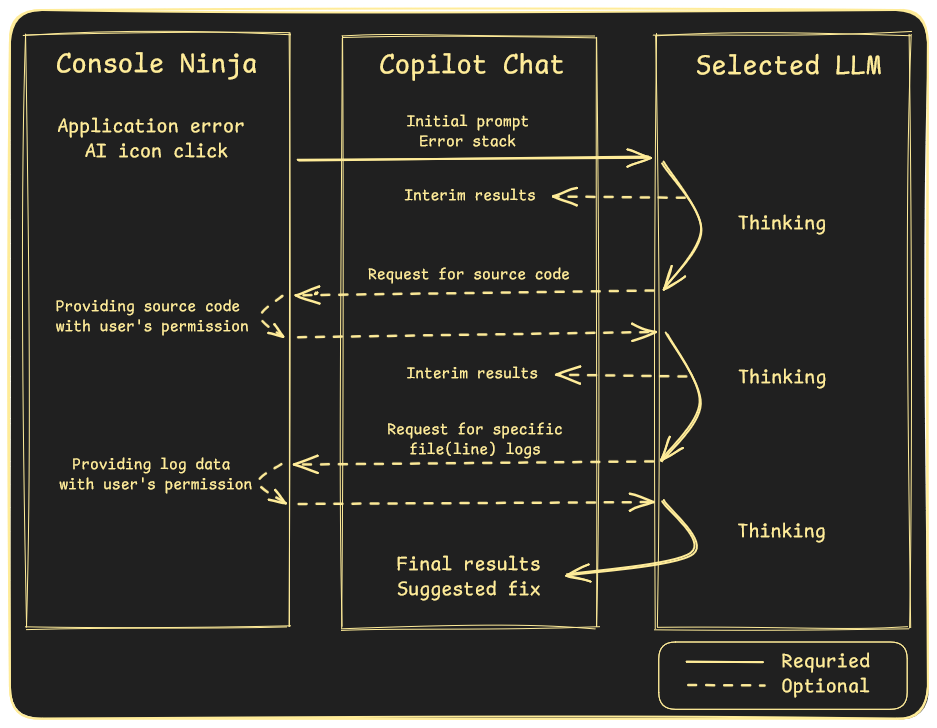
The initial chat message includes:
- Error details (message and stack trace)
- Relevant log locations
- Instructions for the AI model on how to process the request, including what additional context it can request from Console Ninja
The AI model can analyze the error details and request additional context (e.g., source code, logs) from Console Ninja. By default, Console Ninja prompts you to allow AI access to the requested context, but you can configure it to provide the context automatically.
Once the model has all necessary information, it delivers the investigation results in the chat.
Security and privacy considerations
Before first use, VS Code will prompt you to allow Console Ninja to access Copilot models.
When investigating an error, Console Ninja provides the AI model with necessary context, including:
- Error message
- Stack trace, which may contain:
- Absolute file paths or URLs
- Line and column numbers
- Function or variable names
- A single line of code for each stack entry
- Log locations, which may include:
- Absolute file paths
- Line numbers
- Variable names
After the initial request, the AI model may request additional context (e.g., source code, logs) from Console Ninja. By default, Console Ninja prompts you before granting access, showing a detailed description of what is being accessed.
Tips and tricks
If you attempt to use a model for the first time with Console Ninja, you may receive an error from Copilot indicating that the model is unavailable. In this case, try using the model in a separate chat first (e.g., send a simple "Hello" message), agree to any prompts from Copilot, and then retry with Console Ninja.
The opened chat can be used after the initial response to continue to ask the LLM for more investigation, to use Console Ninja tools, explain results, correct the response, etc. For example, if you see that the AI model has not used the application logs for the investigation of the error, you can ask it to do so:
@console-ninja check logs for src/file.ts@console-ninja check logs for src/file.ts at line 10
If you are using the Copilot free tier, please note that because Console Ninja integration sends chat messages, limits may apply. Console Ninja only sends chat messages when you request, and you may review the number of messages sent by Console Ninja on the extension page in VS Code.
If you see that the AI model is not using the provided context effectively, or is outputting errors (such as
Tool multi_tool_use.parallel was not contributed) or strange results, you may try to re-run the chat with the same or a different AI model.
MCP Server
NOTE: ✅ Console Ninja tools are already available in Copilot Agent mode, no additional setup is required.
You may still add Console Ninja MCP server if you want to use the same tools outside of Copilot Agent mode, for example in other MCP clients.
Console Ninja comes with a built-in MCP server that allows your editor LLM agent (Copilot, Cursor, Windsurf, Cline, Roo Code, etc.) to access your app runtime logs and errors. This includes the ability to access browser and server logs and errors for full stack applications.
You may find instructions on how to add Console Ninja MCP server to your editor LLM agent below. Alternatively, you can use Console Ninja: Open MCP settings command from the command palette to view the instructions in the editor.
Copilot Agent
To add Console Ninja MCP server to Copilot for all projects, modify your VS Code settings.json file to add the following entry:
MacOS/Linux:
{
  ...
  "mcp": {
    "servers": {
      "console-ninja": {
        "command": "npx",
        "args": ["-y", "-c", "node ~/.console-ninja/mcp/"]
      }
    }
  }
}
Windows
{
  ...
  "mcp": {
    "servers": {
      "console-ninja": {
        "command": "cmd.exe",
        "args": ["/c", "node", "%USERPROFILE%/.console-ninja/mcp/"]
      }
    }
  }
}
To add Console Ninja MCP server to Copilot for a specific project, modify the .vscode/mcp.json file in the project's folder to add the following entry:
MacOS/Linux:
{
  "servers": {
    "console-ninja": {
      "command": "npx",
      "args": ["-y", "-c", "node ~/.console-ninja/mcp/"]
    }
  }
}
Windows
{
  "servers": {
    "console-ninja": {
      "command": "npx",
      "args": ["/c", "node", "%USERPROFILE%/.console-ninja/mcp/"]
    }
  }
}
Cursor
To add Console Ninja MCP server to Cursor for all projects, modify the ~/.cursor/mcp.json file in your home directory to add the following entry:
{
  "mcpServers": {
    "console-ninja": {
      "command": "node",
      "args": ["~/.console-ninja/mcp/"]
    }
  }
}
To add Console Ninja MCP server to Cursor for a specific project, modify the .cursor/mcp.json file in the project to add the following entry:
{
  "mcpServers": {
    "console-ninja": {
      "command": "node",
      "args": ["~/.console-ninja/mcp/"]
    }
  }
}
Troubleshooting Cursor MCP server
If the Console Ninja MCP server isn’t working with Cursor, please do the following: 1. Open the MCP Tools section in Cursor Settings and check if the Console Ninja MCP server is listed and has a green icon next to it. 2. If the icon isn’t green, open the Output → MCP Logs output channel in Cursor’s bottom panel, clear the logs, toggle the MCP server, and check for any errors in the output.
Note: If you’re using Cursor with WSL and the MCP server doesn’t start, you may need to set the full path to your WSL Node.js executable in the MCP server configuration, instead of just using node command.
Claude Code
To add Console Ninja MCP server to Claude Code, run the following command in the terminal:
claude mcp add console-ninja -s project -- npx "-y" "-c" "node ~/.console-ninja/mcp"
If after adding the MCP server as described above you are getting the Connection failed: spawn node error, then it's possible that Claude Code MCP client can not resolve your node version. In this case try replacing node with the full path to node executable in your system, for example:
claude mcp add console-ninja -s project -- npx "-y" "-c" "/full/path/to/node ~/.console-ninja/mcp"
Windsurf
To add Console Ninja MCP server to Windsurf run Windsurf: MCP Configuration Panel command from the command palette and click on the Add custom server button. Modify the
opened file to add the following entry:
MacOS/Linux:
{
  "mcpServers": {
    "console-ninja": {
      "command": "npx",
      "args": ["-y", "-c", "node ~/.console-ninja/mcp/"]
    }
  }
}
Windows
{
  "mcpServers": {
    "console-ninja": {
      "command": "cmd.exe",
      "args": ["/c", "node", "%USERPROFILE%/.console-ninja/mcp/"]
    }
  }
}
After saving the file, click on the MCP icon next to the chat input field and click on the Refresh button.
Cline
To add Console Ninja MCP server to Cline, open Cline view with the Cline: Focus on View command, click on the MCP Servers icon, switch to the Installed tab, and click on the Configure MCP Servers button. Modify the opened file to add the following entry:
MacOS/Linux:
{
  "mcpServers": {
    "console-ninja": {
      "command": "npx",
      "args": ["-y", "-c", "node ~/.console-ninja/mcp/"]
    }
  }
}
Windows
{
  "mcpServers": {
    "console-ninja": {
      "command": "cmd.exe",
      "args": ["/c", "node", "%USERPROFILE%/.console-ninja/mcp/"]
    }
  }
}
Roo Code
To add Console Ninja MCP server to Roo Code, open Roo Code view, click on the MCP Servers icon, and click on the Edit MCP Settings button. Modify the opened file to add the following entry:
MacOS/Linux:
{
  "mcpServers": {
    "console-ninja": {
      "command": "npx",
      "args": ["-y", "-c", "node ~/.console-ninja/mcp/"]
    }
  }
}
Windows
{
  "mcpServers": {
    "console-ninja": {
      "command": "cmd.exe",
      "args": ["/c", "node", "%USERPROFILE%/.console-ninja/mcp/"]
    }
  }
}
Other MCP clients
To add Console Ninja MCP server to an MCP client that supports the MCP protocol tools, you need to modify the MCP client configuration file to add the following entry:
MacOS/Linux:
{
  "mcpServers": {
    "console-ninja": {
      "command": "npx",
      "args": ["-y", "-c", "node ~/.console-ninja/mcp/"]
    }
  }
}
Windows
{
  "mcpServers": {
    "console-ninja": {
      "command": "cmd.exe",
      "args": ["/c", "node", "%USERPROFILE%/.console-ninja/mcp/"]
    }
  }
}
Interactive Value Graphs
The feature lets you visualize runtime data as structured graphs directly in your editor. It’s useful for inspecting deeply nested objects or large data sets that are hard to parse in raw text form. The graph layout adapts well to various data shapes, and you can interactively collapse or expand branches and nodes to focus on the parts that matter.

How to use
When you run your code, any complex runtime value (such as an object or array) can be visualized as a graph. A small graph icon appears when you hover over the value in the editor or access it via the context menu in the Log Viewer. Click the icon to open the graph view.
You can zoom in and out of the graph using the mouse wheel or panel icons. You can also pan the graph by clicking and dragging the graph area. Holding the Ctrl or Command key while using the mouse wheel will also scroll the graph.

Click the Fit View icon to automatically scale and center the entire graph to fit within the visible area. This is helpful after a lot of navigation or expansion, so you can quickly reorient yourself and see the overall shape of the data again.
Nodes and Edges
Each node of the displayed graph represents a value — an object or array. Properties of the object or elements of the array are displayed as a list inside the node. The name of the property or index of the array is displayed on the left, and the property value on the right. If the property value is an object or array with some properties, it will be represented as a child node in the graph connected by an edge.
Interactivity
The graph is interactive, allowing you to expand or collapse nodes to explore the structure of the value. You can collapse and expand values of properties by clicking on the property value.
Each node has a context menu, available via the vertical ellipses icon in the top right corner of a node. The menu displays the full path to the property node and allows you to copy the property path or the property value to the clipboard.
