Vxplain is a visualization tool for coding agents, it provides you ability to generate architecture diagrams, call graphs, flowcharts etc, so your team can understand any codebase in minutes. This powerful VS Code extension reduces onboarding time from weeks to minutes by automatically generating visual representations of your code architecture and logic flows.
🚀 Key Features
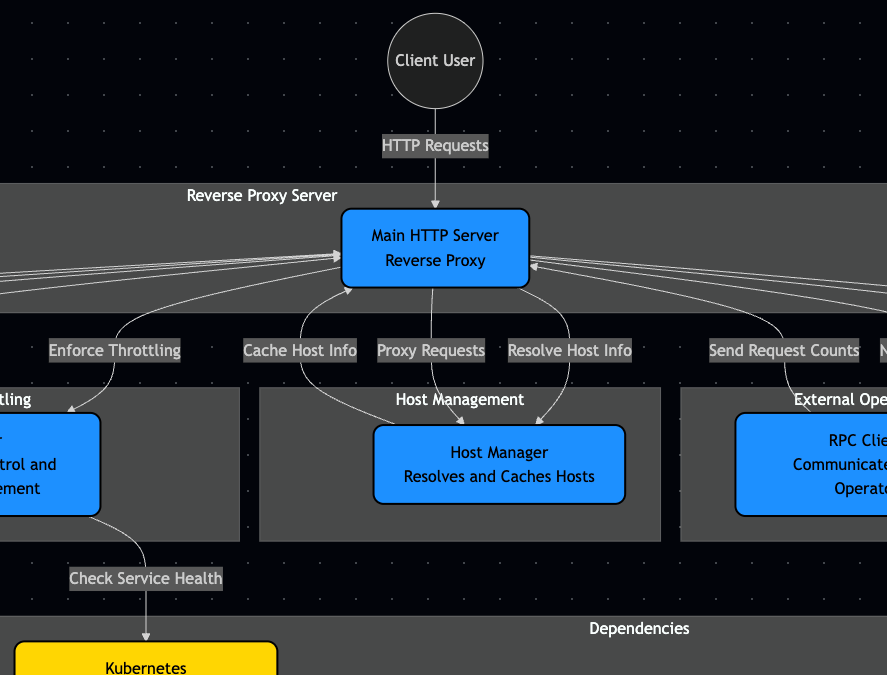
Architecture Diagrams
Create comprehensive high-level design diagrams that map out your entire system architecture. Generate diagrams for your entire project or specific folders to understand complex systems at a glance.
|

|

|
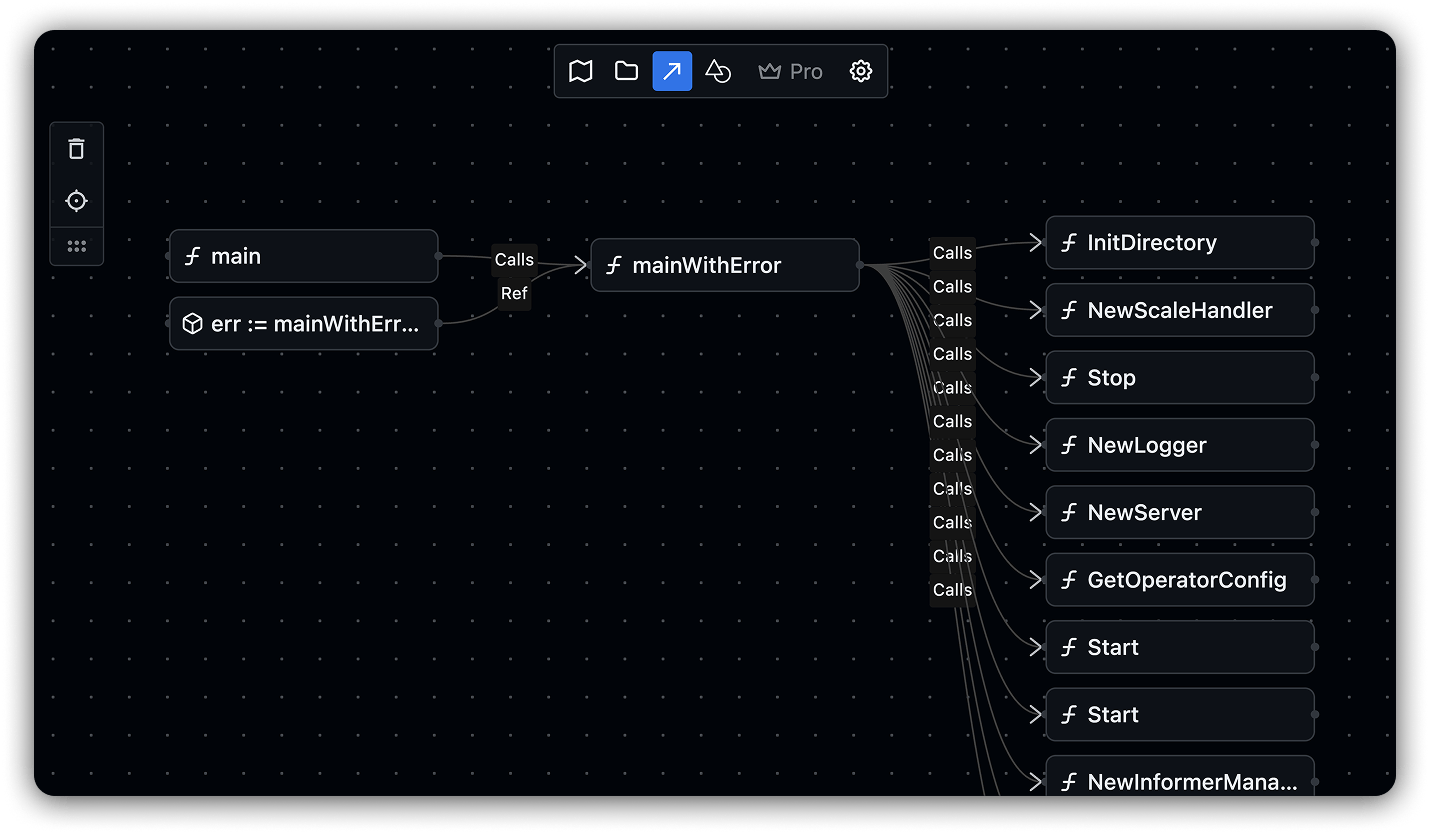
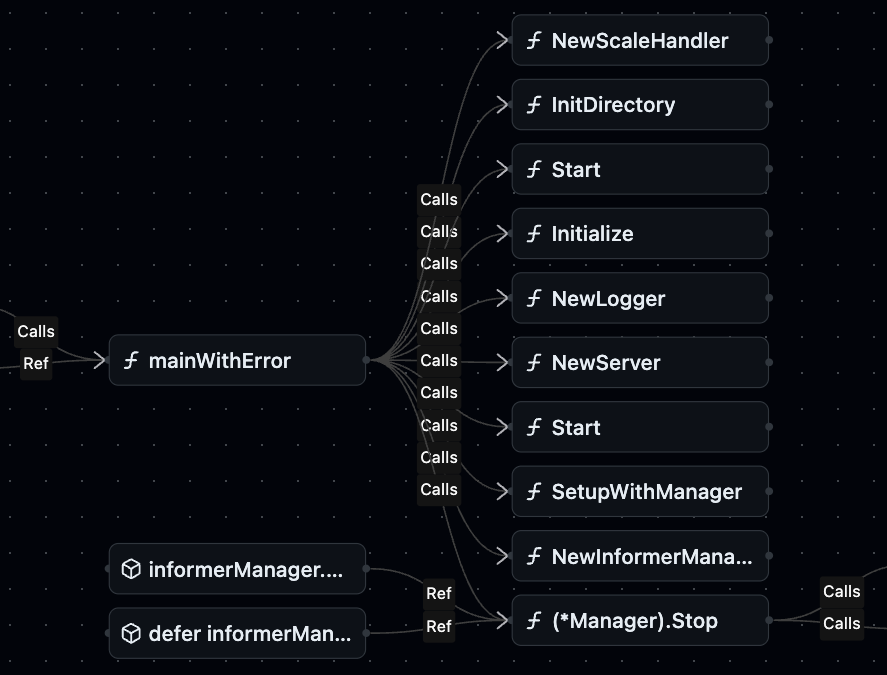
Interactive Call Graphs
Navigate complex codebases with interactive call graphs that show how functions, methods, and classes interact. Trace execution paths, identify dependencies, and understand data flow with intuitive visual representations.
|
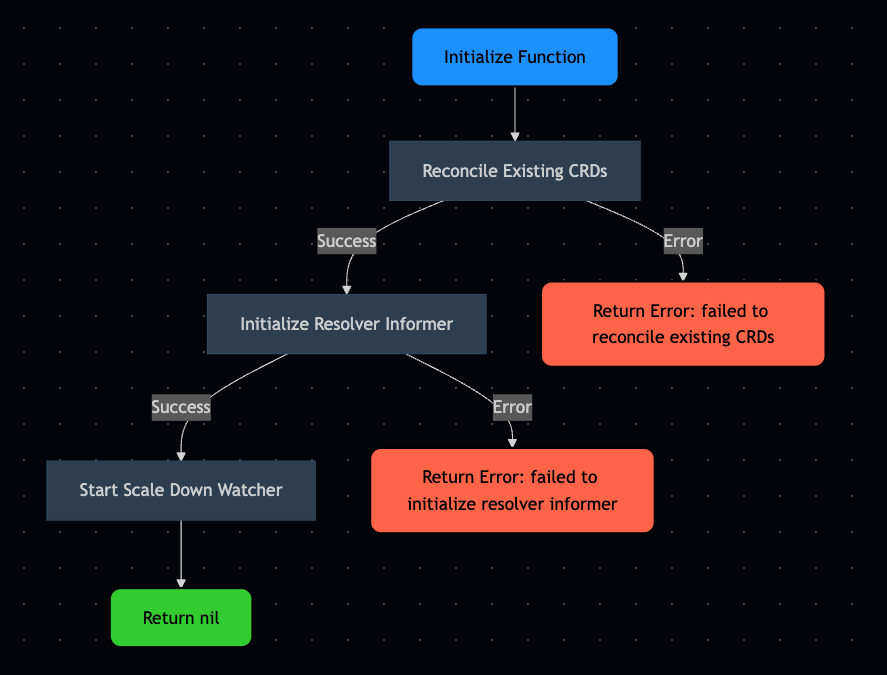
Code-to-Diagram Generation
Transform complex code snippets into clear flowcharts and diagrams. Perfect for understanding business logic, control flow, and algorithm implementation with instant visualizations.
|

|

|
Bring Your Own LLMs or Run Locally
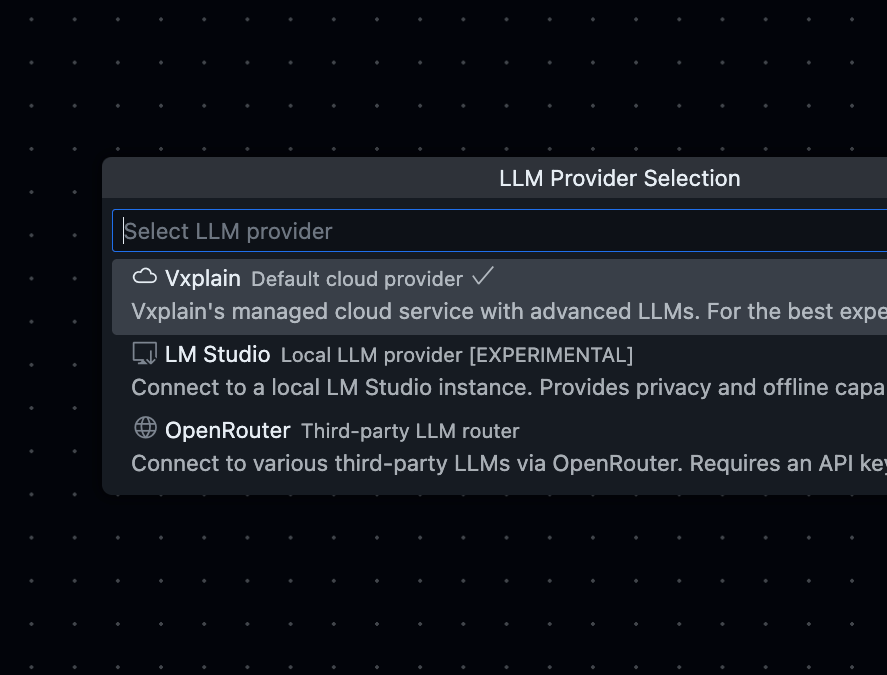
Integrate with your preferred LLM providers including OpenAI, Anthropic, local models, and custom endpoints. Maintain control over your data while leveraging the power of AI for code analysis.
|
Multi-level Summaries
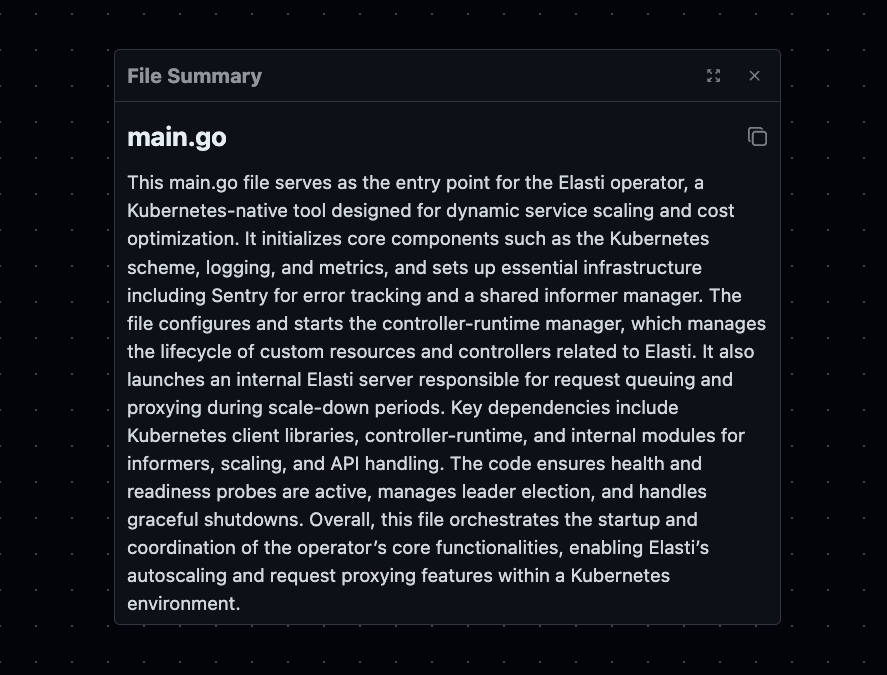
Get comprehensive summaries at multiple levels - from high-level architecture overviews to detailed function explanations. AI-generated human-readable documentation automatically.
|

|

|
Directory Tree Visualization
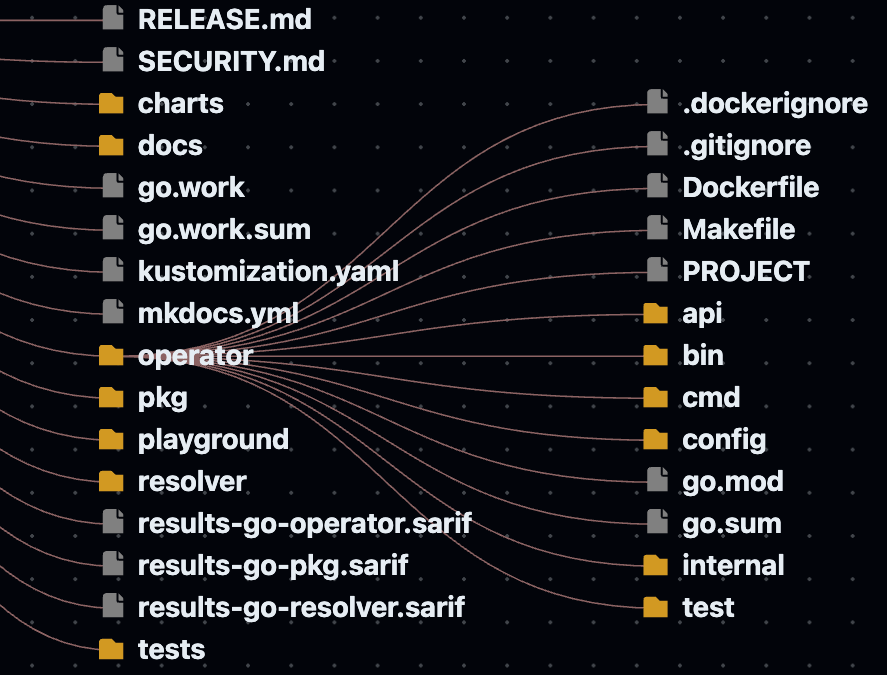
Get a bird's-eye view of your project structure with intelligent directory tree visualization. Quickly navigate large codebases, understand project organization, and open files directly from the tree.
|
And more coming soon...
- Chat Support: Request Sophisticated visual representations of specific components from your code.
- Dependency Analysis: Comprehensive visualization of module interdependencies.
🛠️ Use Cases
- Legacy Code Modernization: Quickly understand older codebases before implementing changes.
- Accelerated Onboarding: Help new team members understand complex systems in hours instead of weeks.
- Technical Knowledge Transfer: Streamline explanations during team transitions with visual references.
- Architecture Documentation: Generate visual artifacts that capture system design clearly and comprehensively.
- Code Reviews & Planning: Enhance technical discussions with clear representations of code structure.
💻 Commands
Vxplain: Generate DiagramVxplain: View Call GraphVxplain: Open Extension | Ctrl+Alt+v (Windows/Linux) or Cmd+Alt+v (Mac)Vxplain: Open Settings | Ctrl+Alt+s (Windows/Linux) or Cmd+Alt+s (Mac)Vxplain: Check for UpdatesVxplain: Select LLM Provider
You can access these commands via the command palette (Ctrl+Shift+P or Cmd+Shift+P).
⚙️ Configuration And Settings
You can modify these settings by pressing ⌘ + ⌥ + s or Ctrl + Alt + s.
Enable AI Features: Toggle AI features, so that you can use the extension without AI features. This will disable architecture diagrams, summaries, code-to-diagram generation. Default: trueEnable Analytics: Toggle analytics and crash data collection to help improve Vxplain. Default: trueEnable Auto Start: Toggle if the extension starts automatically when you open VS Code. Default: true
🔒 Privacy Notice
API Providers
OpenAI
- OpenAI has a 30-day retention policy.
- OpenAI doesn't use this data in training.
- We're working with OpenAI to implement a zero-day retention policy.
Anthropic
- Anthropic has a 0-day retention policy.
- Anthropic doesn't use this data in training.
Vxplain
- Your code is never stored on our servers.
- No code or file contents are ever included in the telemetry data.
- All diagrams and analysis are stored in your local storage only.
You can disable AI features or analytics in the settings.
If you have any questions about our Privacy Policy practices, please don't hesitate to reach out to us at raman@vxplain.com.
❓ FAQ
Can I disable AI features?
Yes, you can disable AI features. However, this will disable architecture diagrams, summaries, code-to-diagram generation. Only function call graph and directory tree visualization will work. If that's what you need, you can update Vxplain: Enable Ai Features to false in the settings.
If disabled, you won't need any active internet connection to use the extension. Everything happens locally.
What configuration options are available?
Right now, configuration options are limited. We are working on it.
We will bring support to exclude the files and folders from analysis, control depth of analysis, and more.
What usage data is collected? Can I disable it?
Yes, you can disable analytics. If you disable analytics, we will not collect any data at all. Which means, even the crash reports will not be collected and you will have to manually send them to us.
We collect usage data which is needed to improve vxplain experience, such as clicks, error logs, performance metrics, session replays and similar metrics. We never collect any source code, file contents, or any other sensitive data.
Will this be open source?
We are still in early stages of development and eventurally, either all or some parts of the code will be open source.
Transform how you understand code with Vxplain
Visit vxplain.com to learn more


