
OpenCode to VSCode BridgeVSCode addon for OpenCode AI agent. Editor state, command execution, file operations via HTTP/MCP bridge. Agent sees tabs, cursor, selection, edits with undo support. 75 MCP tools (27 base + 48 on-demand), slash commands (/vsc + per-pack /<id>_tools when a langpack is registered). Installation Launch VS Code Quick Open ( Ctrl+P), paste the following command, and press enter.Copied to clipboard |

OpenCode to VSCode Bridge
Author: Vlado Vrbanec — vlado.vrbanec@mvv.hr
FAST-START Do not read any further.
ℹ️ The concept is really powerful, however it is also complex. Discover the functionality layer by layer according to your own needs and expertise. Ask your agent for help : "Which tools do you have from VSCode Bridge toolset?" ℹ️ Please be aware that all tools described in this file are used by an agent, and none is intended to be used by the user. ℹ️ An intelligent agent does not need any of what is written here explained — it receives all information through the MCP bridge, and may occasionally just need to be reminded which tools you want it to use. For example, select some code in the editor and instruct in OpenCode "Use VSC select tool and check if selected code is correct". Or "Use VSC select tool and translate selected code to Italian". Purpose: Agent awareness of the user's visual working environment. The AI agent can see which tabs are open, cursor position, selection range, dirty (unsaved) state per file, and manipulate the editor directly. This lets the agent reason about what the user sees and work contextually within their editor. Works in terminal or GUI client applications. Also works with any VSCode sidebar extension, or HTTP connected application. Agent can call 27 base MCP tools + 23 debug + 13 LSP + 3 Decorate + 5 Sessions + 4 WebView tools (all except base loaded on demand, 75 unique) + slash commands (/vsc core + per-pack /_tools — only when the pack is registered). Works with up to 5 VSCode sessions (windows) simultaneously. Bridge is pure Node.js — likely works on macOS and Linux, but only tested on Windows. Terminal or TUI Electron app ?
Base MCP tools (always loaded — 27)
Debug MCP tools (loaded on demand via
|

| Capability | Tools |
|---|---|
| Session management | debug_configurations, debug_prerequisites, debug_build, debug_start, debug_stop |
| Execution control | debug_continue, debug_pause, debug_step_over, debug_step_into, debug_step_out |
| Breakpoints | debug_breakpoints (add/remove/list/listActive), debug_exceptions (first-chance/unhandled) |
| State inspection | debug_state, debug_overview, debug_session, debug_where, debug_thread_list, debug_callstack |
| Variables | debug_variables, debug_evaluate, debug_console_write, debug_set_variable |
| Output | debug_console (buffered, incremental), output_read, output_list |
Debug workflow
debug_prerequisites— check environment readiness (SDK, launch.json, project files)debug_build— build the project (uses tasks.json or falls back todotnet build)debug_start— start a debug session from launch.json config- Poll
debug_state(withcompact:true) untilstopped:true debug_where— see file, line, and source around the stop locationdebug_variables/debug_evaluate— inspect variables and expressionsdebug_continue/debug_step_over— advance execution, then poll again
ℹ️ After debug_continue or step commands, the agent polls debug_state until stopped:true — execution is asynchronous.
ℹ️ When debugging a GUI/EXE application, the agent cannot click buttons in the app window. It tells the user explicitly what to do, then polls for breakpoints or output.
ℹ️ To test just stop on debugger point and type to the agent "Play litle with debugger" or "Please check error opened in debugger".
Language Server Protocol (LSP)
The bridge exposes VSCode's Language Server infrastructure to the agent — semantic code analysis without running the program. The agent calls tool_topic("lsp") once to load the LSP tools.
| Capability | Tool | Description |
|---|---|---|
| Live diagnostics | lsp_diagnostics(file) |
Errors, warnings, hints from the Language Server for a file |
| Go to definition | lsp_definition(file, line, column) |
Where a symbol is declared |
| Go to type definition | lsp_type_definition(file, line, column) |
Where the type of a symbol is defined (interfaces, type aliases) |
| Go to implementation | lsp_implementation(file, line, column) |
Concrete implementations of an interface/abstract method |
| Find references | lsp_references(file, line, column) |
All usages of a symbol (AST-level, not text match) |
| Type info | lsp_hover(file, line, column) |
Type signature, documentation, parameters |
| Rename | lsp_rename(file, line, column, newName, dryRun?) |
Safe rename across the entire workspace. dryRun: true previews the edits without applying them |
| Document symbols | lsp_document_symbols(file) |
Hierarchical symbol tree (classes, functions, variables) |
| Workspace symbols | lsp_workspace_symbols(query) |
Search symbols across the entire workspace by name |
| Completions | lsp_completion(file, line, column) |
Autocomplete suggestions at a position |
| Code actions | lsp_code_actions(file, startLine, endLine) |
List quick fixes and refactorings for a range |
| Apply code action | lsp_apply_code_action(file, index, startLine, endLine) |
Apply a code action by index (undoable) |
| Call hierarchy | lsp_call_hierarchy(file, line, column, dir?) |
Incoming/outgoing callers and callees for a symbol |
ℹ️ LSP requires a VSCode extension for the language (TypeScript, C#, Python, etc.) — the bridge uses whatever Language Server is already active in VSCode.
ℹ️ lsp_diagnostics returns live errors from the Language Server — different from build/compile errors. Use it before debugging to catch type and syntax issues early.
Visual Decorations
The bridge lets the agent paint visual markers in the editor without changing file content. Unlike edit highlights (which auto-dismiss and are tied to edits), these decorations persist until explicitly cleared.
| Tool | What it does |
|---|---|
decorate_range(file, startLine, endLine, color?, tooltip?) |
Paint a colored background on a range of lines |
decorate_gutter(file, line, color?, tooltip?) |
Add a colored dot in the line-number gutter |
decorate_clear(file?) |
Remove all decorations from a file (omit file to clear all) |
Available colors: red, green, blue, yellow, purple, orange, cyan, pink, gray — or any CSS rgba/hsl/hex string.
ℹ️ The agent calls tool_topic("decorate") once to load these tools. Decorations persist once created and do NOT auto-dismiss (they survive tab switches), but creation requires the file to be visible — keep the target file active while decorating or call open(file) first.
WebView Panels
The bridge lets the agent open and control webview panels — HTML pages rendered in their own VSCode tab. This is how the agent presents results that are richer than plain chat text: rendered markdown, data tables, dashboards, charts, or any custom HTML UI.
| Tool | What it does |
|---|---|
webview_create(name, title?, viewColumn?, enableScripts?) |
Open a panel (reuses the existing panel with the same name). viewColumn: beside (default), active, or 1–10. |
webview_show(name, ...content) |
Set the panel content and reveal it. Accepts exactly one content source per call (see below). |
webview_clear(name?) |
Close a panel by name — omit name to close all panels. |
webview_list() |
List open panels (name, title, active status). |
Content formats
webview_show renders three kinds of content, so the agent does not have to build HTML by hand:
| Source | Example | Result |
|---|---|---|
html |
html="<h1>Hello</h1>" |
Raw HTML — passed through unmodified |
markdown |
markdown="# Title\n\n- item" |
Rendered to VSCode-theme styled HTML (headings, bold/italic, code blocks, lists, blockquote, links) |
json (+ optional tableColumns) |
json=[{a:1},{a:2}] |
Rendered as an HTML table; tableColumns=[{key,label,width}] orders, names and widths the columns (default: derived from row keys) |
Example — show build results as a table:
webview_show(name="build", json=[{file:"a.ts", errors:0}, {file:"b.ts", errors:2}], tableColumns=[{key:"file",label:"File"},{key:"errors",label:"Errors"}])
ℹ️ The agent calls tool_topic("webview") once to load these tools. Panels persist until closed explicitly (webview_clear) or VSCode shuts down.
ℹ️ To test, instruct your agent "Please write a nice message in the VSC WebView for my darling Suzana".
Slash commands (from version 0.0.3)
User-facing shortcuts. Type /vsc in the OpenCode chat to run an editor-aware task. No configuration needed.
| Command | What it does |
|---|
| /vsc | Signal the agent that the rest of the conversation relates to working with the VSCode editor |
ℹ️ Additionally installed extensions with extra functionality may add their own slash commands.
Quick Install
ℹ️ If not installed from VSCode side panel:
Install from marketplace.
OpenCode to VSCode Bridge — VS Code Marketplace
OpenCode plugin setup (required)
The OpenCode plugin is automatically installed when you start the VSCode extension.
⚡ If OPENCODE is installed after extension, please reinstall VSCode extension.
Usage
When component is installed, start or restart opencode.
The plugin automatically connects to the VSCode bridge when you open a workspace folder.
Ask the agent a few questions:
ℹ️ Doesn't need to be exact, agent will understand the context.
⚡ If agent is not aware of available tools, execute /vsc command to set editor context.
ℹ️ Instructions to the agent can be in any language, not just English; however, the agent will pick up context at the beginning of the session in English faster.
Agent will probably 'think' in English but will understand your language, and answer in your language.
⚡ If the agent doesn't immediately respond to editor context, start with "vsc" — it's a trigger word that anchors the conversation to the editor.
- Which file is opened in editor?
- What is the current cursor position?
- What is the current line number?
- What is the current column number?
- What is the selected text?
- Check current editor selection for errors.
- Please debug file opened in editor.
- ... and other questions
When the AI agent knows the context, we can ask without specifying the file name:
- Check selected file for errors.
- Insert "This text" at cursor position.
- Why my code fail on current editor line ?
- Please create comment for function MyExampleFunction.
- Please check selected lines for errors.
- Translate selected text to Italian
And other instructions in natural language.
Agent will automatically try to obey instructions. With time you will learn which instructions are more clear to the agent.
⚡If VSCode extension is not active, or used folder is not the same, agent will respond with an predefined error message.
Status Bar
The extension adds a status bar indicator at the bottom-right of VSCode:  Mouse over icon will display info about last Opencode connection: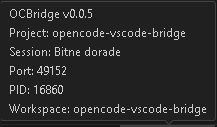
| Indicator | Meaning |
|---|---|
$(broadcast) OCB |
Bridge starting (no port yet) |
$(broadcast) OCB: <port> |
Bridge active, listening on port |
$(check) OCB: <port> |
Bridge active, connected to Opencode session |
$(error) OCB |
Bridge failed to start |
Click on the status bar item to open the Actions Menu:
| Action | What it does |
|---|---|
$(terminal) Open Terminal |
Creates integrated terminal in workspace folder and runs opencode |
$(lines) Clear all highlights |
When lines are changed or inserted by agent via tool line is highlighted. |
| Highlight can be cleared one by one or all with this menu option. | |
$(gear) Reset Settings to Defaults |
Restore default timeout and highlight values. |
$(info) About |
Opens extension README |
Inline Coding Assistant
Press a key combination directly in the editor to generate or edit code right where the cursor is. The bridge supports three modes, chosen per keypress — no settings to flip when you want a different level of power:
| Key | Mode | What happens |
|---|---|---|
Alt+U |
Native — suggestion only | Runs through OpenCode in a throwaway session created in a neutral sandbox folder, with no bridge tools. It only returns text: the result appears as ghost text that you accept with Tab or reject with Esc. The session is deleted right after, so nothing is left behind. |
Alt+I |
Smart — one-shot agent | Full LAKI agent with all bridge tools — it edits the file itself. Starts a new OpenCode session on every press and deletes it after execution (it is kept for inspection when opencodeBridge.developmentMode is continue or abort). |
Alt+O |
Supersmart — ongoing agent | Same agent and same tools, but reuses the per-file session, so you can keep refining one task across presses ("now also add a null check"). The session is never deleted and is visible in your OpenCode clients. |
Which mode should you press?
- You just want the code →
Alt+U. It never edits anything by itself. - One self-contained job ("fix this function", "add validation") →
Alt+I. Clean slate every time, nothing accumulates. - Iterating on something bigger →
Alt+O. The conversation continues, so follow-ups work without repeating the context.
Alt+I and Alt+O never share a session: Alt+I always starts fresh, Alt+O always continues its own per-file session.
Context per mode
| Mode | What the model sees | Approx. input tokens |
|---|---|---|
| Native | Code fragment around cursor/selection + OpenCode's own system prompt (+ optional INLINENATIVE.md) |
~10k |
| Smart | Project instructions (AGENTS.md and friends) + code fragment + tool definitions |
~10k–15k |
| Supersmart | Everything smart sees + everything the ongoing session has already exchanged | grows with each turn |
Native and smart cost roughly the same per press — native is cheaper in behaviour, not in tokens: no tools, no history, no project instructions, which is also why it answers fastest. Supersmart grows as its session grows, and its project rules (AGENTS.md) are always in play.
While the model is working, the source lines under the cursor/selection are highlighted with a thinking decoration (animated green box) instead of any text being inserted into the document.
The result arrives as gray/italic ghost text with a hover box in native mode (✓ Accept / ✗ Reject, Tab = Accept, Esc = Reject). If the agent produced reasoning, a 💭 View agent reasoning link appears in the hover — click it to open a side panel with the full reasoning trace.
ℹ️ Smart and supersmart sessions are shared with your OpenCode applications (terminal and GUI client) — you can see them in the app's session list, and they consume the same resources. Native uses a throwaway session that is deleted immediately, so it never shows up anywhere.
The three commands are also available from the Command Palette:
OpenCode Bridge: Inline Native (Alt+U), OpenCode Bridge: Inline Smart (Alt+I), OpenCode Bridge: Inline Supersmart (Alt+O). Keybindings can be customized in Keyboard Shortcuts (Ctrl+K Ctrl+S).
Native mode notes
- Native mode goes through OpenCode, so it uses your OpenCode model and credentials.
opencodeBridge.inlineProviderUrl/inlineApiKeyare only a fallback for setups where the bridge cannot reach an OpenCode server at all. - For debugging the exact request/response, set
opencodeBridge.logModeto developer — a full dump (endpoint, model, masked key, status, latency, raw body) is written to a debug log file. INLINENATIVE.md— optional per-project file in your workspace root. It is the only project context native mode (Alt+U) gets: the project'sAGENTS.mdand other instruction files are deliberately left out to keep the call small and fast, so this file is where you tell native mode about the project — e.g.This project is a JavaScript application. Conclude source type from source or file extension.Smart and supersmart already load the project instructions on their own.
Configuration
Settings are available in VSCode Settings UI (Ctrl+, → search "OpenCode Bridge") or settings.json.
| Setting | Default | Description |
|---|---|---|
opencodeBridge.highlightSafetyMs |
600000 (10 min) |
Auto-dismiss edit highlights after this many ms. Default is almost always functional — lower only if you want highlights to disappear faster. |
opencodeBridge.httpTimeoutMs |
15000 (15 s) |
HTTP request timeout for bridge calls. Covers operations of unknown duration (some run 100 s+) — increase further if needed. |
opencodeBridge.scanTimeoutMs |
3000 (3 s) |
Timeout for automatically locating the VSCode bridge. Default is almost always functional — increase only if the connection is unreliable on slow machines. |
opencodeBridge.lspTimeoutMs |
15000 (15 s) |
Separate, higher HTTP timeout for LSP tool calls (hover, rename, diagnostics, references, ...). The Language Server can be slow on cold start / large index (e.g. JDT on a big Java tree) — raise this if LSP tools report "Request timed out". |
opencodeBridge.inlineEnabled |
true |
Enable or disable the inline coding assistant (Alt+U / Alt+I / Alt+O). |
opencodeBridge.inlinePort |
(local port) | Local port used by the inline assistant. Change only on port conflicts. |
opencodeBridge.logMode |
production |
developer writes a full native-mode request/response dump to a debug log file. |
opencodeBridge.developmentMode |
off |
Dev tool for tuning prompt profiles. off = normal flow, no dump. continue = dump the fully-assembled instruction into a WebView panel and continue with execution. abort = dump the instruction and abort the LLM execution, returning "WebView written". |
opencodeBridge.inlineProviderUrl |
(empty) | Direct LLM provider URL — fallback only, used when the bridge cannot reach an OpenCode server. Empty = native mode goes through OpenCode. |
opencodeBridge.inlineModel |
(empty) | Model for inline coding. Empty = OpenCode's default model. |
opencodeBridge.inlineApiKey |
(empty) | API key for the direct provider fallback. Empty = native mode uses your OpenCode credentials. |
opencodeBridge.smartTimeoutMs |
120000 (2 min) |
Timeout for smart (Alt+I) / supersmart (Alt+O) agent runs — how long the extension waits before clearing the thinking decoration. |
opencodeBridge.inlineResult |
#999999 |
Color of the inline AI suggestion ghost text (native mode, Alt+U) before accept/reject. |
opencodeBridge.lakiCommands |
1 primjer (TODO) |
LAKI command map {key: value} — default sadrži samo jedan primjer (TODO); dodaj ključeve koje stvarno koristiš. //LAKI: <key> (or /*LAKI: <key>) in a line or selection is expanded in the prompt context to the value. A completion provider offers your keys on Ctrl+Space inside comments (auto-popup on / and :). |
To reset all settings to defaults: open the Actions Menu (click the status bar item) and choose Reset Settings to Defaults, or run command OpenCode Bridge: Reset Settings to Defaults from the Command Palette.
Changes take effect on the next OpenCode session.
Notes
- Each OpenCode instance automatically pairs with VSCode running in the same workspace.