Time Travel Debug for Go
Technical Preview: Time travel debugging for Go applications using Undo's Delve fork.
Overview
Undo.go adds time travel debugging capabilities to VS Code for Go programs. It works alongside the standard Go extension, adding the ability to:
- Step backwards through program execution
- Replay recordings captured with Undo's tooling
- Set bookmarks at points of interest and jump between them
- Navigate to start/end of the recording instantly
- Find last write to any variable and trace its history
- Rewind to line - right-click any line number to reverse execution to that point
Requirements
- Undo Suite - Time travel debugging requires Undo's LiveRecorder and UDB. A free evaluation is available.
- Linux host for recording and replay - Undo's time travel technology runs on Linux (x86, x86_64, and ARM64). You can connect to a Linux host from VS Code on any platform using Remote - SSH or similar.
- VS Code 1.78.0+
- Go extension (
golang.go) - Installed automatically as a dependency
Getting Started
1. Create a Recording
Use Undo's LiveRecorder to capture a recording of your Go program:
live-record ./myprogram
This creates a .undo recording directory that captures the entire program execution. See the LiveRecorder documentation for details on recording options.
2. Load the Recording
Add a launch configuration to .vscode/launch.json:
{
  "version": "0.2.0",
  "configurations": [
    {
      "name": "Go - Replay Recording",
      "type": "go-undo",
      "recording": "${command:undo-go.pickRecording}"
    }
  ]
}
Press F5 to start debugging — a file picker will let you select the recording. Use the reverse debugging controls in the toolbar to step backwards through execution.
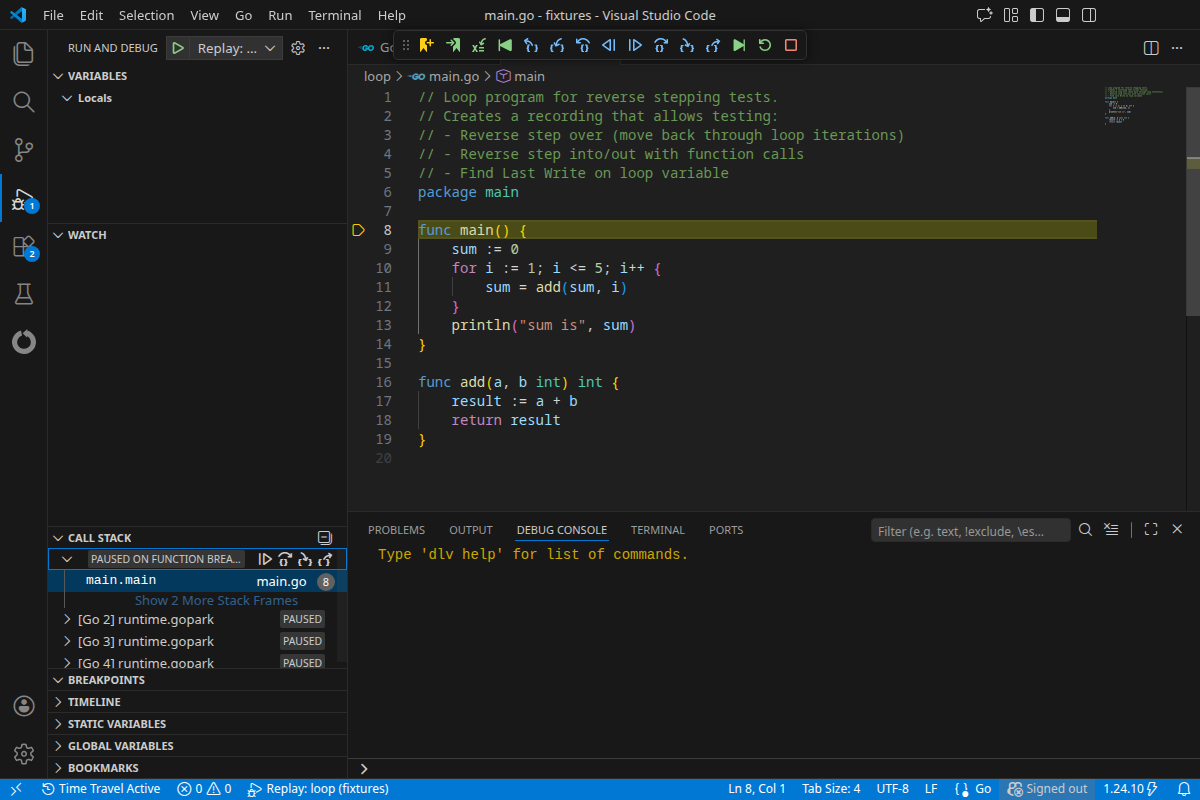
Features
Debugging with Time Travel
You can also debug programs live with time travel enabled:
{
  "name": "Debug with Time Travel (Undo)",
  "type": "go-undo",
  "request": "launch",
  "mode": "debug",
  "program": "${workspaceFolder}"
}
Status Bar
 |
When a time travel session is active, the status bar shows "Time Travel Active" to indicate reverse debugging is available. |
The debug toolbar shows additional controls during time travel sessions:

| Icon |
Action |
Keyboard Shortcut |
 |
Set Bookmark - Mark current position |
|
 |
Go to Bookmark - Jump to a saved bookmark |
|
 |
Find Last Write - Find where a variable was last modified |
|
 |
Go to Start - Jump to beginning of recording |
Ctrl+Shift+F5 |
 |
Reverse Step Out - Step backwards out of current function |
Ctrl+Shift+F11 |
 |
Reverse Step Into - Step backwards into function calls |
Ctrl+F11 |
 |
Reverse Step Over - Step backwards over function calls |
Ctrl+F10 |
 |
Reverse Continue - Run backwards to previous breakpoint |
Ctrl+F5 |
 |
Continue - Run forwards to next breakpoint |
F5 |
 |
Step Over - Step forwards over function calls |
F10 |
 |
Step Into - Step forwards into function calls |
F11 |
 |
Step Out - Step forwards out of current function |
Shift+F11 |
 |
Go to End - Jump to end of recording |
Ctrl+Shift+F6 |
 |
Restart - Restart the debug session |
Ctrl+Shift+F5 |
 |
Stop - End the debug session |
Shift+F5 |
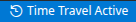
Bookmarks
 |
Bookmarks let you mark interesting points in the recorded execution history and instantly jump back to them. This is useful for comparing program state at different points, or for quickly returning to a location you want to investigate further.
- Click a bookmark to jump to that point in the recording
- Hover over a bookmark to reveal the delete icon
- Bookmarks persist across debug sessions for the same recording
|
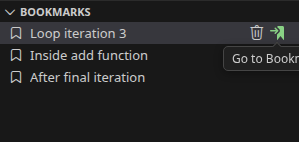
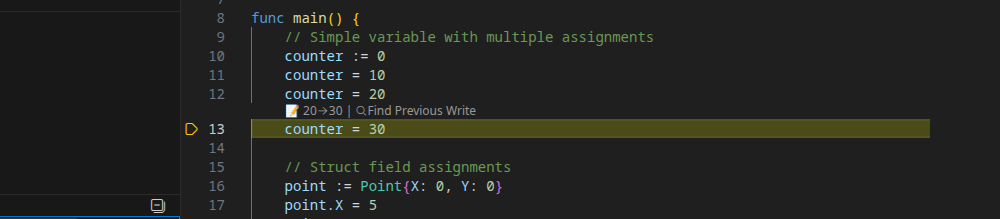
Find Last Write
Instantly find where a variable's value was last changed. This is invaluable for tracking down bugs where a value becomes unexpectedly wrong.
How to use:
- Right-click a variable in the Variables panel and select "Find Last Write"
- Right-click a watch expression in the Watch panel
- Select text in the editor and right-click to find last write
- Click the Find Last Write button in the debug toolbar and enter an expression
What happens:
- The debugger moves backwards in time to the exact line that last modified the variable
- A CodeLens appears above the assignment showing the value transition (e.g.,
20→30)
- Click "Find Previous Write" in the CodeLens to chain backwards through the assignment history
|
 |
Supported expressions:
- Simple variables:
counter, total
- Struct fields:
user.Name, config.Timeout
- Array elements:
items[0], buffer[i]
- Pointer dereferences:
*ptr, node.Next
Rewind to Line
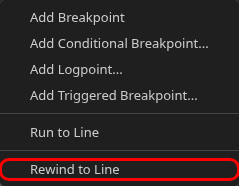 |
Quickly reverse execution to any earlier line without manually setting breakpoints.
Right-click on a line number in the editor gutter during a debug session and select "Rewind to Line". The debugger will execute backwards until it reaches that line.
Behavior:
- If the line was previously executed, execution stops at the point when that line was last reached
- If a user breakpoint is encountered first, a warning message is shown and execution stops at the breakpoint
- If the line was never executed earlier in the recording, an error message is shown
|
This is the reverse equivalent of "Run to Line", allowing you to quickly navigate backwards to any point in your code's execution history.
Configuration
Extension Settings
| Setting |
Description |
Default |
undo-go.delvePath |
Path to Undo's Delve binary. If empty, uses auto-installed version. |
"" |
undo-go.undoSuitePath |
Path to Undo Suite installation directory (containing udb and live-record). Required if the Undo tools are not on PATH. |
"" |
undo-go.showStatusBarItem |
Show time travel status in status bar |
true |
undo-go.enableDapLogging |
Enable DAP message logging for troubleshooting |
false |
undo-go.toolsManagement.autoInstall |
Automatically install Undo's Delve if not found |
true |
undo-go.toolsManagement.alwaysReinstall |
Always reinstall Delve on debug session start (useful for development) |
false |
Launch Configuration Options
| Property |
Description |
Required |
mode |
Debug mode: replay, debug, test, or exec |
Yes |
recording |
Path to .undo recording directory |
For replay mode |
program |
Path to program to debug |
For debug/test/exec modes |
args |
Arguments to pass to the program |
No |
cwd |
Working directory |
No |
env |
Environment variables |
No |
Troubleshooting
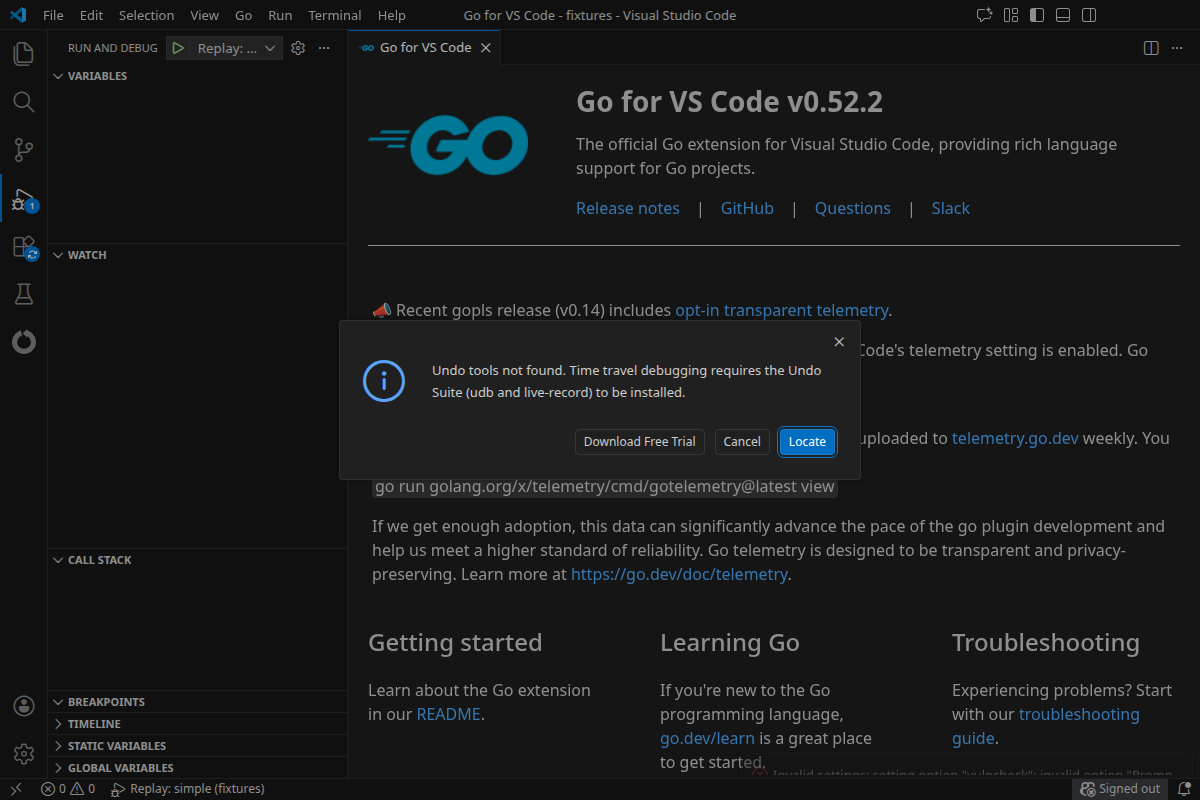
If you see this dialog when starting a debug session, the extension cannot find udb and live-record from the Undo Suite:
Download the Undo Suite - If you haven't installed it yet, click "Download Free Trial" in the prompt or visit undo.io/udb-free-trial
Locate existing installation - If you have the Undo Suite installed but not on PATH, click "Locate" and browse to the installation directory (e.g., ~/Downloads/Undo-Suite-Corporate-Multiarch-X.Y.Z)
Configure the path manually - Set undo-go.undoSuitePath in VS Code settings to point to your Undo Suite installation directory
Delve installation issues
Undo's Delve fork is automatically installed when you first start a debug session. If installation fails:
- Check the "Undo.go" output channel for error details
- Ensure you have Go installed and
go install works
- Try reinstalling with the "Time Travel Debug: Reinstall Delve" command from the Command Palette
Using a pre-installed Delve binary
If you want to use your own installation of Undo's Delve instead of the auto-installed version:
- Install Undo's Delve fork:
go install github.com/undoio/delve/cmd/dlv@v1.26.0-undo-vscode
- Set
undo-go.delvePath to point to the binary (e.g., ~/go/bin/dlv)
You can also disable automatic installation by setting undo-go.toolsManagement.autoInstall to false.
Reverse commands not working
- Verify you're using Undo's Delve fork (standard Delve doesn't support Undo's time travel)
- Check the "Undo.go" output channel for error messages
- Enable
undo-go.enableDapLogging to see DAP communication
Extension not activating
The extension only activates for go-undo debug configurations. Ensure your launch.json uses "type": "go-undo".
Standard Go debugging
For regular Go debugging without time travel, use the standard Go extension with "type": "go". This extension only handles time travel sessions.
Output Channel
Debug information is logged to the "Undo.go" output channel (View > Output, select "Undo.go" from the dropdown).
Feedback and Issues
For support, contact: support@undo.io
Acknowledgements
Contains artwork derived from Visual Studio Code - Codicons, licensed under the Creative Commons Attribution 4.0 International Public License.