Scene Breakpoints
Lightweight scenario-driven breakpoint orchestrator for code reading, execution tracing, and AI Agent workflows



English | 简体中文
🏷️ Highlights: Breakpoint Management · Scenario Debugging · AI Agent Collaboration · Self-Healing Anti-Drift · Living Code Tour
One-line summary: Turn scattered temporary breakpoints into reusable, shareable, and self-healing debugging assets.
💡 Why This Extension?
Every developer debugging in VS Code runs into these frustrations:
- Too many leftover breakpoints interrupting your flow: You have dozens of breakpoints scattered from previous debugging sessions. Starting a new task pauses execution every two seconds.
- Complex call chains are easily forgotten: You spend hours tracing a multi-file execution path, but forget key steps weeks later. Onboarding teammates face the same steep curve.
- Pulling git or editing code breaks your breakpoints: Whenever lines shift, your saved breakpoints end up on empty lines or comments; (the most common cause of breakpoint invalidation in collaborative Git workflows).
- Impossible to share or sync across computers: Native breakpoints vanish when you switch laptops, and sharing a debug setup with teammates means manually typing out file paths and line numbers.
- AI understands your code, but can't set breakpoints for you directly: When asking an AI assistant to analyze a bug or trace a flow, it can suggest key functions in chat, but you still have to manually find the files and click line numbers one by one.
Scene Breakpoints is your breakpoint organizer & execution tour guide: group breakpoints by feature with descriptive notes, switch them in seconds, and share them via Git. It also supports one-click AI Agent scenario generation and activation—simply tell your AI in natural language, and let it orchestrate breakpoints directly in your editor.
✨ What Can It Do For You?
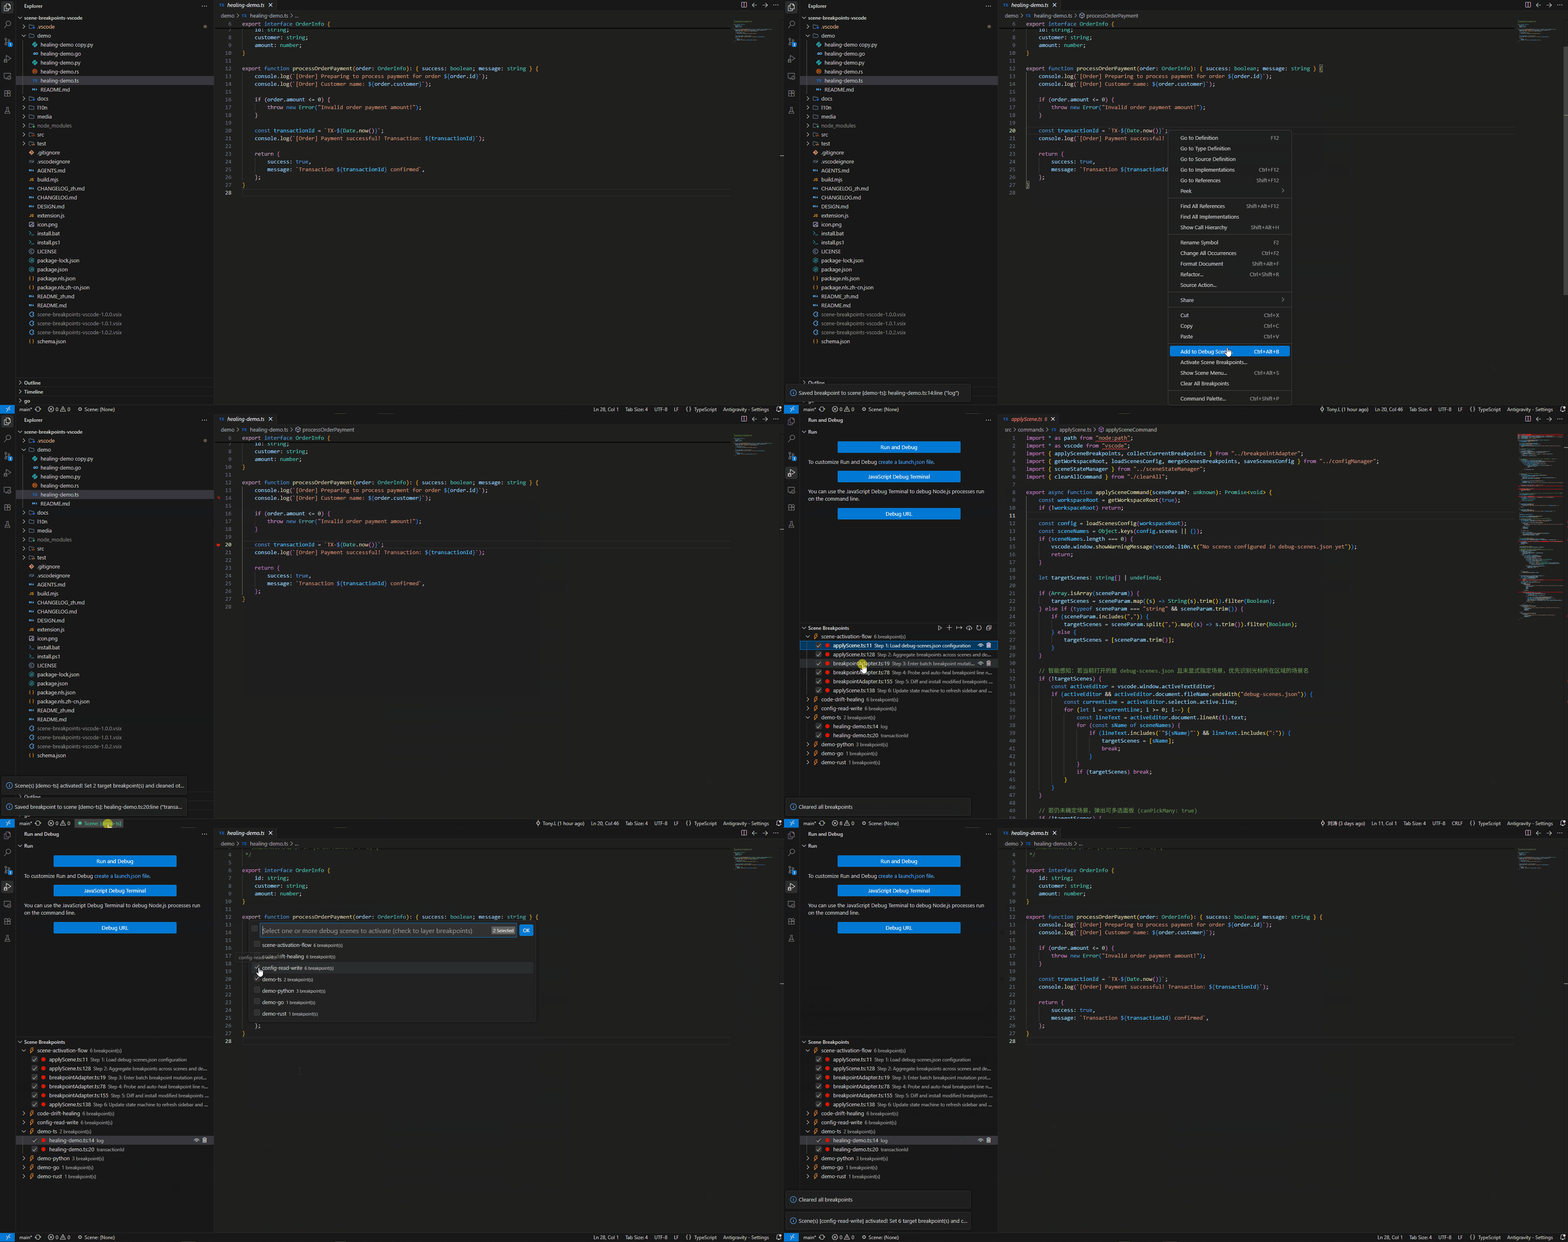
🗺️ Document Execution Flows into Living Code Tours
Attach clear notes to each breakpoint (e.g. Step 1: Auth Guard, Step 2: Decrement Inventory). A scene becomes a self-guided walkthrough for complex codebases.
🎯 Switch Scenarios, Keep Only What You Need
Switching to "Login" only enables breakpoints for login. All unrelated breakpoints are cleanly cleared so you never get interrupted.
🛡️ Code Drift Self-Healing
Did you pull upstream commits or add a few lines? The extension recognizes the surrounding code and automatically snaps breakpoints to their true lines.
🔄 Set Breakpoints Naturally, Save with One Click
Debug as usual with your mouse. When it works, click once to "Export Current Breakpoints to Scene"—no manual JSON editing needed.
🌲 Checklist-Style Sidebar Management
View all your scenes in the "Run & Debug" panel. Click checkboxes to toggle breakpoints or layer multiple scenes together.
⚡ Auto-Load on F5
Link your launch profiles to a scene. Pressing F5 automatically prepares the right breakpoints before the debugger starts.
📊 Visual Graph Canvas for Living Architecture (v1.3.0)
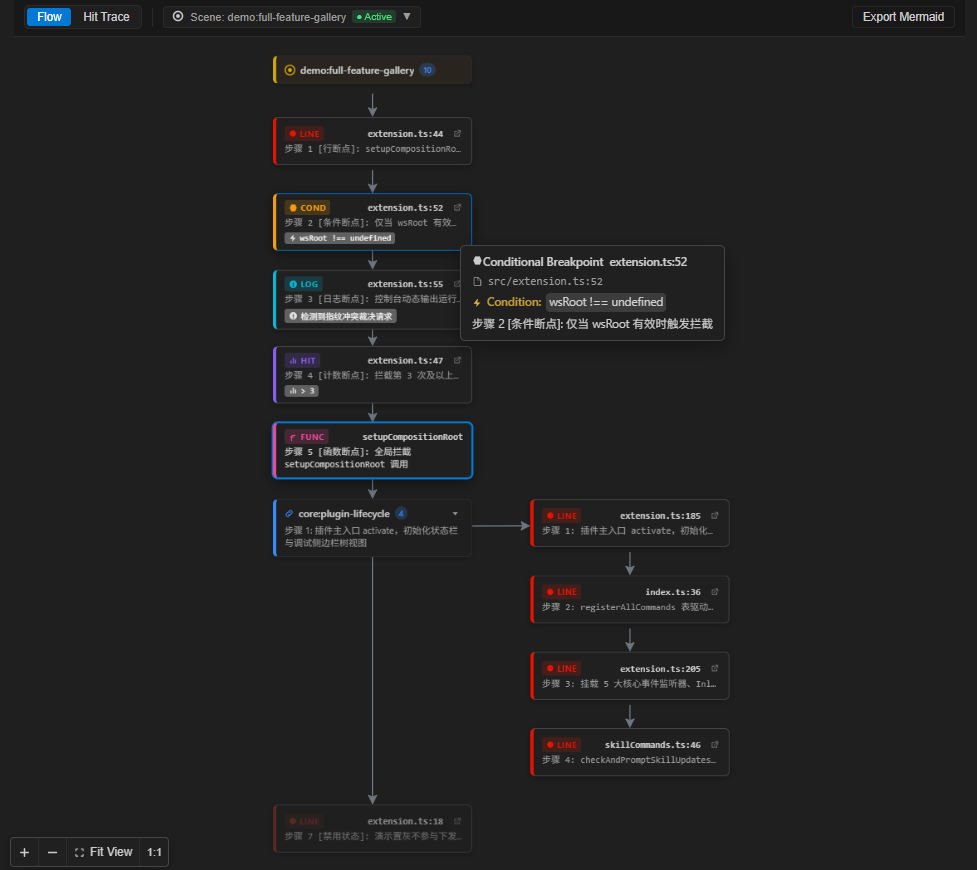
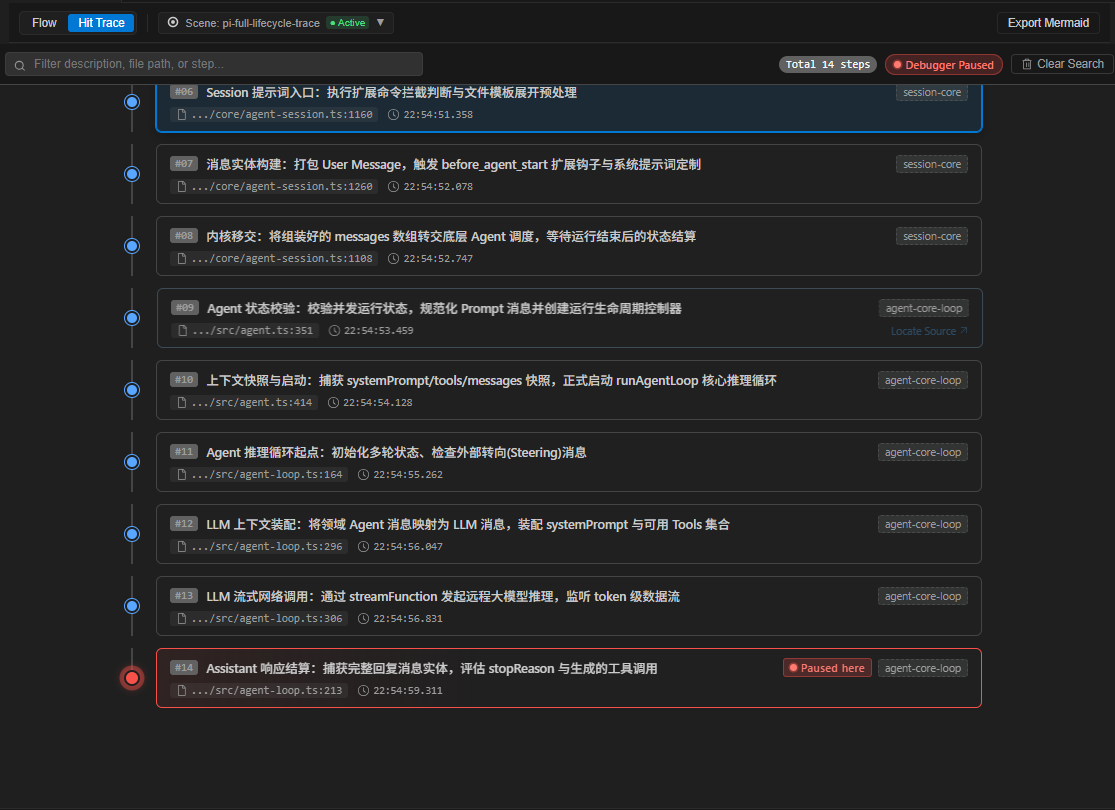
Click the graph canvas button on the sidebar title bar (or run Scene Breakpoints: Show Graph Canvas from the Command Palette) to open an interactive read-only DAG canvas. View lane layering, nested scene references, and breakpoint cards at a glance; observe live pulses and execution trace steps during debugging, and export ready-to-render Mermaid diagrams to markdown documents or PRs with one click.
🧩 Compose Scenes with Scene References (v1.1.0)
Reference an entire scene inside another with { "type": "scene", "name": "..." }. Common flows like auth or bootstrap are maintained once and reused everywhere—declaration order is execution order, circular references abort activation with the full cycle path, and dangling references degrade to warnings instead of blocking other breakpoints.
🔒 Team & Personal Config Isolation (v1.2.0)
Store shared team scenes in .vscode/debug-scenes.json under Git, while personal temporary breakpoints live in .vscode/debug-scenes.local.json which is automatically added to .gitignore. Experiment freely without dirtying git diffs.
📸 Incident-to-Scene: Capture Call Stack (v1.2.0)
When paused at a breakpoint or exception, right-click to capture all in-workspace stack frames into a new scene with 3-line context fingerprints. Preserve the exact incident scene for yourself, teammates, or AI collaboration.
🤖 AI-Generated Breakpoint Scenes, Ready in Seconds
When asking an AI agent to analyze a bug or trace an execution path, it can directly generate a complete breakpoint scene with step-by-step notes and activate it immediately—no more manual file jumping or clicking line numbers.
🚀 Quick Start
1. Installation
- From Marketplace: Search for
Scene Breakpoints in the Extensions view (Ctrl+Shift+X / Cmd+Shift+X) and click Install;
- From VSIX: In Extensions view, click
... $\rightarrow$ Install from VSIX....
2. 3-Step Walkthrough
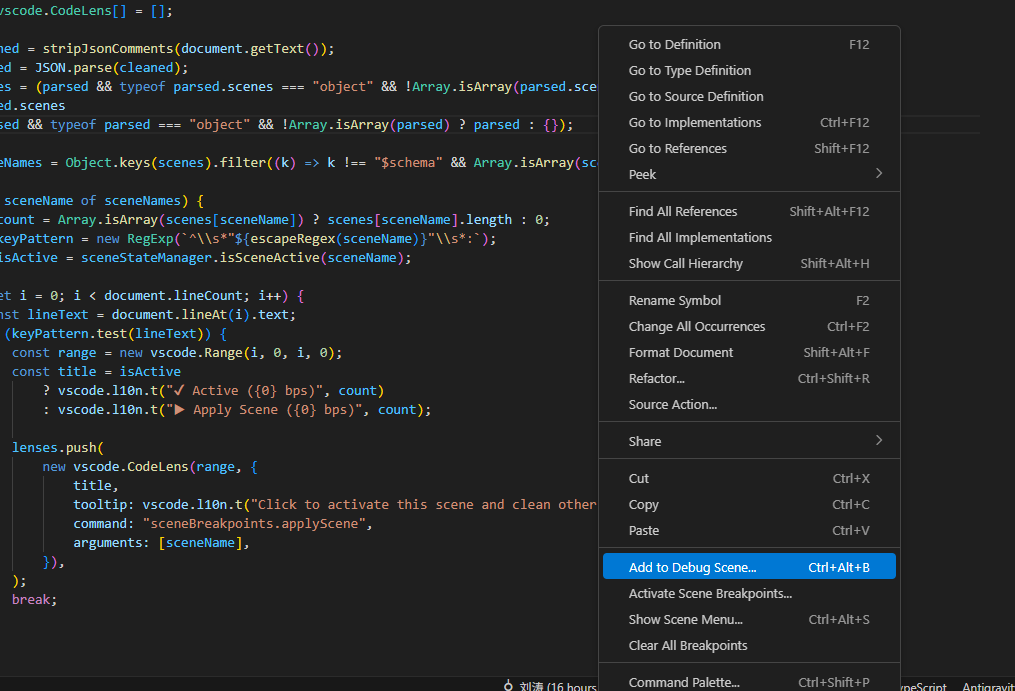
- Add Breakpoint: Right-click on any line and choose
Add to Debug Scene..., or press Ctrl + Alt + B (Cmd + Alt + B on macOS), select a scene, and enter a note;
- Switch Scene: Click the status bar item at the bottom (or press
Ctrl + Alt + S / Cmd + Alt + S on macOS) to activate one or more scenes. Upon activation, the status bar displays the active scene, the sidebar view highlights the scene, and editor breakpoint dots mount instantly;
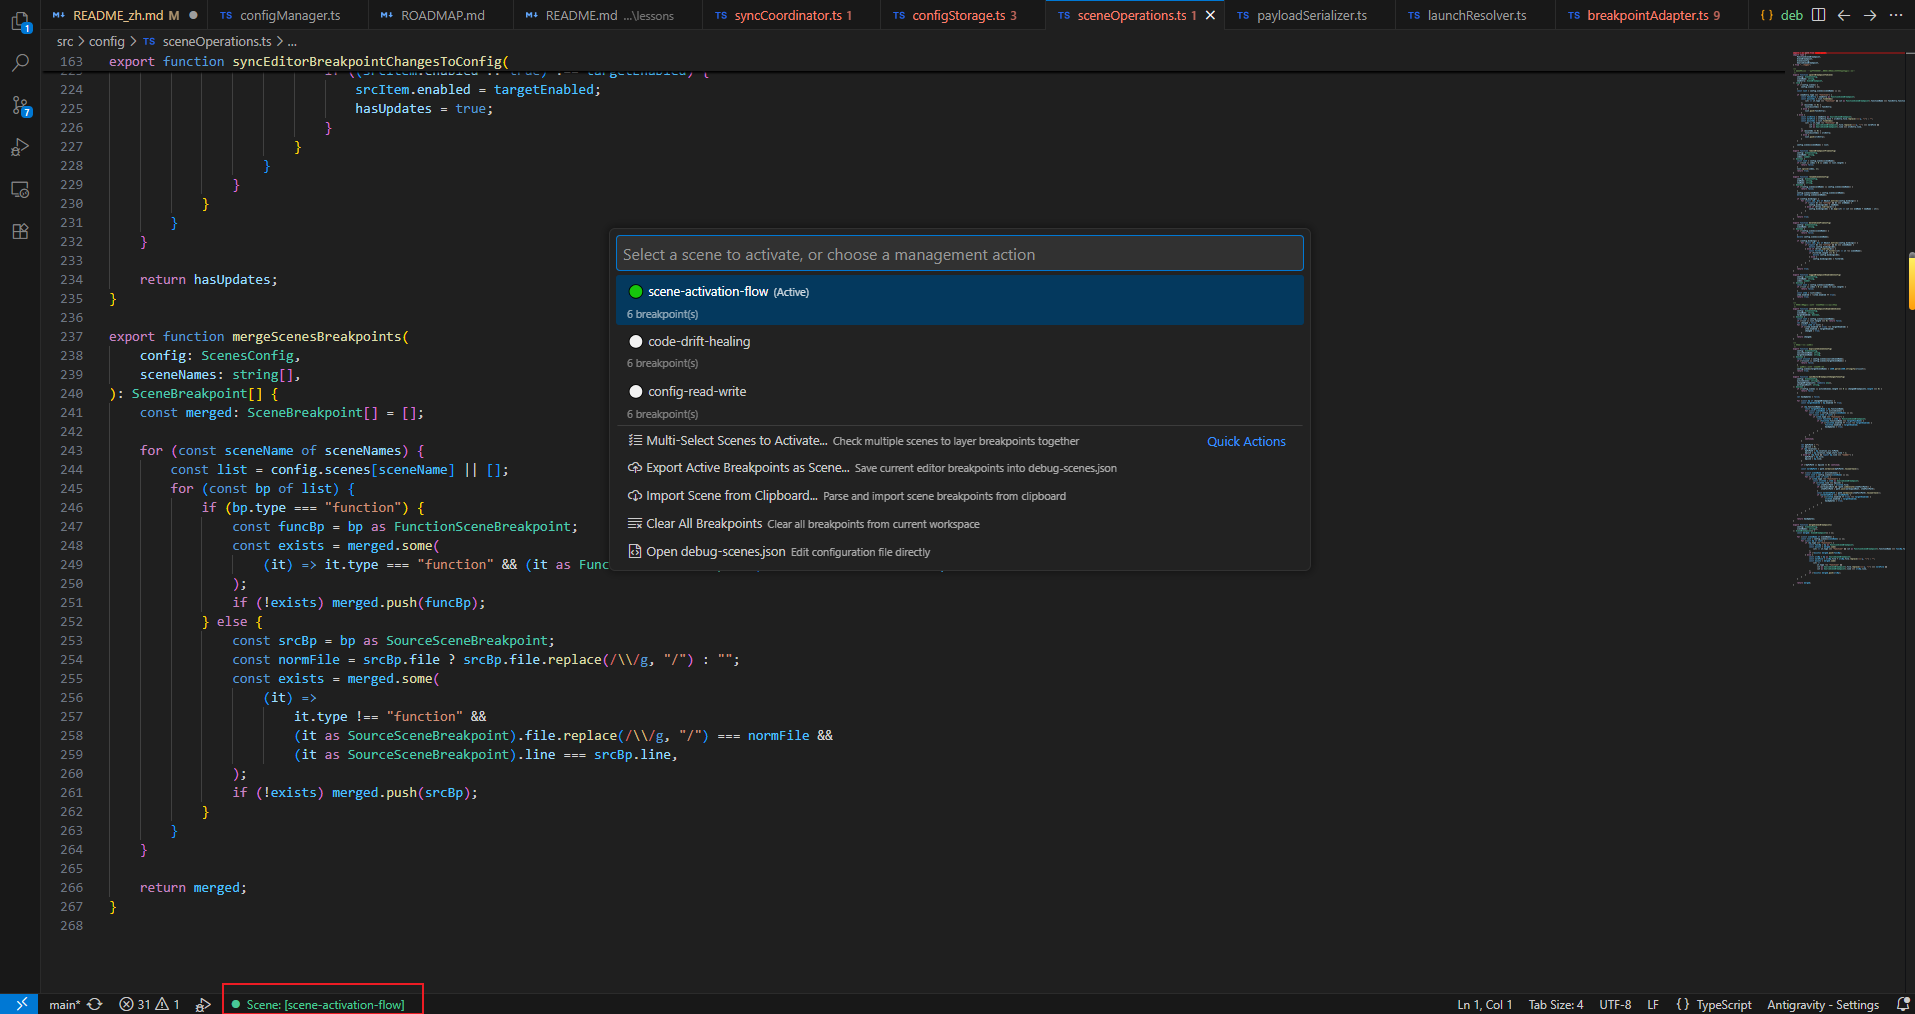
- Export Active: After placing breakpoints freely in code, run
Scene: Export Current Breakpoints to Scene... from the command palette to persist them.
⌨️ Shortcuts
| Shortcut |
Description |
Ctrl + Alt + S (macOS: Cmd + Alt + S) |
Open Scene Control Menu / Switch & Multi-select scenes (or click Status Bar) |
Ctrl + Alt + B (macOS: Cmd + Alt + B) |
Add current line to scene with a description |
Alt + ↑ / Alt + ↓ |
Move breakpoint up / down in tree view (supports continuous hold or drag-and-drop) |
💡 Shortcut Conflict Tip: On Windows, if Ctrl + Alt + B is captured by input methods or graphics card utilities, you can easily customize it under VS Code's Keyboard Shortcuts (Ctrl + K Ctrl + S) by searching for sceneBreakpoints.
🎨 Advanced Features
1. Visual Graph Canvas (v1.3.0)
Click the graph canvas button on the "Scene Breakpoints" sidebar title bar (or run Scene Breakpoints: Show Graph Canvas from the Command Palette) to open an interactive living architecture canvas:
- Execution-Flow DAG View: Renders complete execution flows with lane layering (Team vs. Local), nested scene reference groups, and typed breakpoint cards;
- Click-through Source Navigation: Clicking any node or trace step splits and focuses the target source file with smooth viewport centering and an 800ms highlight;
- Live DAP Pulse & Hit Trace Timeline: Observes live breakpoint pulses as your code runs, with an inline trace timeline tracking execution steps, loops, and unvisited points;
- Scope Selector: Multi-select any combination of scenes (active or inactive) with instant "what you see is what you inspect" canvas updates;
- One-click Mermaid Export: Click the export button in the top bar to copy clean
flowchart TD code directly to your clipboard, ready for Markdown docs or PR reviews.
2. Scene Composition Engine: Inline Scene References (v1.1.0)
Build scenes from other scenes instead of copy-pasting shared breakpoint lists:
- Inline Reference Entries:
{ "type": "scene", "name": "auth-flow" } expands the referenced scene's entire breakpoint set at that exact position—depth-first, declaration order = execution order;
- Safe Expansion: Circular references (including self-reference) abort activation before touching disk or dispatching to the debugger, reporting the full cycle path (e.g.
A → B → A); dangling references degrade to warnings and are skipped;
- Toggle Without Deleting:
enabled: false temporarily detaches the whole reference subtree; optional desc labels the node in the sidebar;
- Tree View Navigation: Nested reference nodes render read-only in the sidebar with jump-to-source (
revealRefSource) and enable/disable toggles; self-healing write-backs are routed to the owning scene (ownerScene).
3. Team & Personal Config Isolation (v1.2.0)
Avoid cluttering team repositories with temporary experimental breakpoints:
- Team Layer:
.vscode/debug-scenes.json (tracked in Git, shared across the engineering team);
- Personal Private Layer:
.vscode/debug-scenes.local.json (automatically appended to .gitignore upon extension activation);
- Merged View & Overrides: Local scenes seamlessly override same-named team scenes and appear with a distinct
[local] badge in the sidebar.
4. Incident-to-Scene: Capture Call Stack (v1.2.0)
When paused at an unexpected exception or critical breakpoint:
- Right-click in the editor and choose
Scene Breakpoints: Capture Call Stack to Scene (or invoke via Command Palette);
- Automatically extracts in-workspace frames, dedupes lines, and computes 3-line code fingerprints into a new debug scene in seconds.
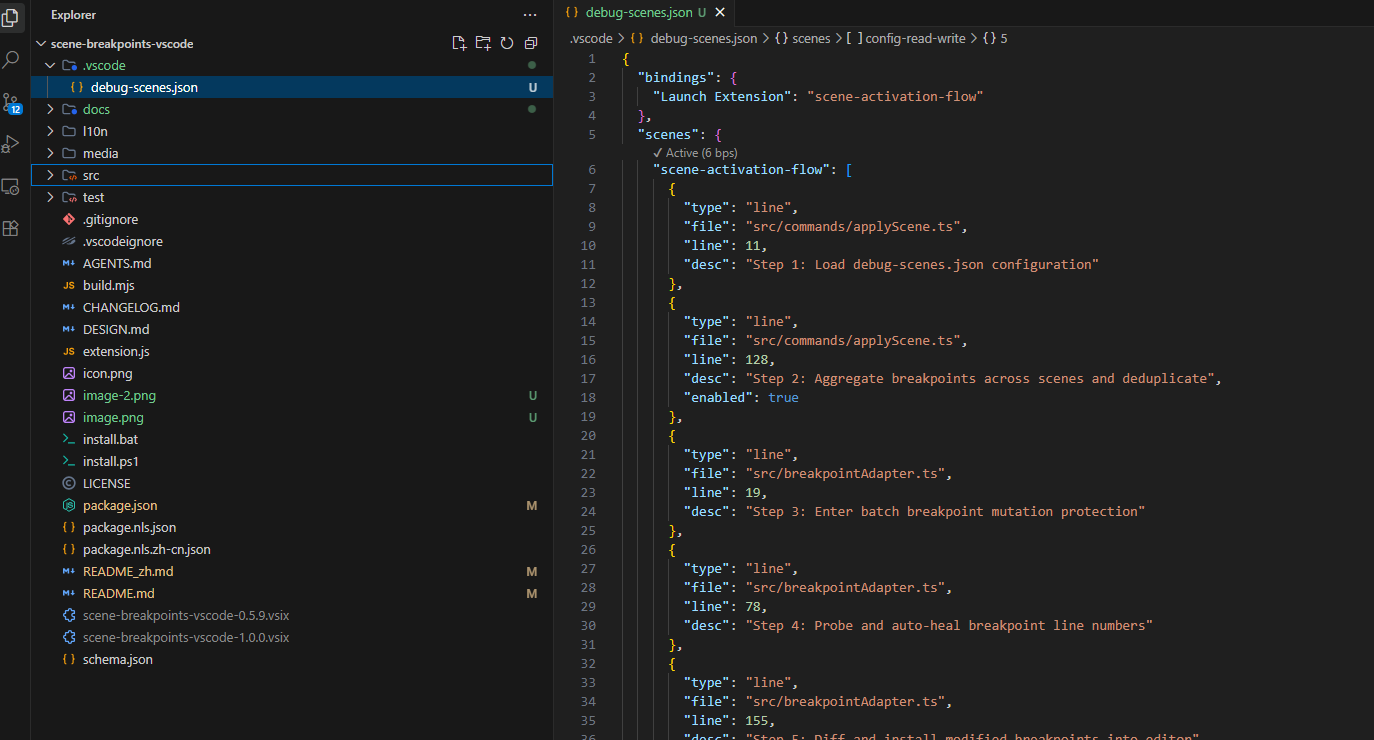
Presets are stored in declarative JSON at .vscode/debug-scenes.json, with built-in CodeLens buttons and schema validation:
{
  "$schema": "https://raw.githubusercontent.com/Tonys-L/scene-breakpoints-vscode/main/schema.json",
  "activeScenes": ["login-debug"],
  "bindings": {
    "Launch API Server": "login-debug"
  },
  "scenes": {
    "common-setup": [
      {
        "type": "line",
        "file": "src/server.ts",
        "line": 12,
        "desc": "Shared: server bootstrap check"
      }
    ],
    "login-debug": [
      {
        "type": "scene",
        "name": "common-setup",
        "desc": "Step 0: compose the shared setup scene"
      },
      {
        "type": "condition",
        "file": "src/auth.ts",
        "line": 45,
        "condition": "user.isVip === true",
        "desc": "Step 1: Intercept only when VIP user logs in"
      },
      {
        "type": "logpoint",
        "file": "src/agent-loop.ts",
        "line": 104,
        "logMessage": "Current status: {state.status}",
        "desc": "Step 2: Print runtime status without pausing"
      },
      {
        "type": "line",
        "file": "src/user.ts",
        "line": 88,
        "desc": "Step 3: Extract core session data"
      }
    ]
  }
}
💡 activeScenes property: Records currently activated debug scene(s) (supports multi-scene layering). AI Agents can modify this field to trigger declarative scenario activation without invoking commands (see AI Agent section below).
🤖 AI Agent Integration & One-Click Skill Deployment
Scene Breakpoints collaborates seamlessly with modern AI coding assistants, allowing your AI to understand, create, and manage breakpoint scenes for you:
1. One-Click AI Agent Skill Deployment
Press Ctrl+Shift+P and run Scene Breakpoints: Install Agent Skill to deploy the scene-breakpoints skill directly into your workspace, covering 8 major AI IDEs & Agent platforms:
- Antigravity:
.agents/skills/scene-breakpoints/SKILL.md
- Cursor IDE:
.cursor/rules/scene-breakpoints.mdc
- Windsurf:
.windsurf/rules/scene-breakpoints.md
- Cline (Claude Dev):
.clinerules/scene-breakpoints.md
- Roo Code:
.roorules/scene-breakpoints.md
- Continue.dev:
.continue/prompts/scene-breakpoints.prompt
- GitHub Copilot:
.github/skills/scene-breakpoints/SKILL.md
- Trae IDE:
.trae/skills/scene-breakpoints/SKILL.md
Once installed, simply instruct your AI: "Help me analyze why login failed and set up a breakpoint scene". The agent will automatically inspect the code, assemble breakpoints, and activate the scene for you!
2. Full-Spectrum AI Diagnostics
Run Scene Breakpoints: Diagnose AI Integration to inspect cross-platform skill deployment status and perform one-click repairs:
⚡ [Host Environment] Auto-detect current IDE (Antigravity / Cursor / Trae / VS Code) and prioritize rules
✅ [Configuration] allowAiFileActivation: Enabled (declarative scene read/write ready)
✅ [Deployed Skills] Antigravity, Cursor, Trae (latest baseline)
⚠️ [Pending Platforms] GitHub Copilot, Windsurf → Click [One-Click Install] to deploy instantly
📖 More Documentation
💖 Support & Feedback
If this extension is helpful to you, please consider leaving a ⭐ rating on VS Code Marketplace or Open VSX.
Found a bug or have a suggestion? Feel free to open an issue.
📄 License
MIT License © 2026 Tony.L