
Enterprise Integration Debugger
Line-by-line debugger for Liquid templates, XSLT maps, and .NET DLL extension functions.
Stop guessing. Step through. See every variable, every transformation, every value — in real time.











What it does
Enterprise Integration Debugger brings IDE-quality step-through debugging to three worlds that previously had none:
| Mode |
Files |
Description |
| 🟣 Liquid |
.liquid .html |
DotLiquid templates — Azure Logic Apps, Shopify, email/SMS |
| 🟠 XSLT |
.xsl .xslt |
XSLT 1.0 / 2.0 / 3.0 stylesheets — version auto-detected |
| 🔵 XSLT + DLL |
.xsl .btm + .dll |
BizTalk Maps and XSLT with .NET C# extension functions |
Every mode gives you: variable inspector, breakpoints, watch expressions, step over/into/out, real-time output, test suites, and a built-in searchable reference guide.
Quick Start
1. Install & Launch
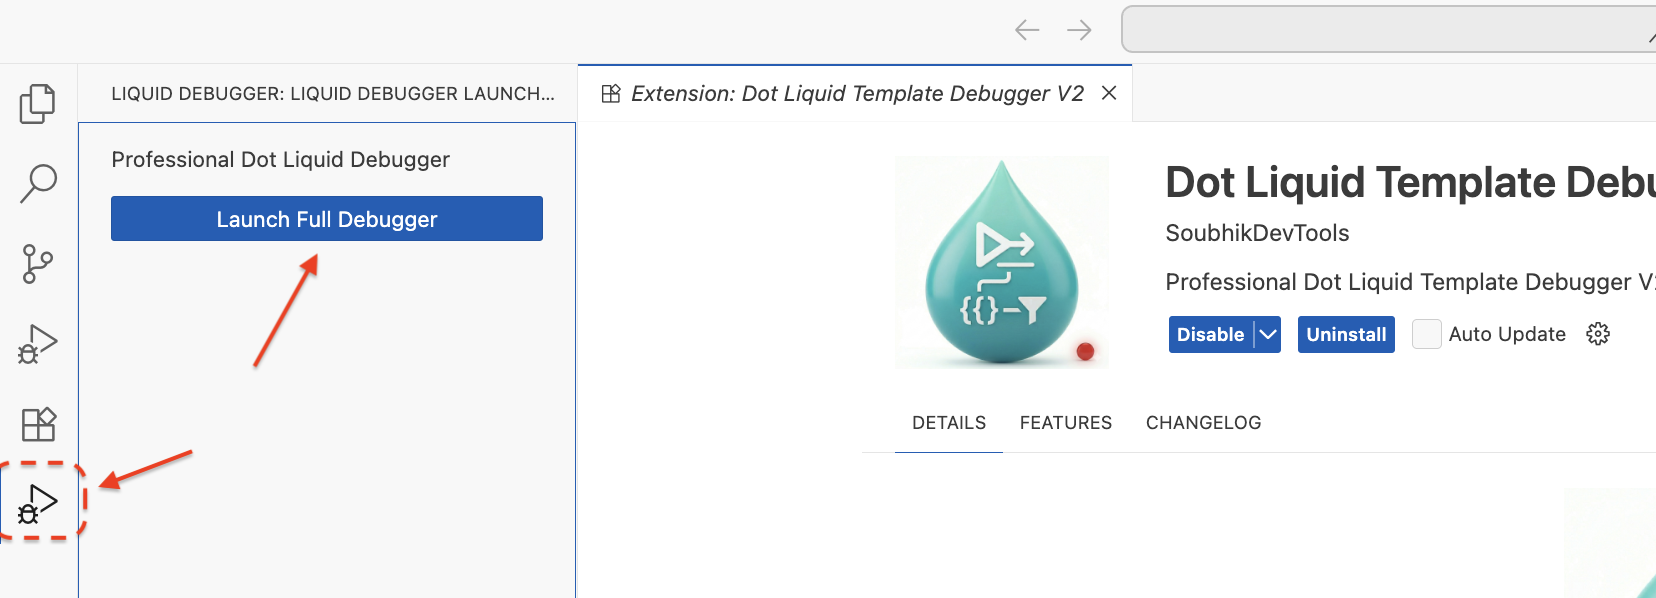
Search Enterprise Integration Debugger in the VS Code Extensions panel and click Install, or:
code --install-extension SoubhikDevTools.dot-liquid-template-debugger
Click the Integration Debugger icon in the Activity Bar, or open the Command Palette (Ctrl/Cmd+Shift+P) and type Integration Debugger: Start.
2. Load Template & Data
Click Load Template and choose your mode:
- Liquid / XSLT tab — paste or drop your template and JSON / XML input data
- XSLT + DLL tab — drop your
.xsl / .btm map, XML input, and any .dll assemblies
- Batch tab — run one template against up to 5 different data inputs at once
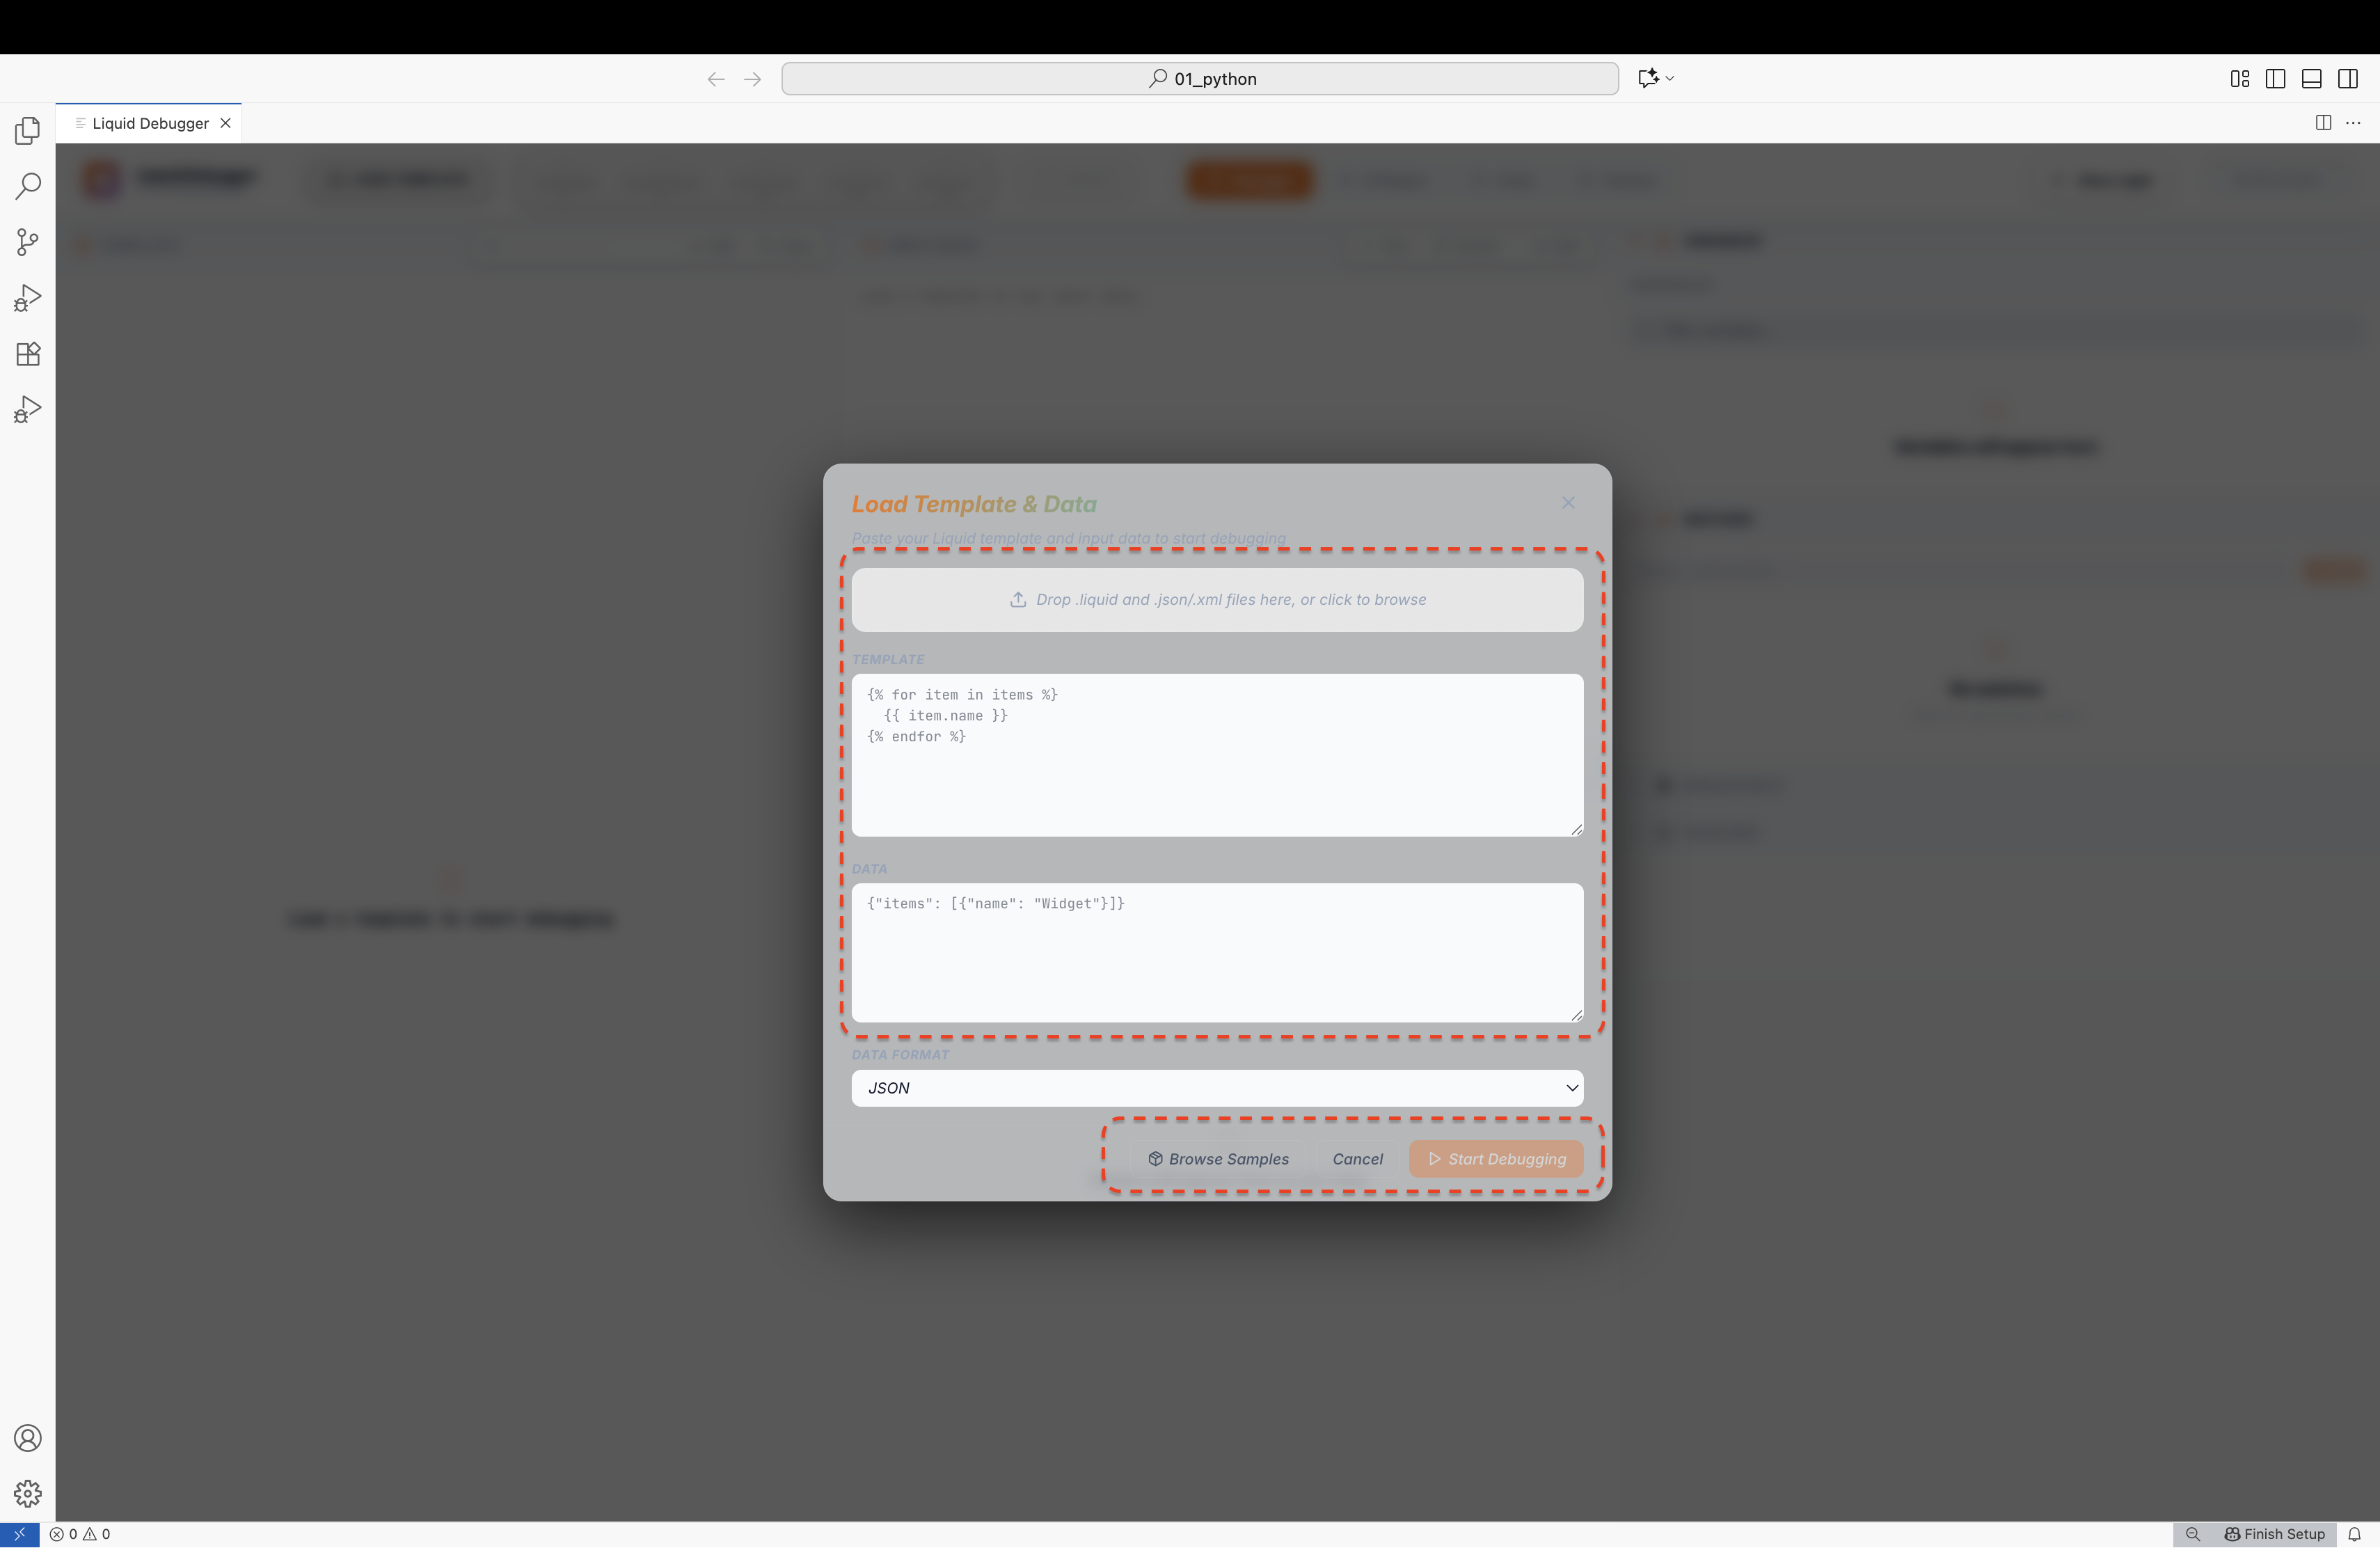
Liquid / XSLT mode
|
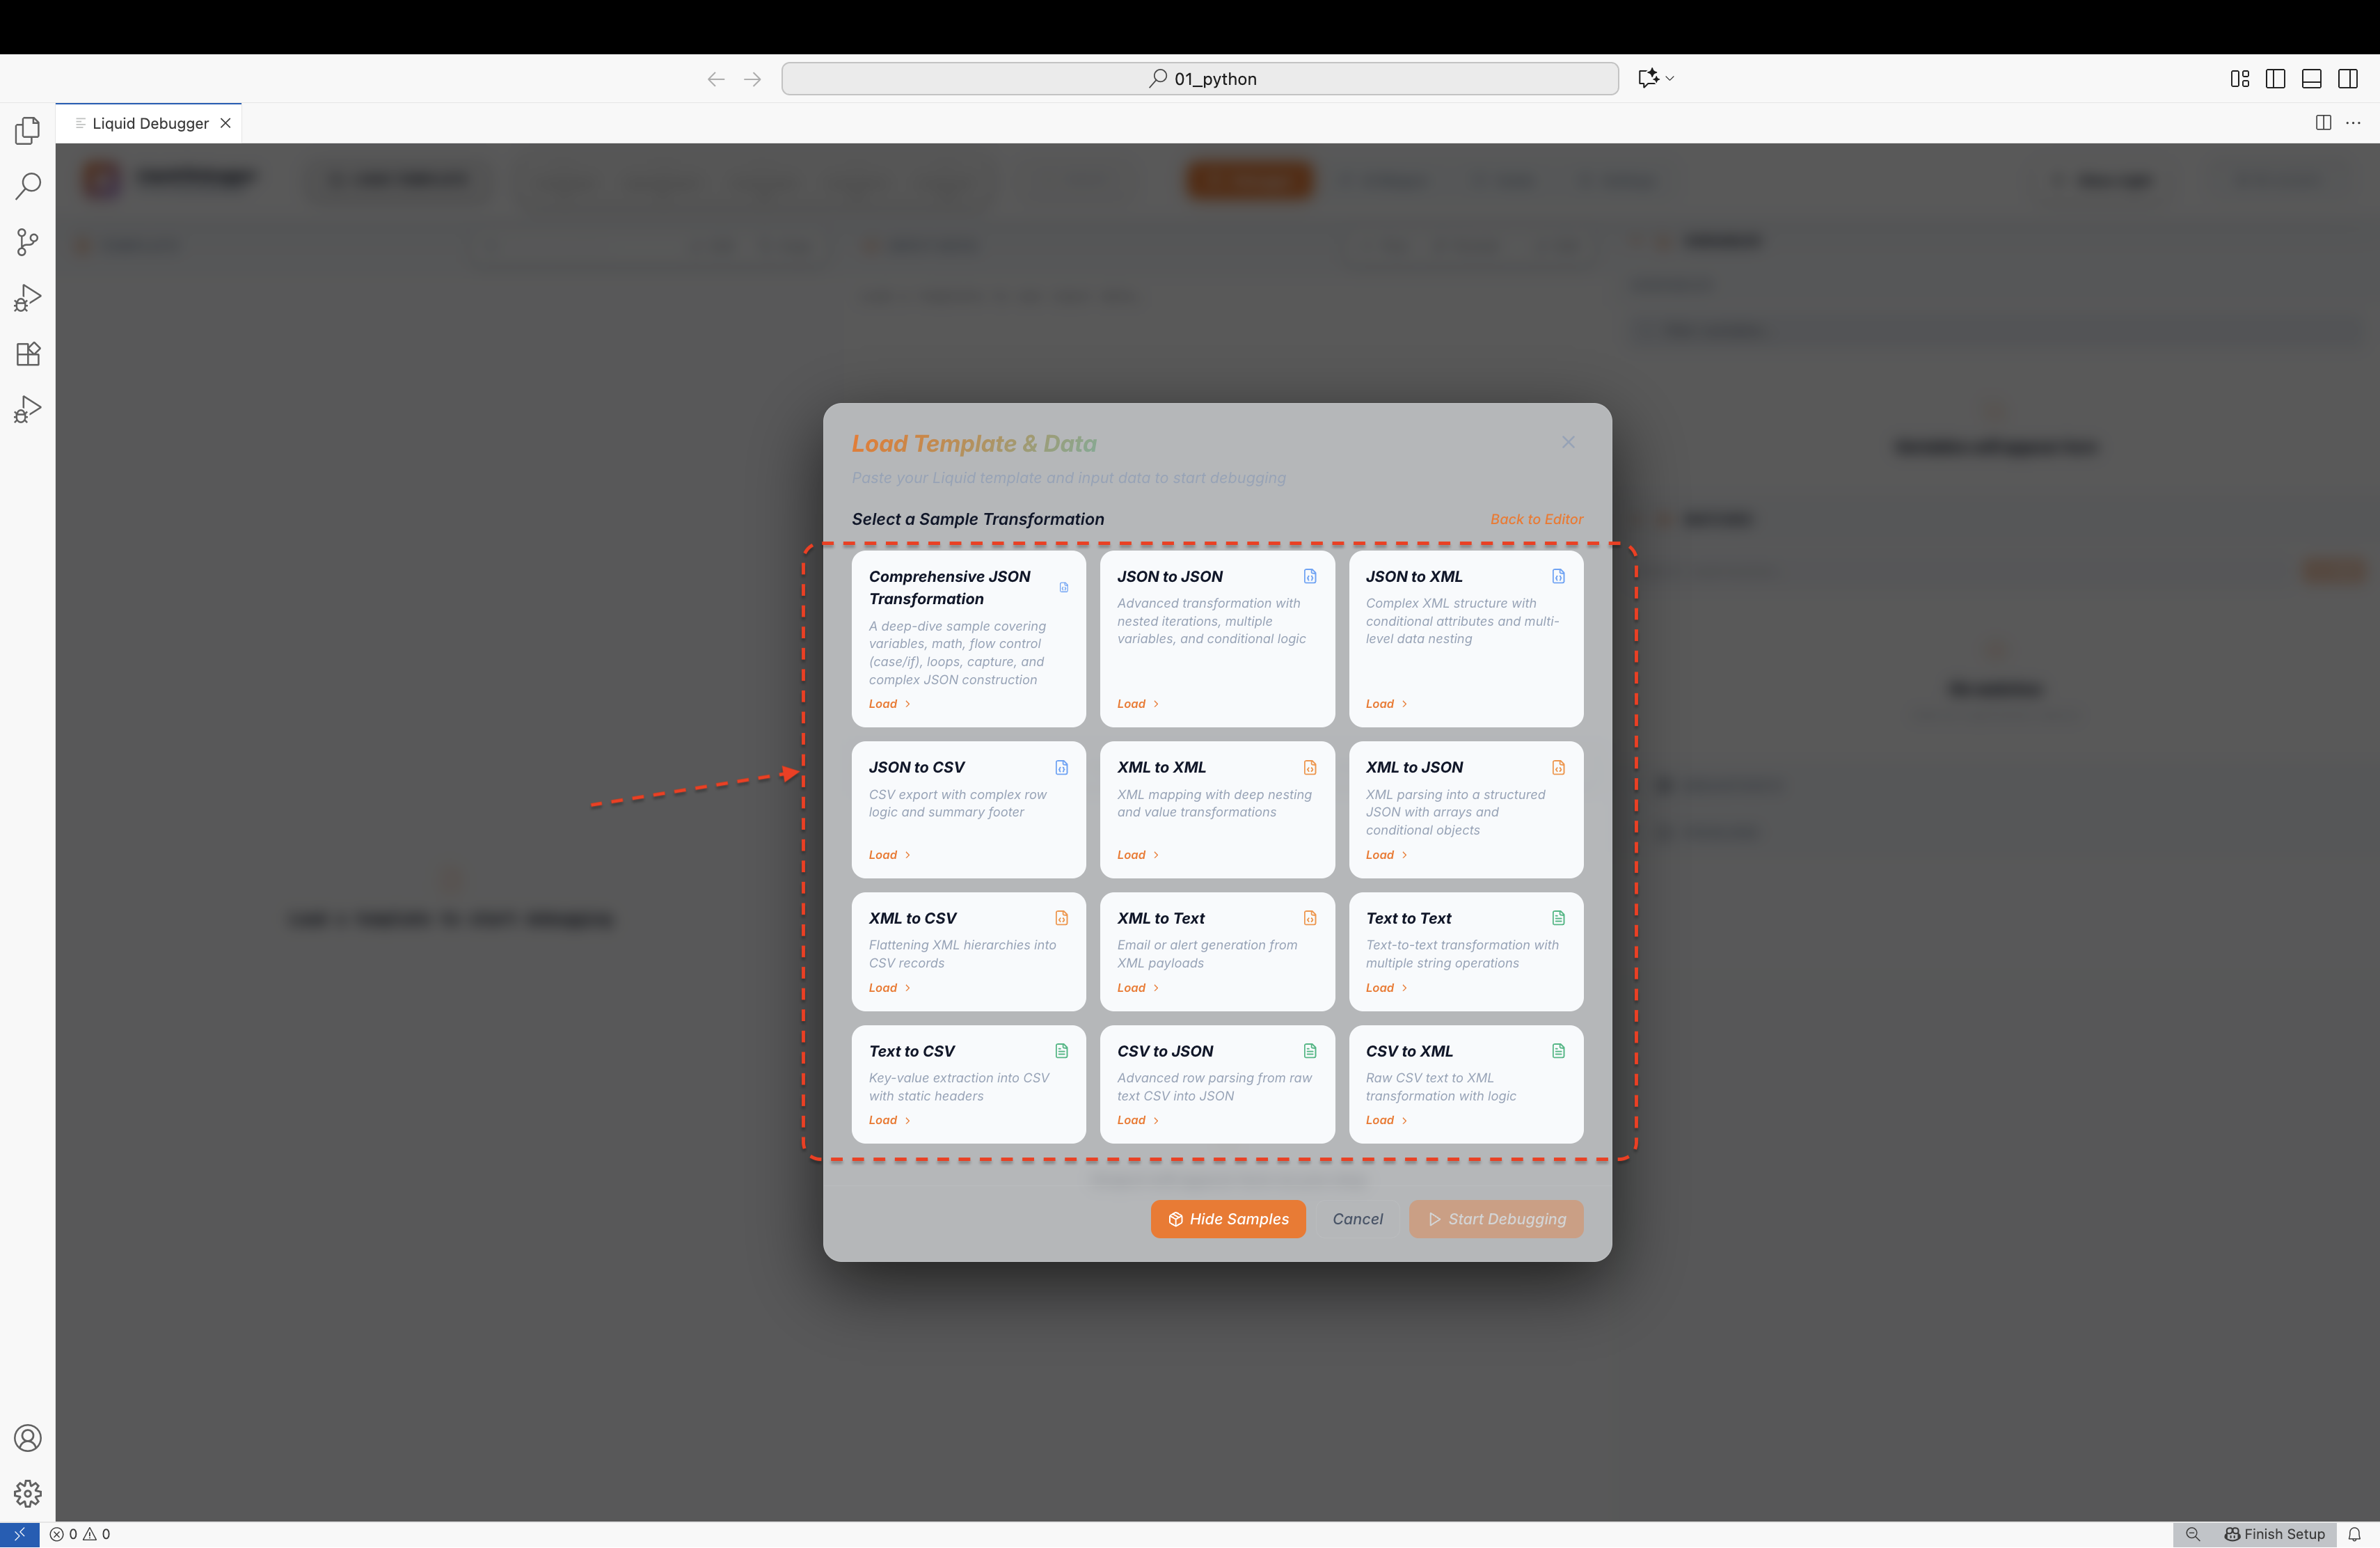
Browse built-in samples
|
3. Start Debugging
Click Start Debugging and use the step controls:
| Control |
Key |
Action |
| Step Over |
F10 |
Execute current line, advance to next |
| Continue |
F5 |
Run until next breakpoint or end |
| Breakpoint |
F9 |
Toggle breakpoint on current line |
| Step Into |
F11 |
Step into extension function bodies |
| Step Out |
⇧F11 |
Return from current block / function |
| Reset |
Ctrl+Shift+F5 |
Restart from the beginning |
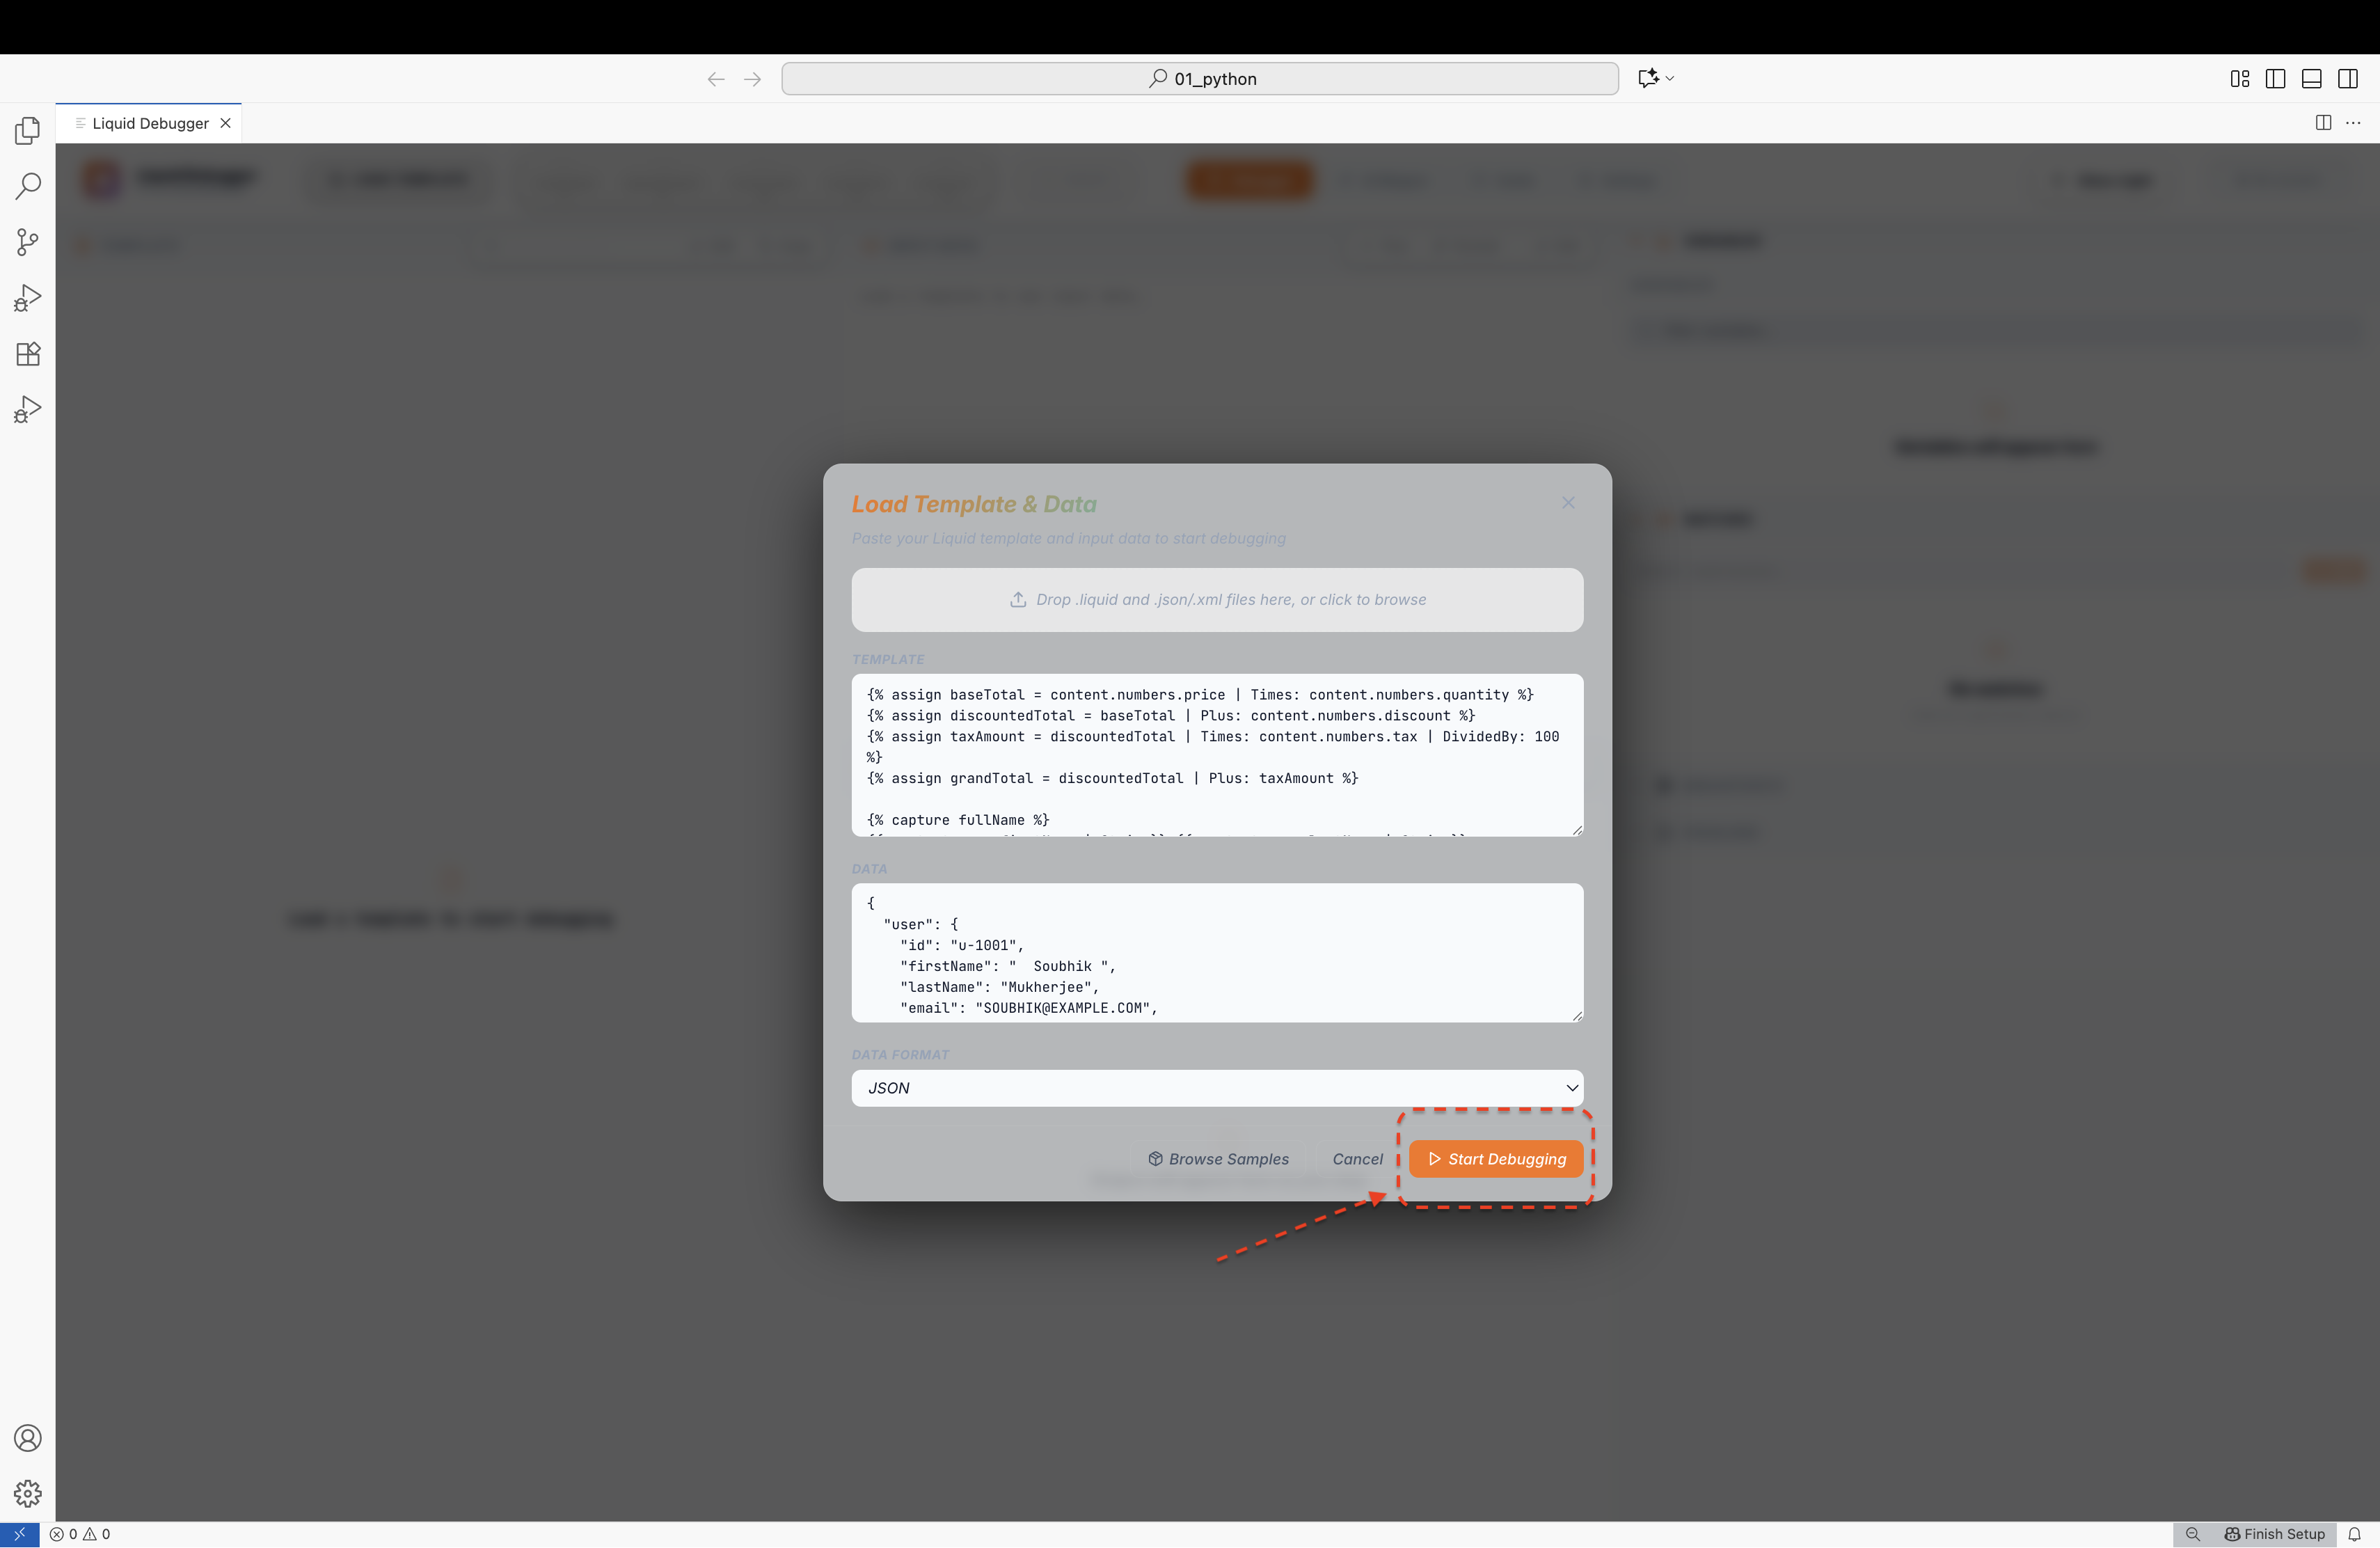
Start Debugging
|
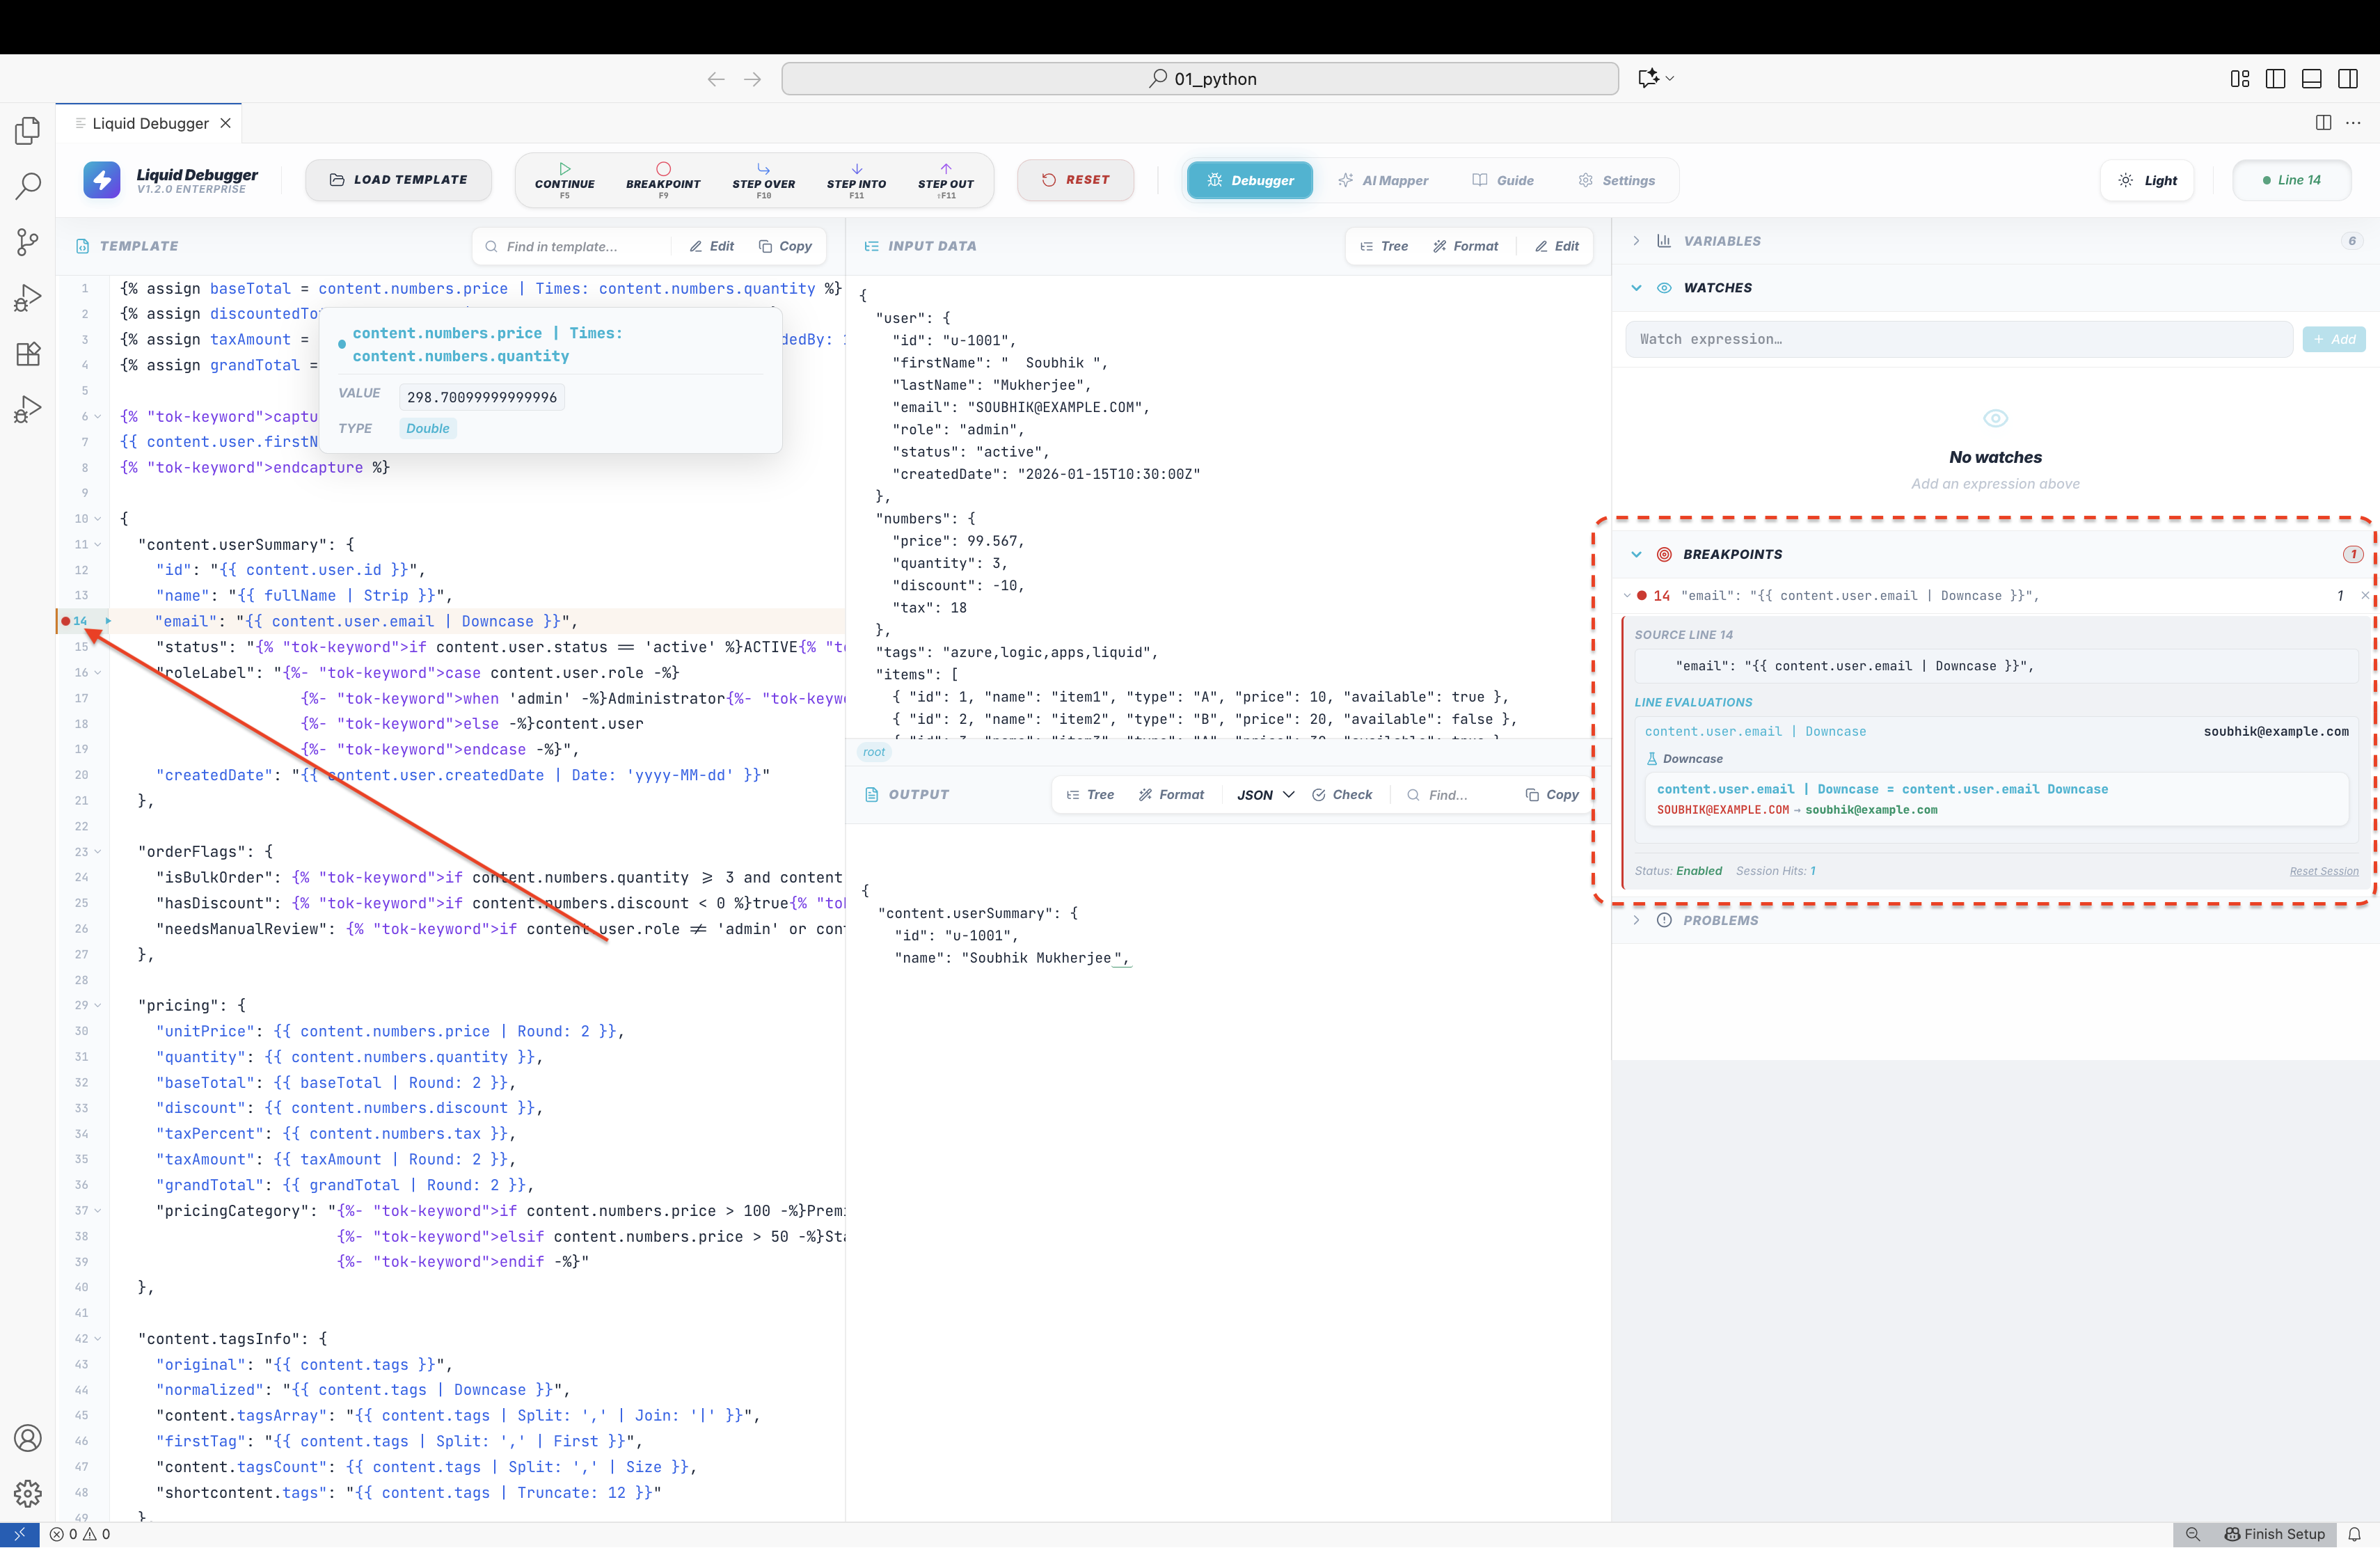
Breakpoints — right-click for conditional expressions
|
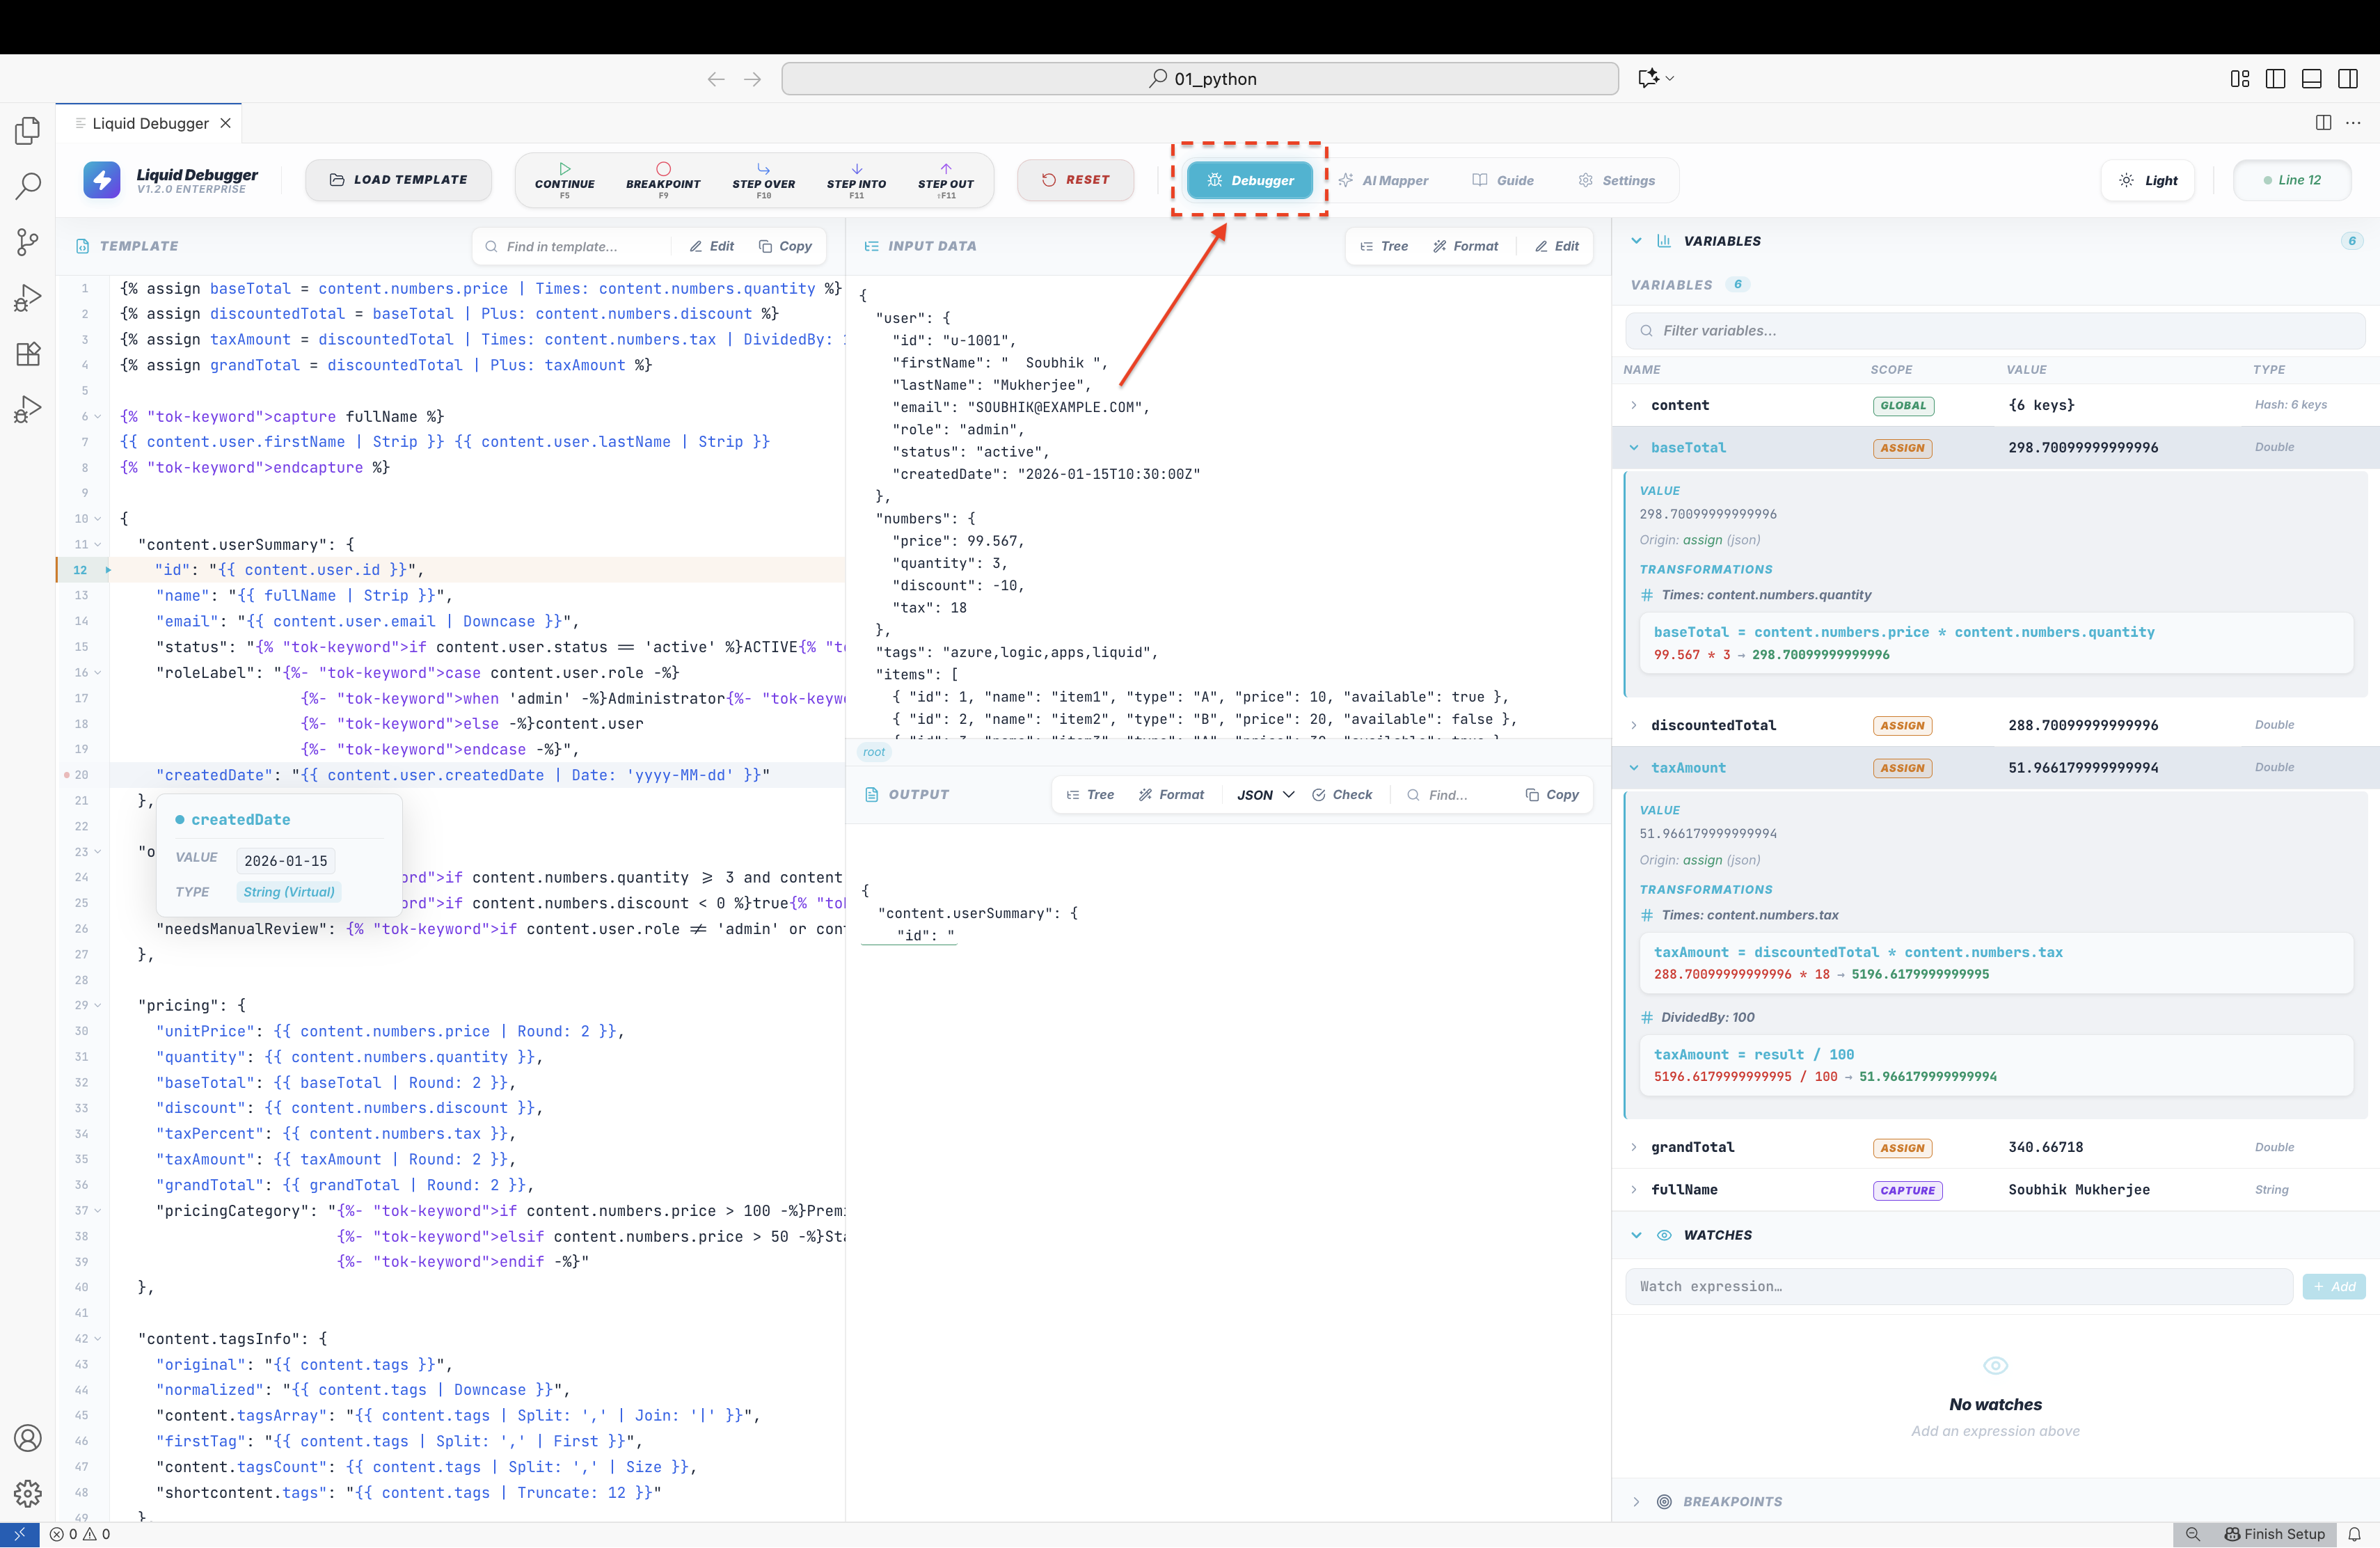
4. Inspect Variables & Live Output
Every variable, scope, and value updates in real time as you step:
Features
Step Debugger
- Step Over (F10) — execute the current line and advance to the next
- Continue (F5) — run until the next breakpoint or end of template
- Step Into (F11) — step into DLL extension function bodies (XSLT+DLL mode)
- Step Out (⇧F11) — complete the current block and return to the caller
- Reset (Ctrl+Shift+F5) — restart from the beginning, preserving all breakpoints and watches
- Current line indicator — highlighted line with play arrow tracks execution position in real time
- Execution state — buttons and status badge reflect loading, running, paused, and complete states
Variables Panel
- Live variable tracking — every variable in scope shown with name, value, scope tag, and type
- Scope badges — color-coded: GLOBAL (green), ASSIGN (yellow), FOR (purple), CAPTURE (orange), INCREMENT/DECREMENT (cyan)
- Type display — String, Double, Integer, Boolean, Hash, Array
- Expand / collapse — click any row to see the full VALUE section, origin, transformation chain, and history
- Formatted VALUE — nested objects rendered with indentation; arrays shown item-by-item
- Variable origin — shows source path and format (e.g.
assign (json))
- Transformation chain — for computed values (e.g.
price | Times: qty), each filter step shown with before → after values and color-coded pill badges
- Change history — per-line history of old → new values as execution advances
- Search / filter — searches variable names AND deep-searches inside rawValue objects recursively
- Changed indicator — glowing dot marks variables modified on the last step
- Float precision — IEEE-754 display noise eliminated everywhere (e.g.
299.96999999999997 → 299.97)
Inspector Panel — Watches
- Add watch expressions — pin any Liquid or XPath expression to monitor throughout execution
- Live value updates — each watch shows current value and type, updated on every step
- Transformation detail — expand any watch to see its full filter chain with before/after values
- Remove watch — × button on each watch card
- Count badge — section auto-expands when the first watch is added
- State preserved — watch input text survives accordion collapse/expand
Inspector Panel — Breakpoints
- Toggle breakpoint — click the gutter dot on any line to set or clear
- Right-click conditional breakpoint — set an expression that must be true to pause (e.g.
item.price > 100)
- Enable / disable — toggle individual breakpoints without removing them
- Hit count — displays how many times each breakpoint has fired
- Auto-expand — Breakpoints section automatically opens when execution pauses on one
- Expression evaluations — expanding a breakpoint row evaluates all expressions on that line and shows results
Inspector Panel — Evaluate
- Ad-hoc evaluation — type any expression and run it against the current execution context
- Pipeline stitching — if the expression shares a base variable with a watch, transformations are merged for richer context
- Typo hinting — if a variable is not found, suggests the closest match from current scope
- Result display — value, type, and full transformation chain
Inspector Panel — Problems
- Real-time template linting — errors and warnings annotated per-line in the template gutter
- Severity levels —
error (red) and warning (yellow) with gutter color bars
- Problem list — each item shows line, message, and severity; section auto-expands when problems exist
Inspector Panel — Timeline
- Step history — every execution step recorded with line, duration, output length, and variable snapshot
- Duration bars — relative bar widths visualize hotspot lines
- Variable change tracking — changed variables highlighted per step
Template Panel
- Syntax highlighting — full colorization for Liquid / XSLT / XPath; hover any expression token to evaluate it live
- Live edit with syntax highlighting — transparent textarea overlaid on the viewer; syntax colors stay visible while typing
- Editable after failed load — Edit button remains active even when the last load failed so you can fix errors in-place
- Line numbers — always visible; current execution line highlighted with accent color and play marker
- Breakpoint gutter — clickable dots; right-click for conditional breakpoints
- Lint gutter bars — red/yellow bars on lines with validation errors
- Code folding — Fold All / Unfold All; per-line handles for
{% for %}, {% if %}, {% capture %}, and nested JSON blocks
- Find toolbar — search with match counter (
3/12), previous/next navigation (Enter / Shift+Enter)
- Replace bar — Replace first or Replace All with live match count
- Undo / Redo — Ctrl+Z / Ctrl+Shift+Z; step count shown in button tooltip
- Copy — full template to clipboard with confirmation
- Hover tooltip — evaluate any
{{ expr }} or XPath select/match/test attribute on hover; arrays shown with per-item breakdown
- AI Explain — AI-powered explanation of the entire template in plain English
- AI Fix — AI suggests a corrected template on error; one-click Apply Fix
- Scroll sync — textarea and viewer always scroll together; cursor never drifts
- Syntax-highlighted viewer — JSON / XML / CSV / text colorized with line numbers and folding
- Live edit with syntax highlighting — same transparent overlay technique; full highlighting while typing
- Editable after failed load — if JSON/XML is invalid and load fails, Edit button stays active to fix and retry
- Format (Beautify) — auto-indent and pretty-print JSON or XML
- Tree view — structured JSON/XML as an interactive tree with expand/collapse; falls back to raw on syntax error
- Find toolbar — searches the live editContent (works during editing)
- Replace bar — Replace / Replace All
- Undo / Redo — Ctrl+Z / Ctrl+Shift+Z
- Code folding — collapsible nested blocks
- Scroll sync — textarea scroll synced to viewer
Output Panel
- Real-time output — rendered result grows line-by-line as you step
- JSON / XML / Text mode switching — change view format on the fly
- Tree view — interactive structured tree
- Format (Beautify) — pretty-print output
- JSON Validate (Check) — validate output is well-formed JSON
- Find toolbar — search in output with match navigation
- Compare — diff current output against a saved baseline
- Copy — copy to clipboard; dropdown for copy-as-JSON, copy-as-XML, copy-as-text
- Code folding — collapse/expand nested output blocks
- Expand All / Collapse All in tree view
Load Template Dialog
- Liquid / XSLT tab — paste or drop template and data; format selector (JSON / XML / CSV / Text / Key=Value)
- XSLT + DLL tab — drop XSLT / BizTalk map, XML input, and
.dll assemblies
- Batch tab — run one template against up to 5 data inputs simultaneously; results shown as tabs with timing badges; "› Debug" loads any result into the step debugger
- Browse Samples — load built-in sample templates (Liquid and XSLT)
- Drag and drop — drop
.liquid, .xsl, .btm, .dll, .json, .xml, .csv, .txt anywhere in the window; auto-populates the correct fields
- Recent sessions — last 8 loaded sessions as quick-access cards
- XSLT Custom Library Mocks — configure mock functions for XSLT custom extension libraries
Test Suite
- Named test suites — create, rename, and delete suites containing multiple cases
- Test cases — each stores: name, mode (liquid / xslt), template, data + format, expected output
- Run suite — execute all cases in one click; pass / fail / error result per case
- Result detail — actual output shown for failing cases; duration per case
- Summary — pass/fail/error counts and total run time
- Persist — suites saved in VS Code workspace state; survive restarts
AI Mapper
- Generate templates — describe the transformation; AI generates a Liquid or XSLT template
- Structured input — prompt, expected output sample, field mapping table, output format
- Multi-turn continuation — long templates that exceed one model response are auto-continued and stitched
- AI Explain — explain the current template in plain English
- AI Fix — detect errors and generate a corrected template; one-click Apply
- Two AI providers — Gemini or IBM watsonx (Granite), switchable in Settings → AI Mapper. watsonx needs an IBM Cloud IAM API key + watsonx.ai Project ID + region; Gemini needs only an API key
- Model selection — model list fetched live from the active provider; default
gemini-2.0-flash (Gemini) or ibm/granite-3-8b-instruct (watsonx)
- Secure key storage — each provider's key (and watsonx's Project ID/region) stored in VS Code
SecretStorage; never written to settings files or logs
- Opt-in only — all non-AI features fully functional without an API key
Built-in Guide
- Liquid reference — all filters, tags, operators, theory; live code examples with input/output
- XSLT reference — all
xsl: elements, XPath axes and functions, common patterns (Identity Transform, Muenchian Grouping, Lookup Tables, Recursive Accumulation)
- XSLT+DLL reference — .NET extension function signatures,
AddExtensionObject, msxsl:script, userCSharp:, C# patterns (Date Formatting, Currency Rounding, Regex, Base64, Node Splitting)
- Full-text search — across all sections simultaneously
- Technology switcher — one-click switch between Liquid, XSLT, and XSLT+DLL
- Detail drawer — click any entry for syntax, I/O examples, and Pro Tips
Settings
- Themes — 9 premium themes: Dark Default, Midnight, Cool Blue, Warm Wood, Glass Dark, Light Clean, Iceberg, Seashell, Glass Light
- Accent colors — 7 presets (Indigo, Violet, Blue, Cyan, Emerald, Orange, Rose) + custom hex color picker
- AI configuration — enable/disable, API key, model selector
- Language — pick from 10 supported UI languages; auto-detected from your VS Code locale on first launch
- Persist — theme, accent, and language saved to VS Code
globalState
Multi-Language Interface
The entire UI is fully translated into 10 languages — every panel, tab, button, tooltip, modal, error message, and onboarding tour step:
| Language |
Code |
Script |
| English |
en |
Latin (LTR) |
| 中文 (简体) Chinese Simplified |
zh-CN |
CJK (LTR) |
| 中文 (繁體) Chinese Traditional |
zh-TW |
CJK (LTR) |
| Español Spanish |
es |
Latin (LTR) |
| Français French |
fr |
Latin (LTR) |
| Deutsch German |
de |
Latin (LTR) |
| 日本語 Japanese |
ja |
CJK (LTR) |
| 한국어 Korean |
ko |
Hangul (LTR) |
| Português (Brasil) |
pt-BR |
Latin (LTR) |
| العربية Arabic |
ar |
Arabic (RTL — entire UI direction flips) |
Auto-detection: On first launch, the extension reads your VS Code UI language (vscode.env.language) and sets the matching language automatically. No configuration needed.
Manual override: Open Settings → Language and click any language to switch instantly. The choice is remembered across sessions.
Arabic RTL support: Switching to Arabic automatically applies dir="rtl" to the entire interface, mirroring the layout for right-to-left reading.
Liquid Engine
- Full DotLiquid dialect — Azure Logic Apps
content.* variable scoping compatible
- All standard filters —
Upcase, Downcase, Strip, Truncate, Replace, Split, Join, First, Last, Size, Times, Plus, Minus, DividedBy, Modulo, Round, Floor, Ceil, Abs, Date, Escape, Append, Prepend, Remove, and more
- All standard tags —
assign, capture, if/elsif/else, unless, case/when, for/break/continue, tablerow, comment, raw, increment, decrement, cycle
- Transformation tracking — each filter application recorded with before/after values
- Format support — JSON, XML, CSV, Key=Value, plain text input
XSLT Engine
- Version auto-detection — reads
version="1.0", "2.0", or "3.0" from stylesheet
- XSLT 1.0 — .NET
XslCompiledTransform with full DLL extension support
- XSLT 2.0 / 3.0 — Saxon-HE:
xsl:for-each-group, xsl:function, sequences, maps, arrays
- Step through —
xsl:template, xsl:for-each, xsl:if, xsl:choose, xsl:call-template, xsl:apply-templates
- XPath hover evaluation — evaluate
select, match, test attributes on hover
xsl:message — captured and shown in debugger output- BizTalk Maps (
.btm) — format auto-detected; compiled XSLT extracted and stepped
XSLT + DLL Engine
- Extension function tracing — pauses on every
helper:SomeMethod() call; shows source, arguments, and return value
- DLL Source Peek — ILSpy decompiles C# assemblies to readable source without PDB files
userCSharp: support — BizTalk Scripting functoid inline C# shown and stepped- Broad DLL compatibility — .NET 8/9/10/11, .NET Standard 2.0+, .NET Framework (MetadataLoadContext)
- Self-contained runner — SDK needed once to compile the runner; all future runs are SDK-free
- SDK auto-detection — detects .NET 8, 9, 10, 11+; uses the highest available
Global UI
- Zoom-responsive — all sizes derived from VS Code font size; correct at any zoom level
- Multi-language UI — 10 languages; auto-detected from VS Code locale; manually switchable in Settings → Language; Arabic flips the entire layout to RTL
- Global drag-and-drop — drop files anywhere; auto-routed to the correct field
- Onboarding tour — interactive first-run walkthrough; re-launchable via
Integration Debugger: Reset Onboarding Tour
- Toast notifications — success, error, info toasts with auto-dismiss
- Resizable panels — drag dividers to resize Template, Data, Output, and Inspector panels
- Export session — export current template + data + output as a JSON file
- Keyboard shortcuts — F5, F9, F10, F11, ⇧F11, Ctrl+Shift+F5
XSLT + DLL — BizTalk Maps & XSLT 2.0/3.0
XSLT Version Support
The debugger auto-detects the XSLT version from the version="..." attribute — no configuration needed:
| XSLT Version |
Processor |
Features |
| 1.0 |
.NET XslCompiledTransform |
DLL extension functions, BizTalk Maps, msxsl:script |
| 2.0 |
Saxon-HE |
Grouping, sequences, xsl:function, typed values |
| 3.0 |
Saxon-HE |
Maps, arrays, streaming, xsl:try, JSON output |
BizTalk Maps & DLL Extension Functions
- Click Load Template → XSLT + DLL tab
- Drop your
.btm or .xsl, XML input, and .dll assemblies
- Click Start Debugging
When a helper:SomeMethod() extension call executes, the debugger pauses and shows:
- Decompiled C# source of the method via ILSpy — no PDB files or source upload needed
- Arguments passed to the function
- Return value in the variable inspector
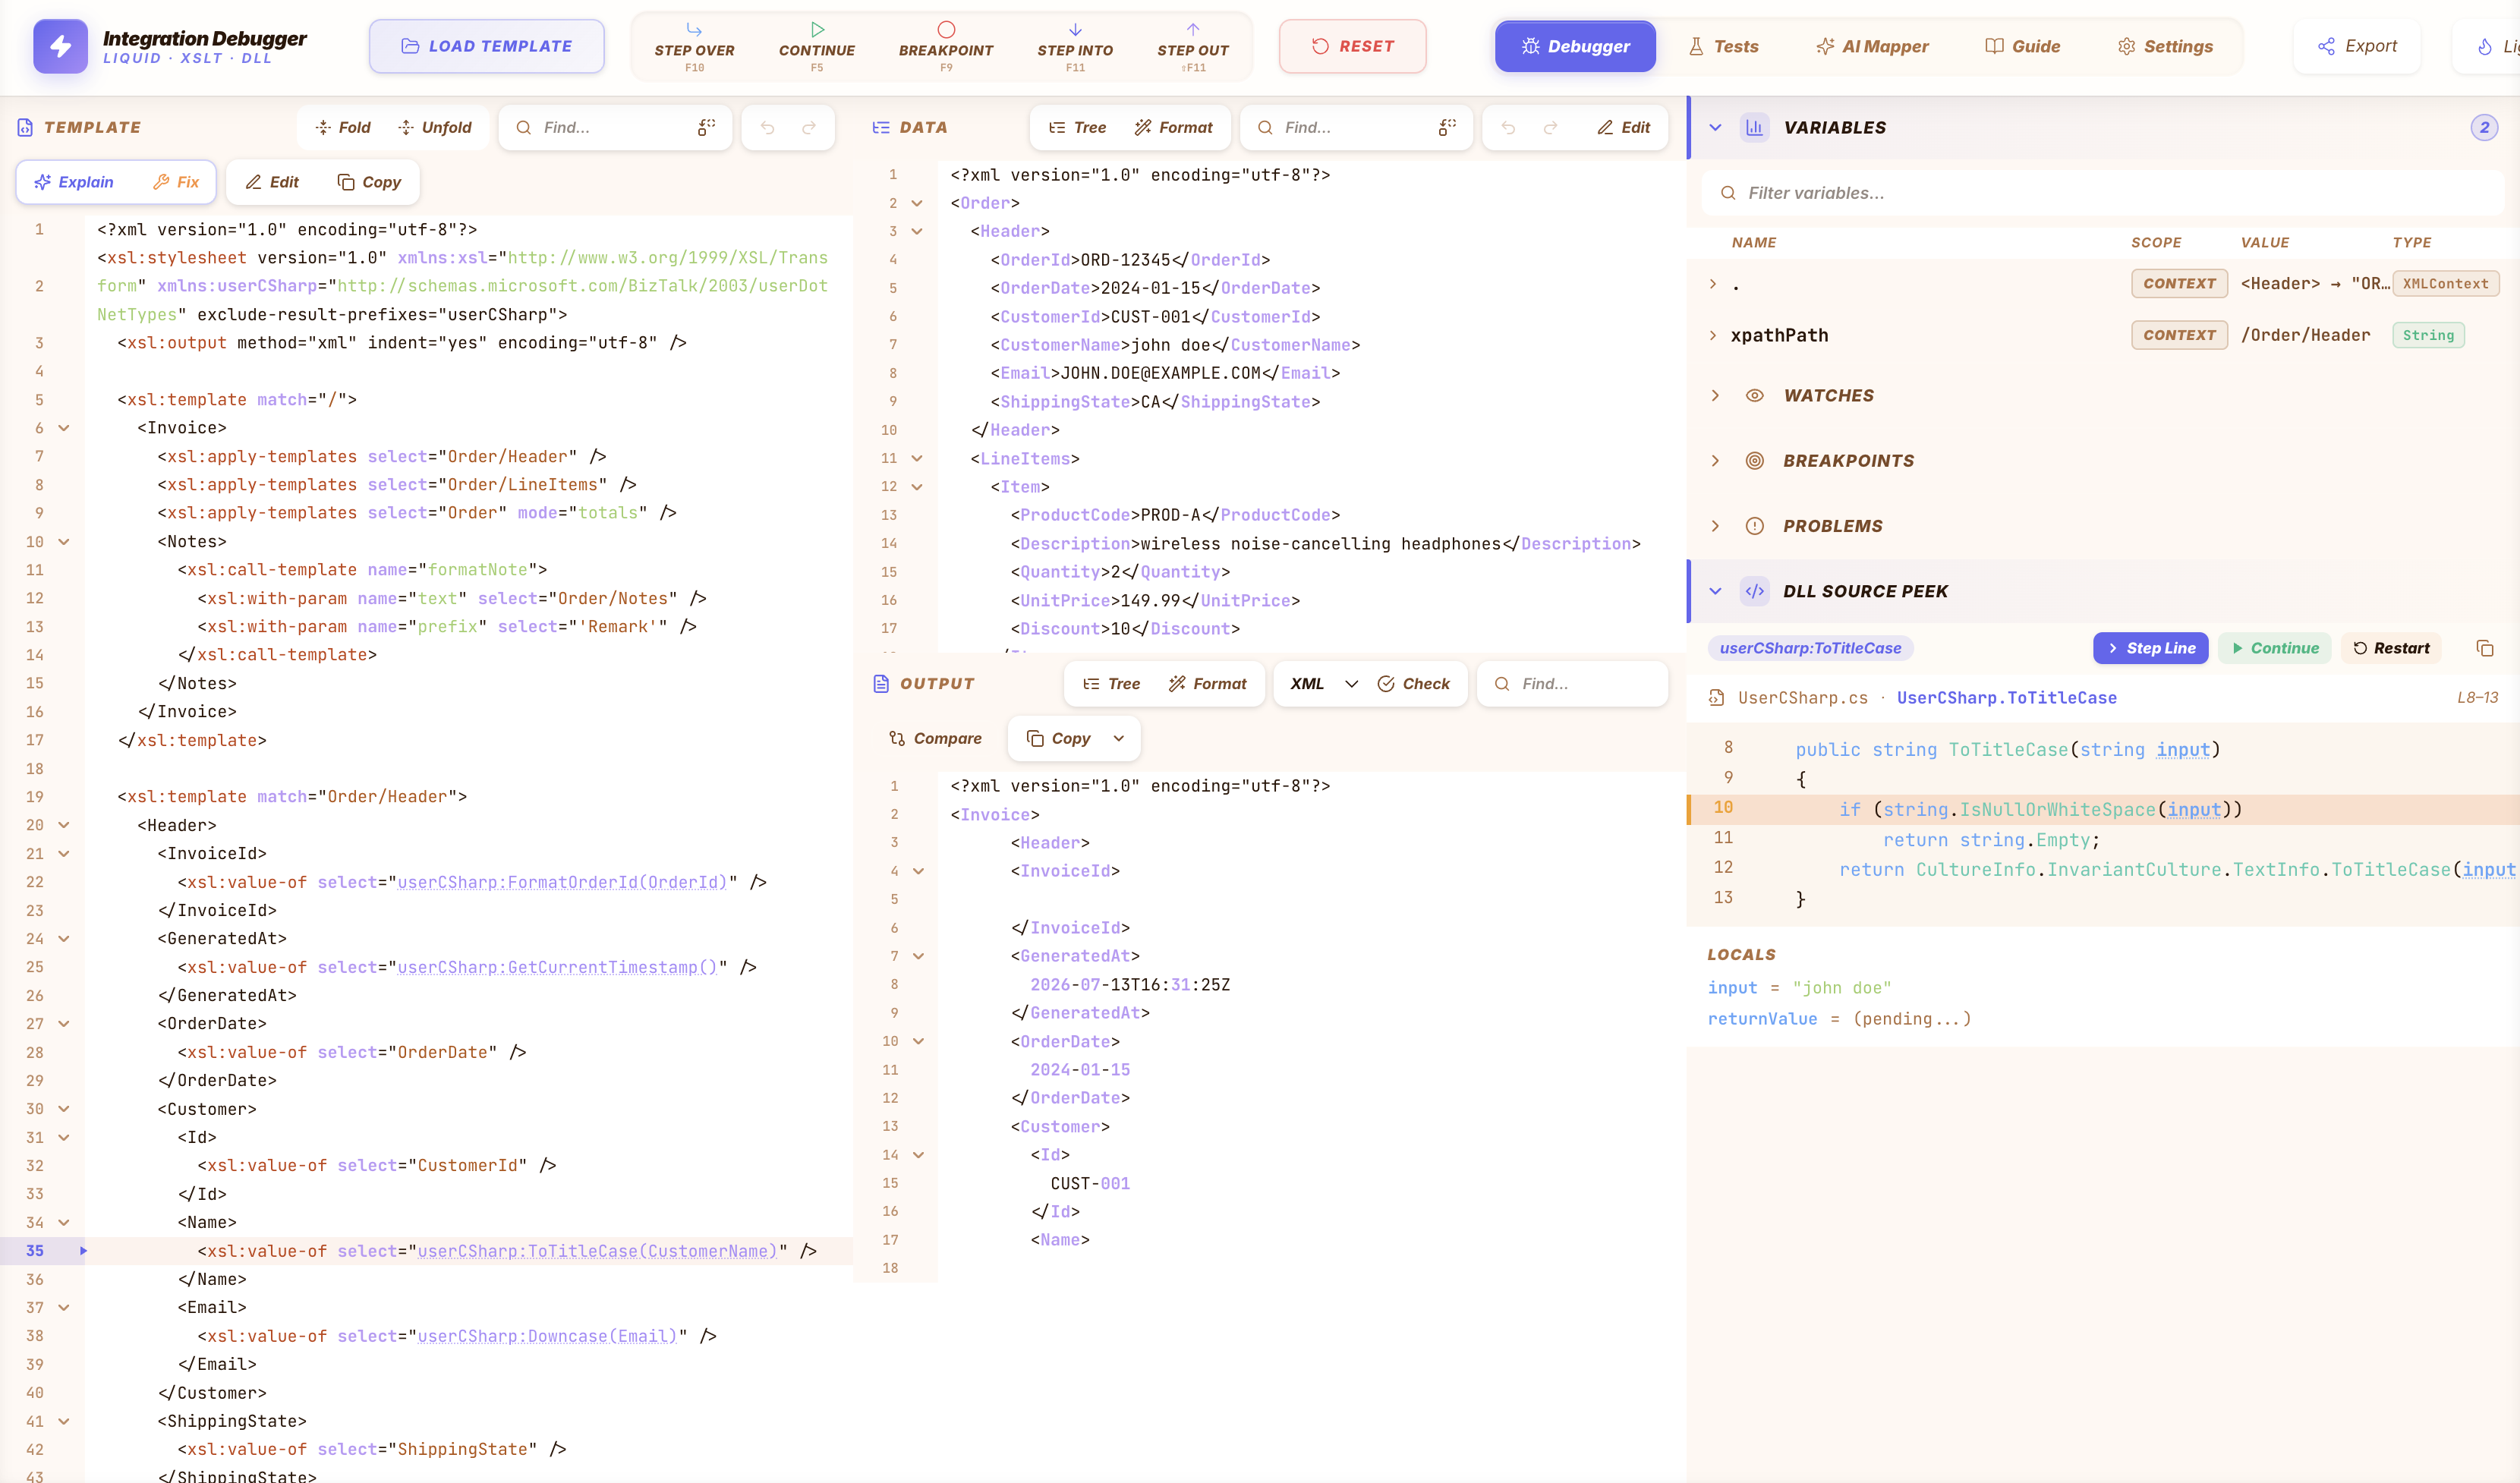
DLL Source Peek — execution paused inside userCSharp:ToTitleCase, decompiled C# source shown alongside live locals, with the XSLT template, XML data, and output all visible in the same session.
First run: A self-contained runner is compiled once using the .NET SDK on your machine (supports .NET 8, 9, 10, 11+). After that, no SDK or runtime is required for any subsequent session.
Supported DLL Assemblies
| Assembly type |
Support |
| .NET 8 / 9 / 10 / 11 |
✅ Full |
| .NET Standard 2.0+ |
✅ Full |
| .NET Framework 4.x |
✅ Reflection via MetadataLoadContext |
msxsl:script inline C# |
✅ Shown and stepped |
userCSharp: namespace |
✅ BizTalk Scripting functoid support |
Variable Inspector & Watch Expressions
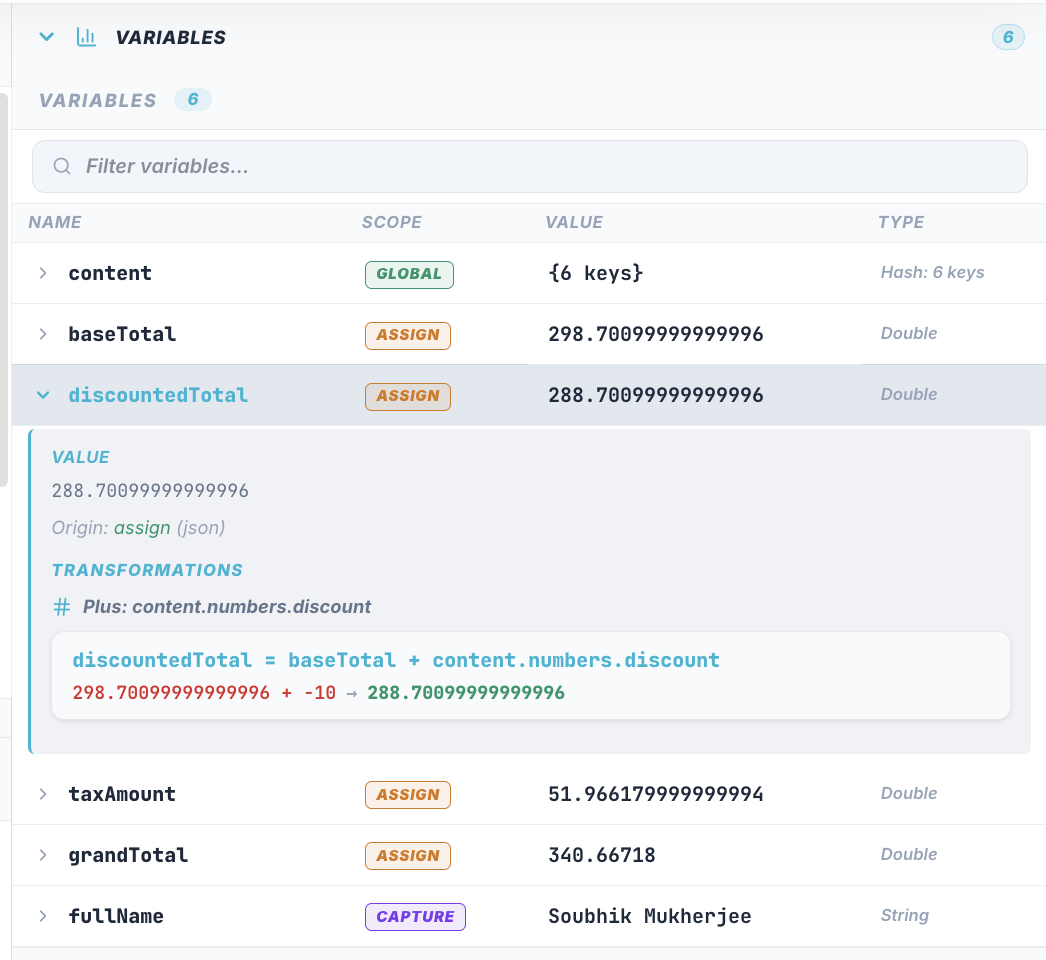
Variable state tracking — every scope, every step
|
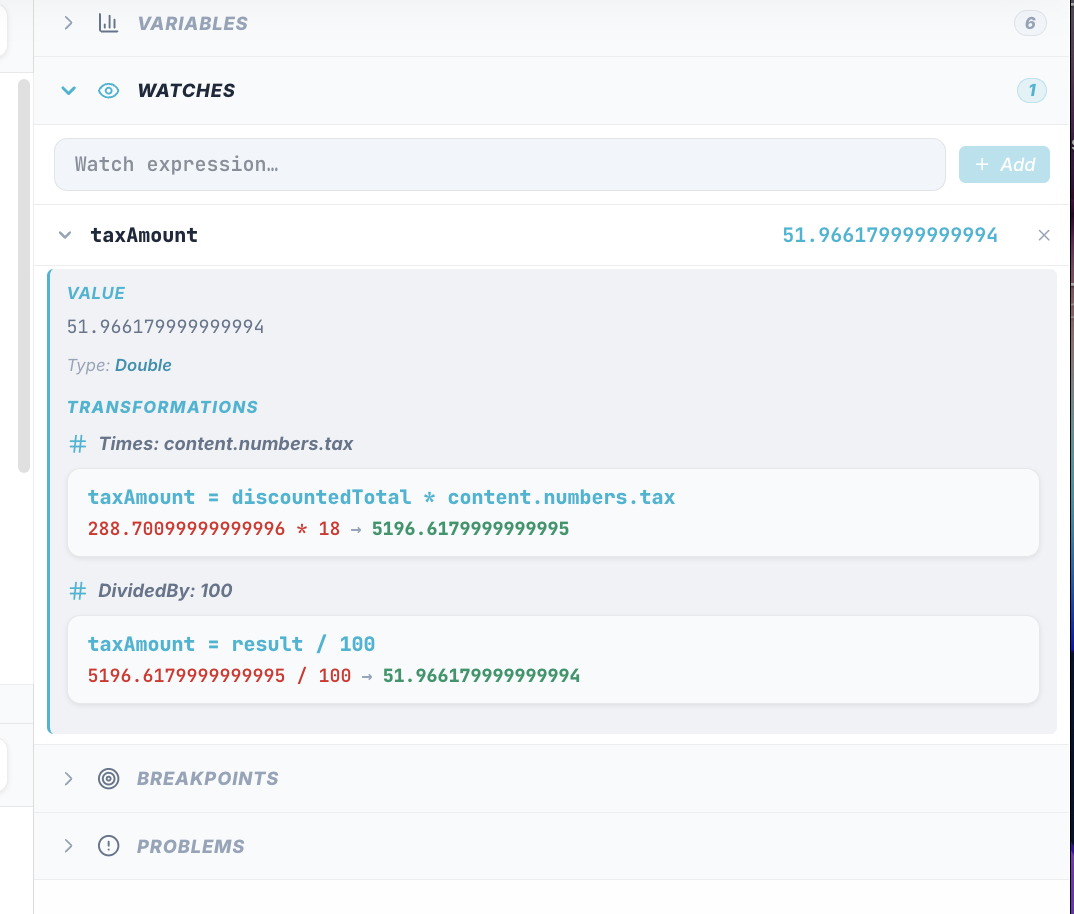
Real-time watch expressions
|
AI Mapper
Generate production-ready Liquid or XSLT templates from plain-English descriptions using Google Gemini. Describe your mapping, click Generate — the template loads directly into the debugger for immediate validation.
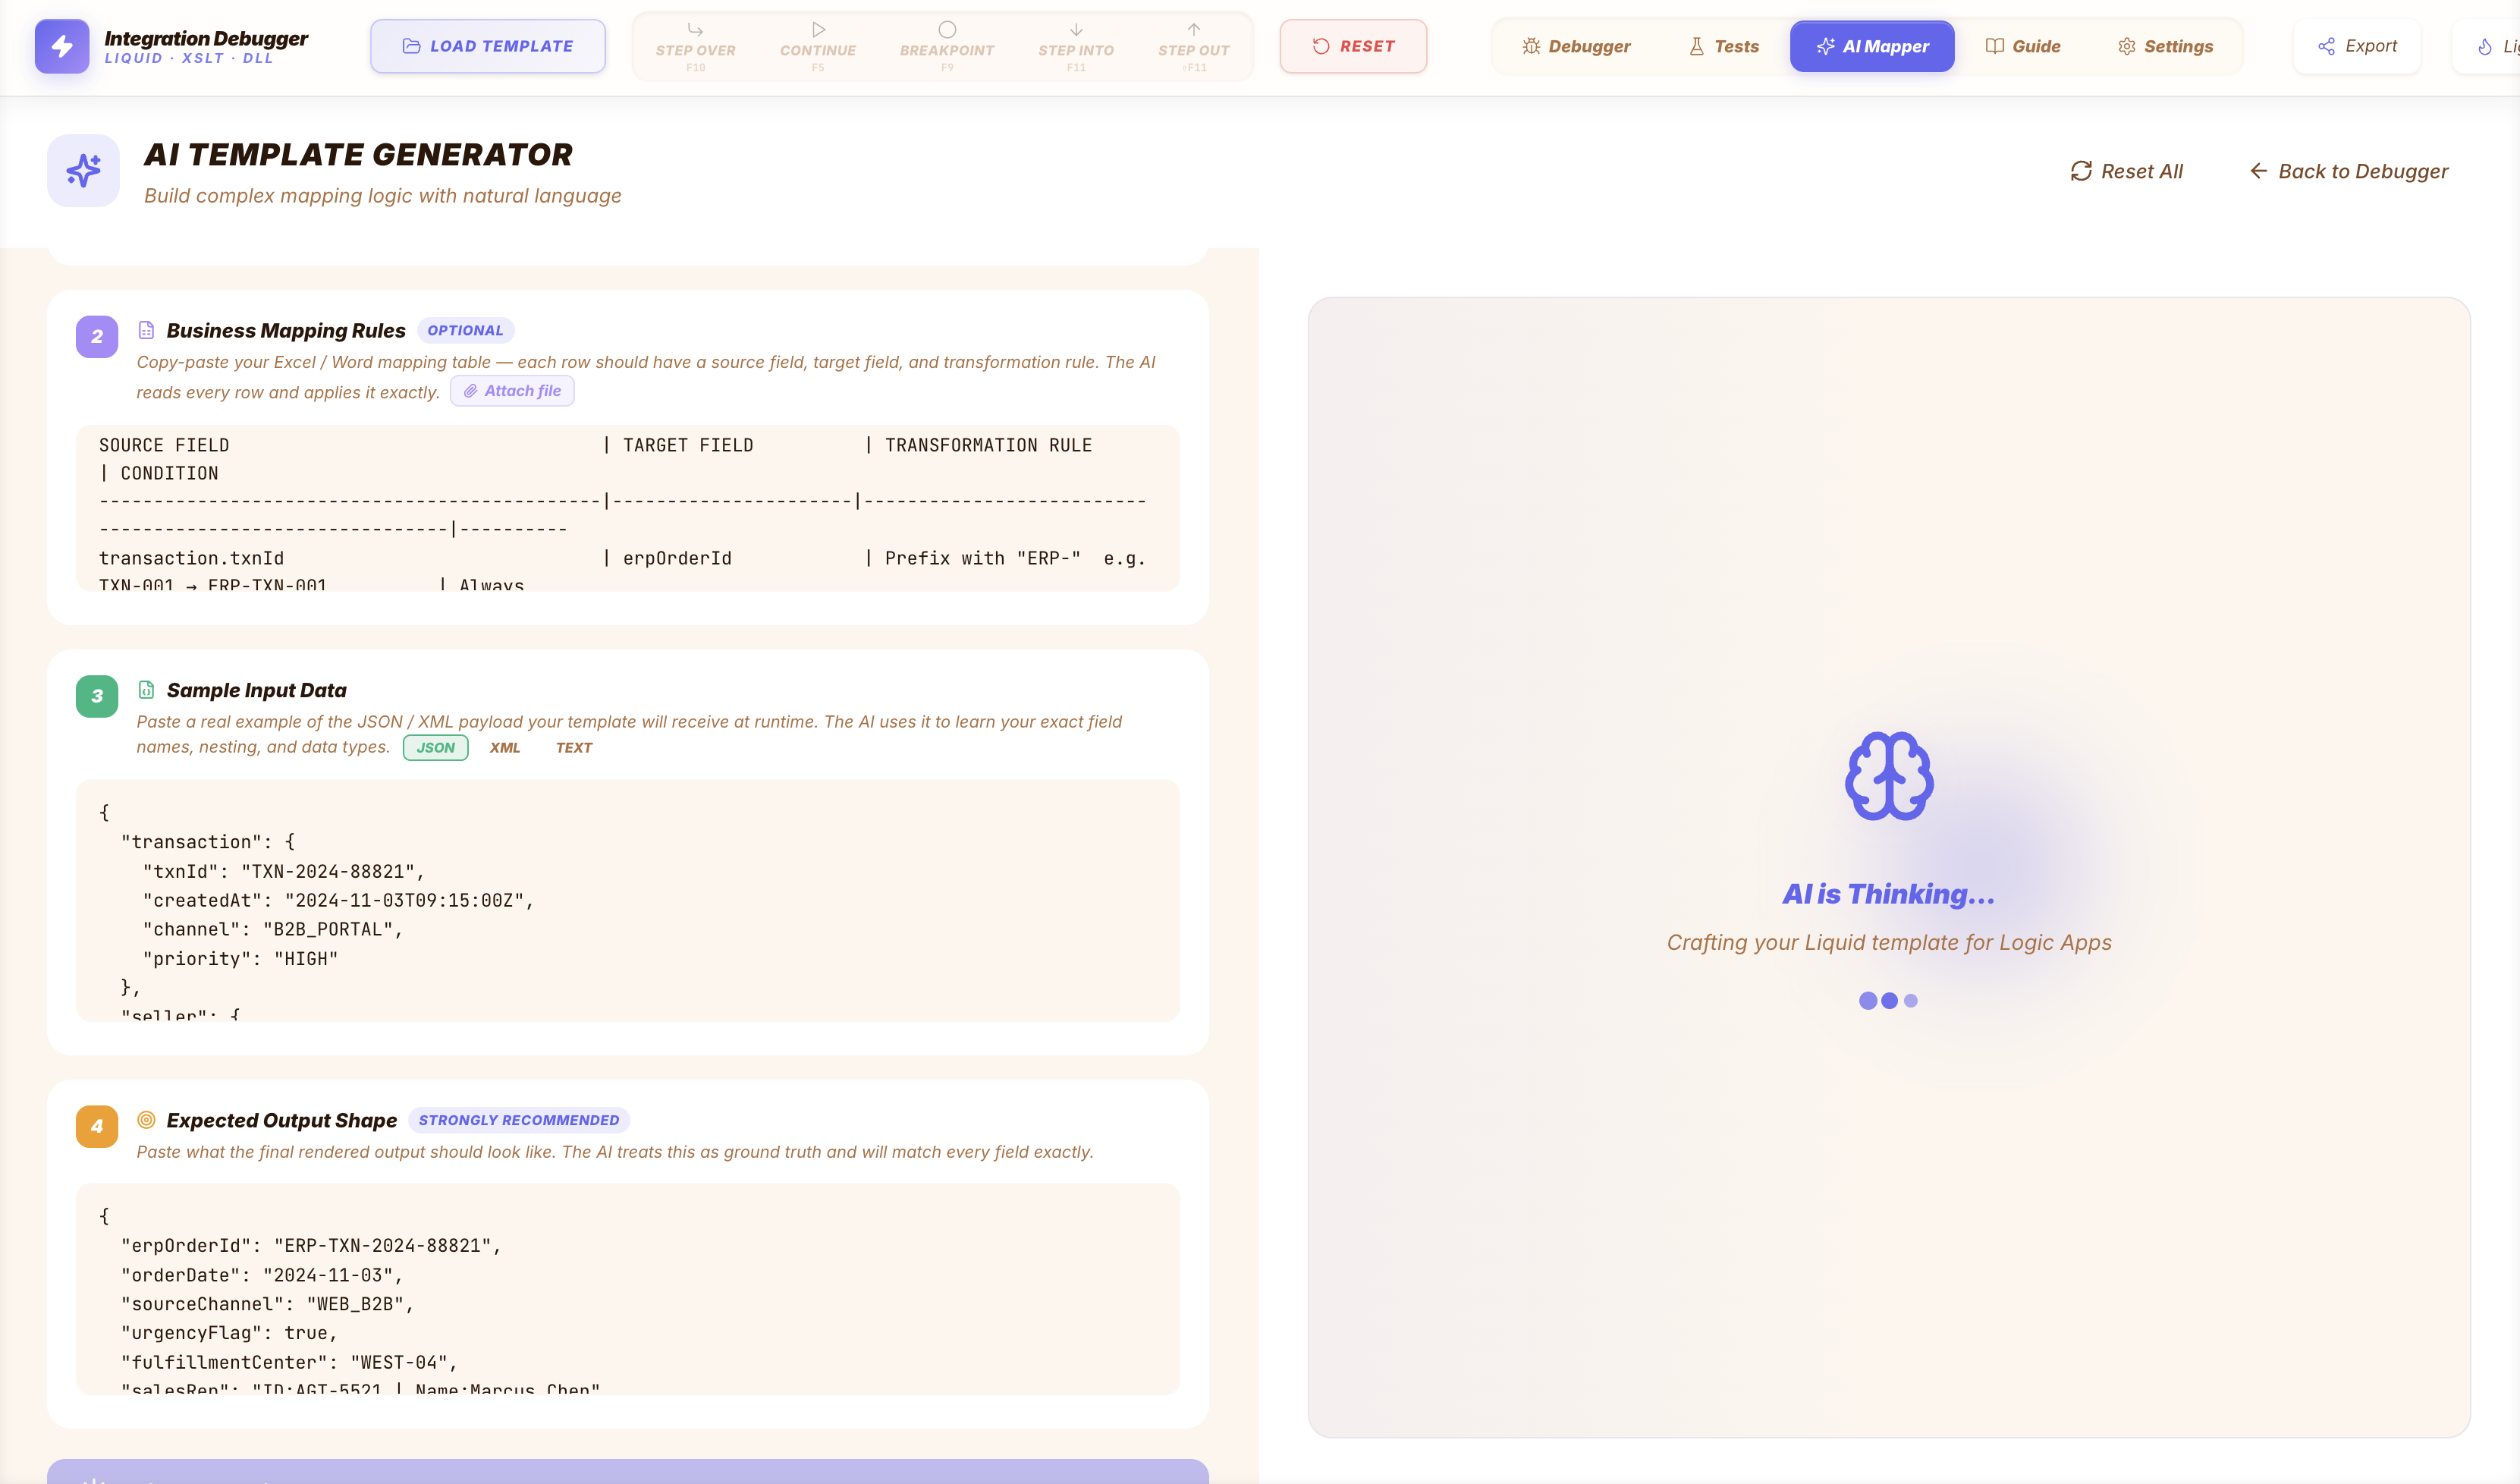
Business mapping rules + sample input + expected output — AI generating the template
|
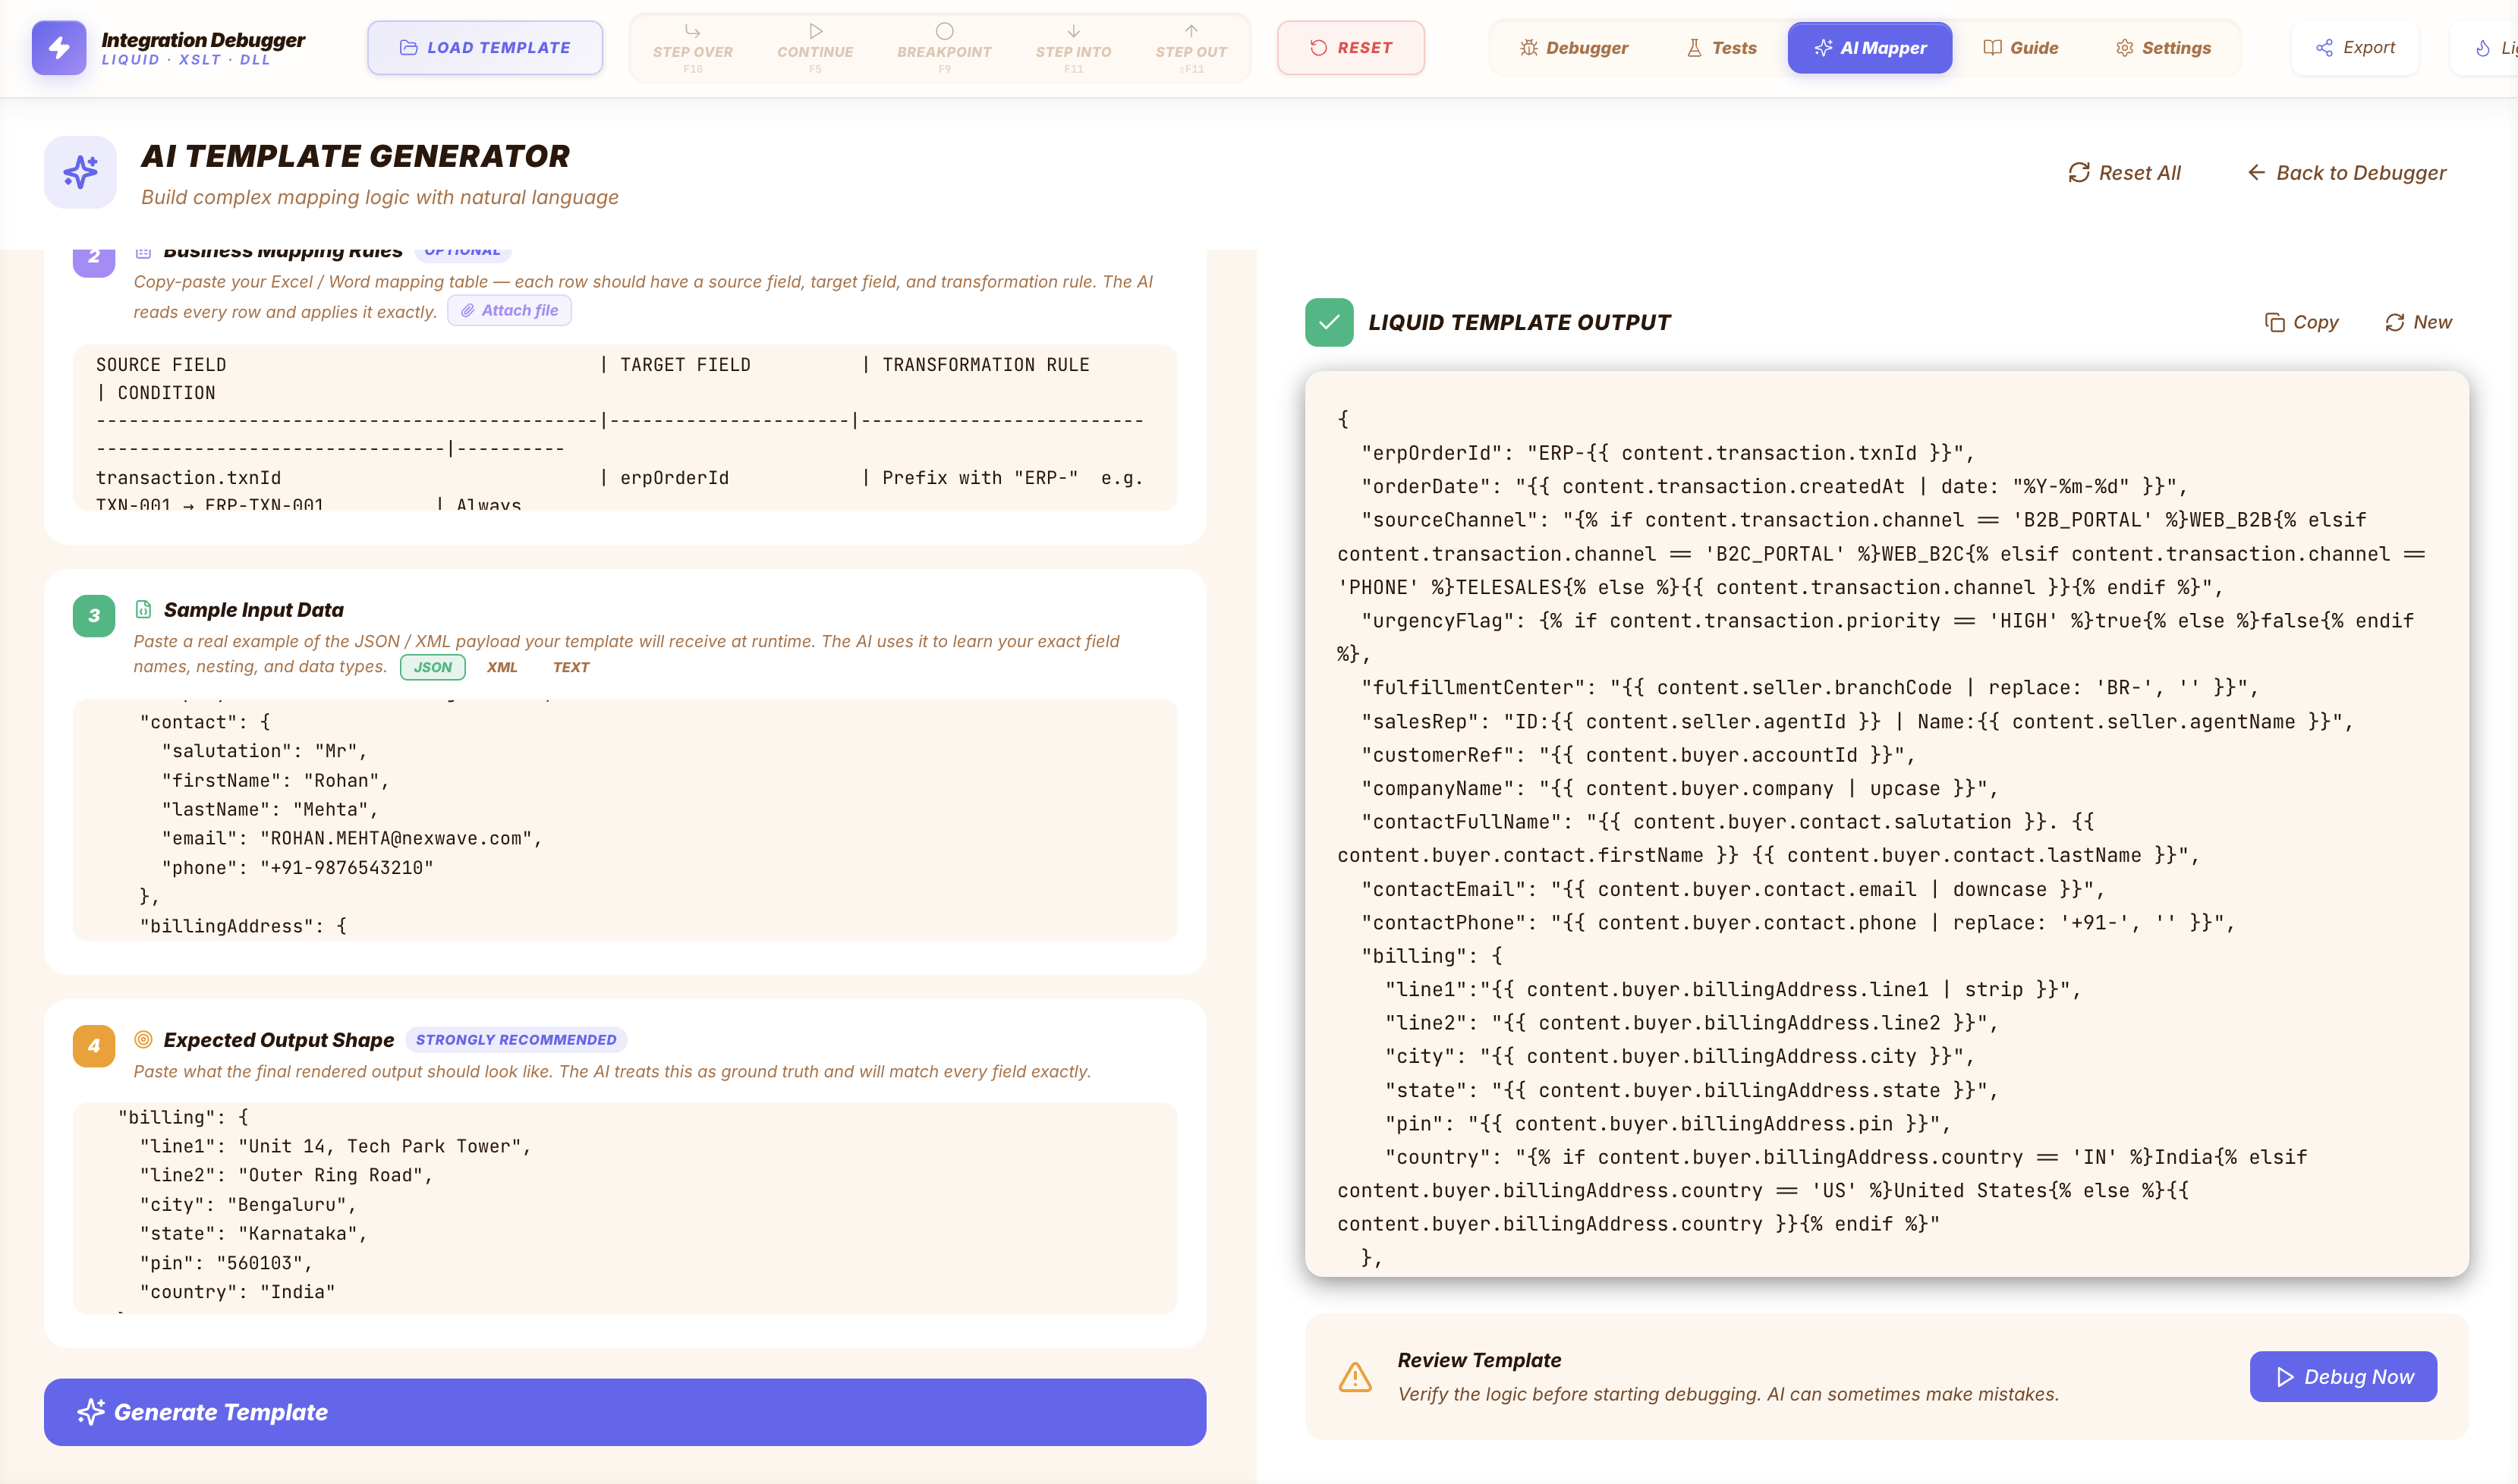
Generated Liquid template, ready to review and debug
|
AI features:
- Generate — describe the mapping in plain English; get a working template back
- Explain — plain-English explanation of any loaded template
- Fix — AI detects errors and proposes a corrected version; Apply in one click
- Multi-turn continuation — very long templates are auto-continued and stitched across multiple model responses
- Model selection — choose any available Gemini model; defaults to
gemini-2.0-flash
- Strictly opt-in — the extension is fully functional without an API key; AI features are disabled until you enable them
Built-in Integration Guide
A fully searchable reference — no browser tab needed. Switch between Liquid, XSLT, and XSLT+DLL with a single click.
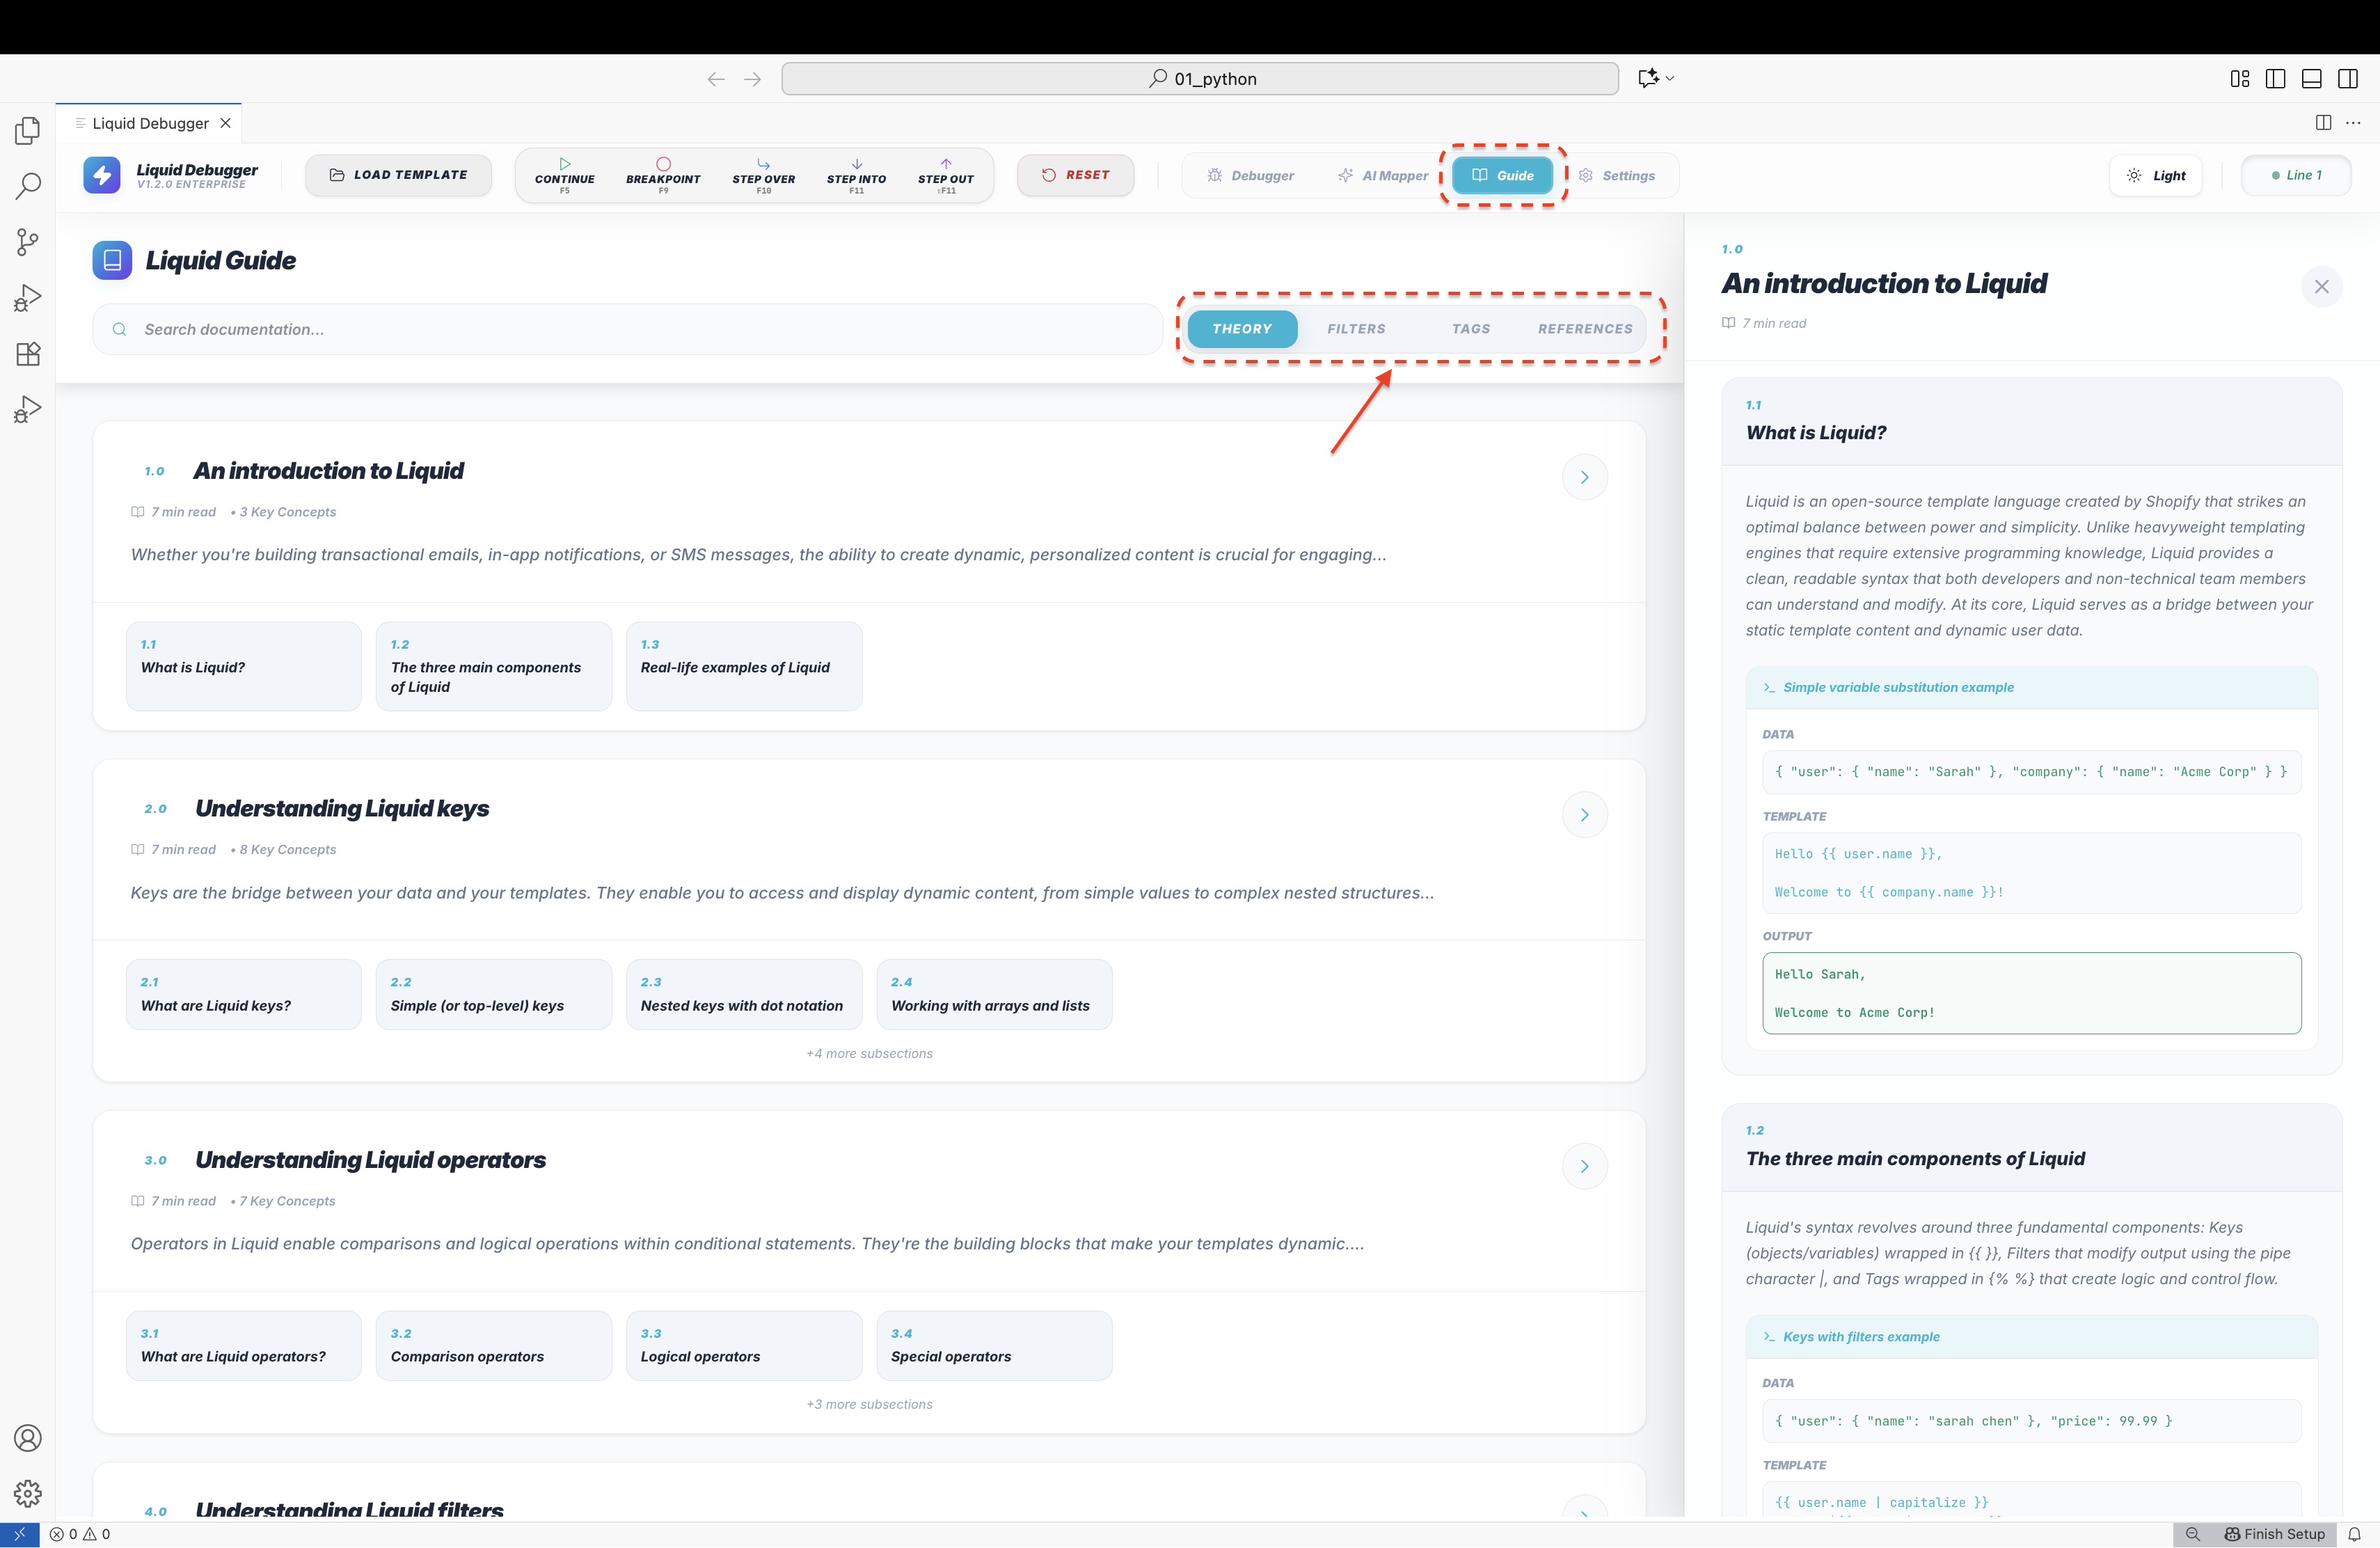
| Section |
Liquid |
XSLT |
XSLT+DLL |
| Theory |
Syntax, filters, tags, scoping |
XPath, template rules, variables |
Extension functions, DLL loading, BizTalk patterns |
| Reference |
All filters with I/O examples |
All xsl: elements with examples |
C# signatures, AddExtensionObject, msxsl:script |
| Patterns |
Common transforms |
Identity, Muenchian grouping, lookup tables |
Date formatting, currency rounding, regex, Base64, node splitting |
Themes, Languages & Accent Colors
Nine premium visual themes — all UI sizes scale with VS Code's font size setting:
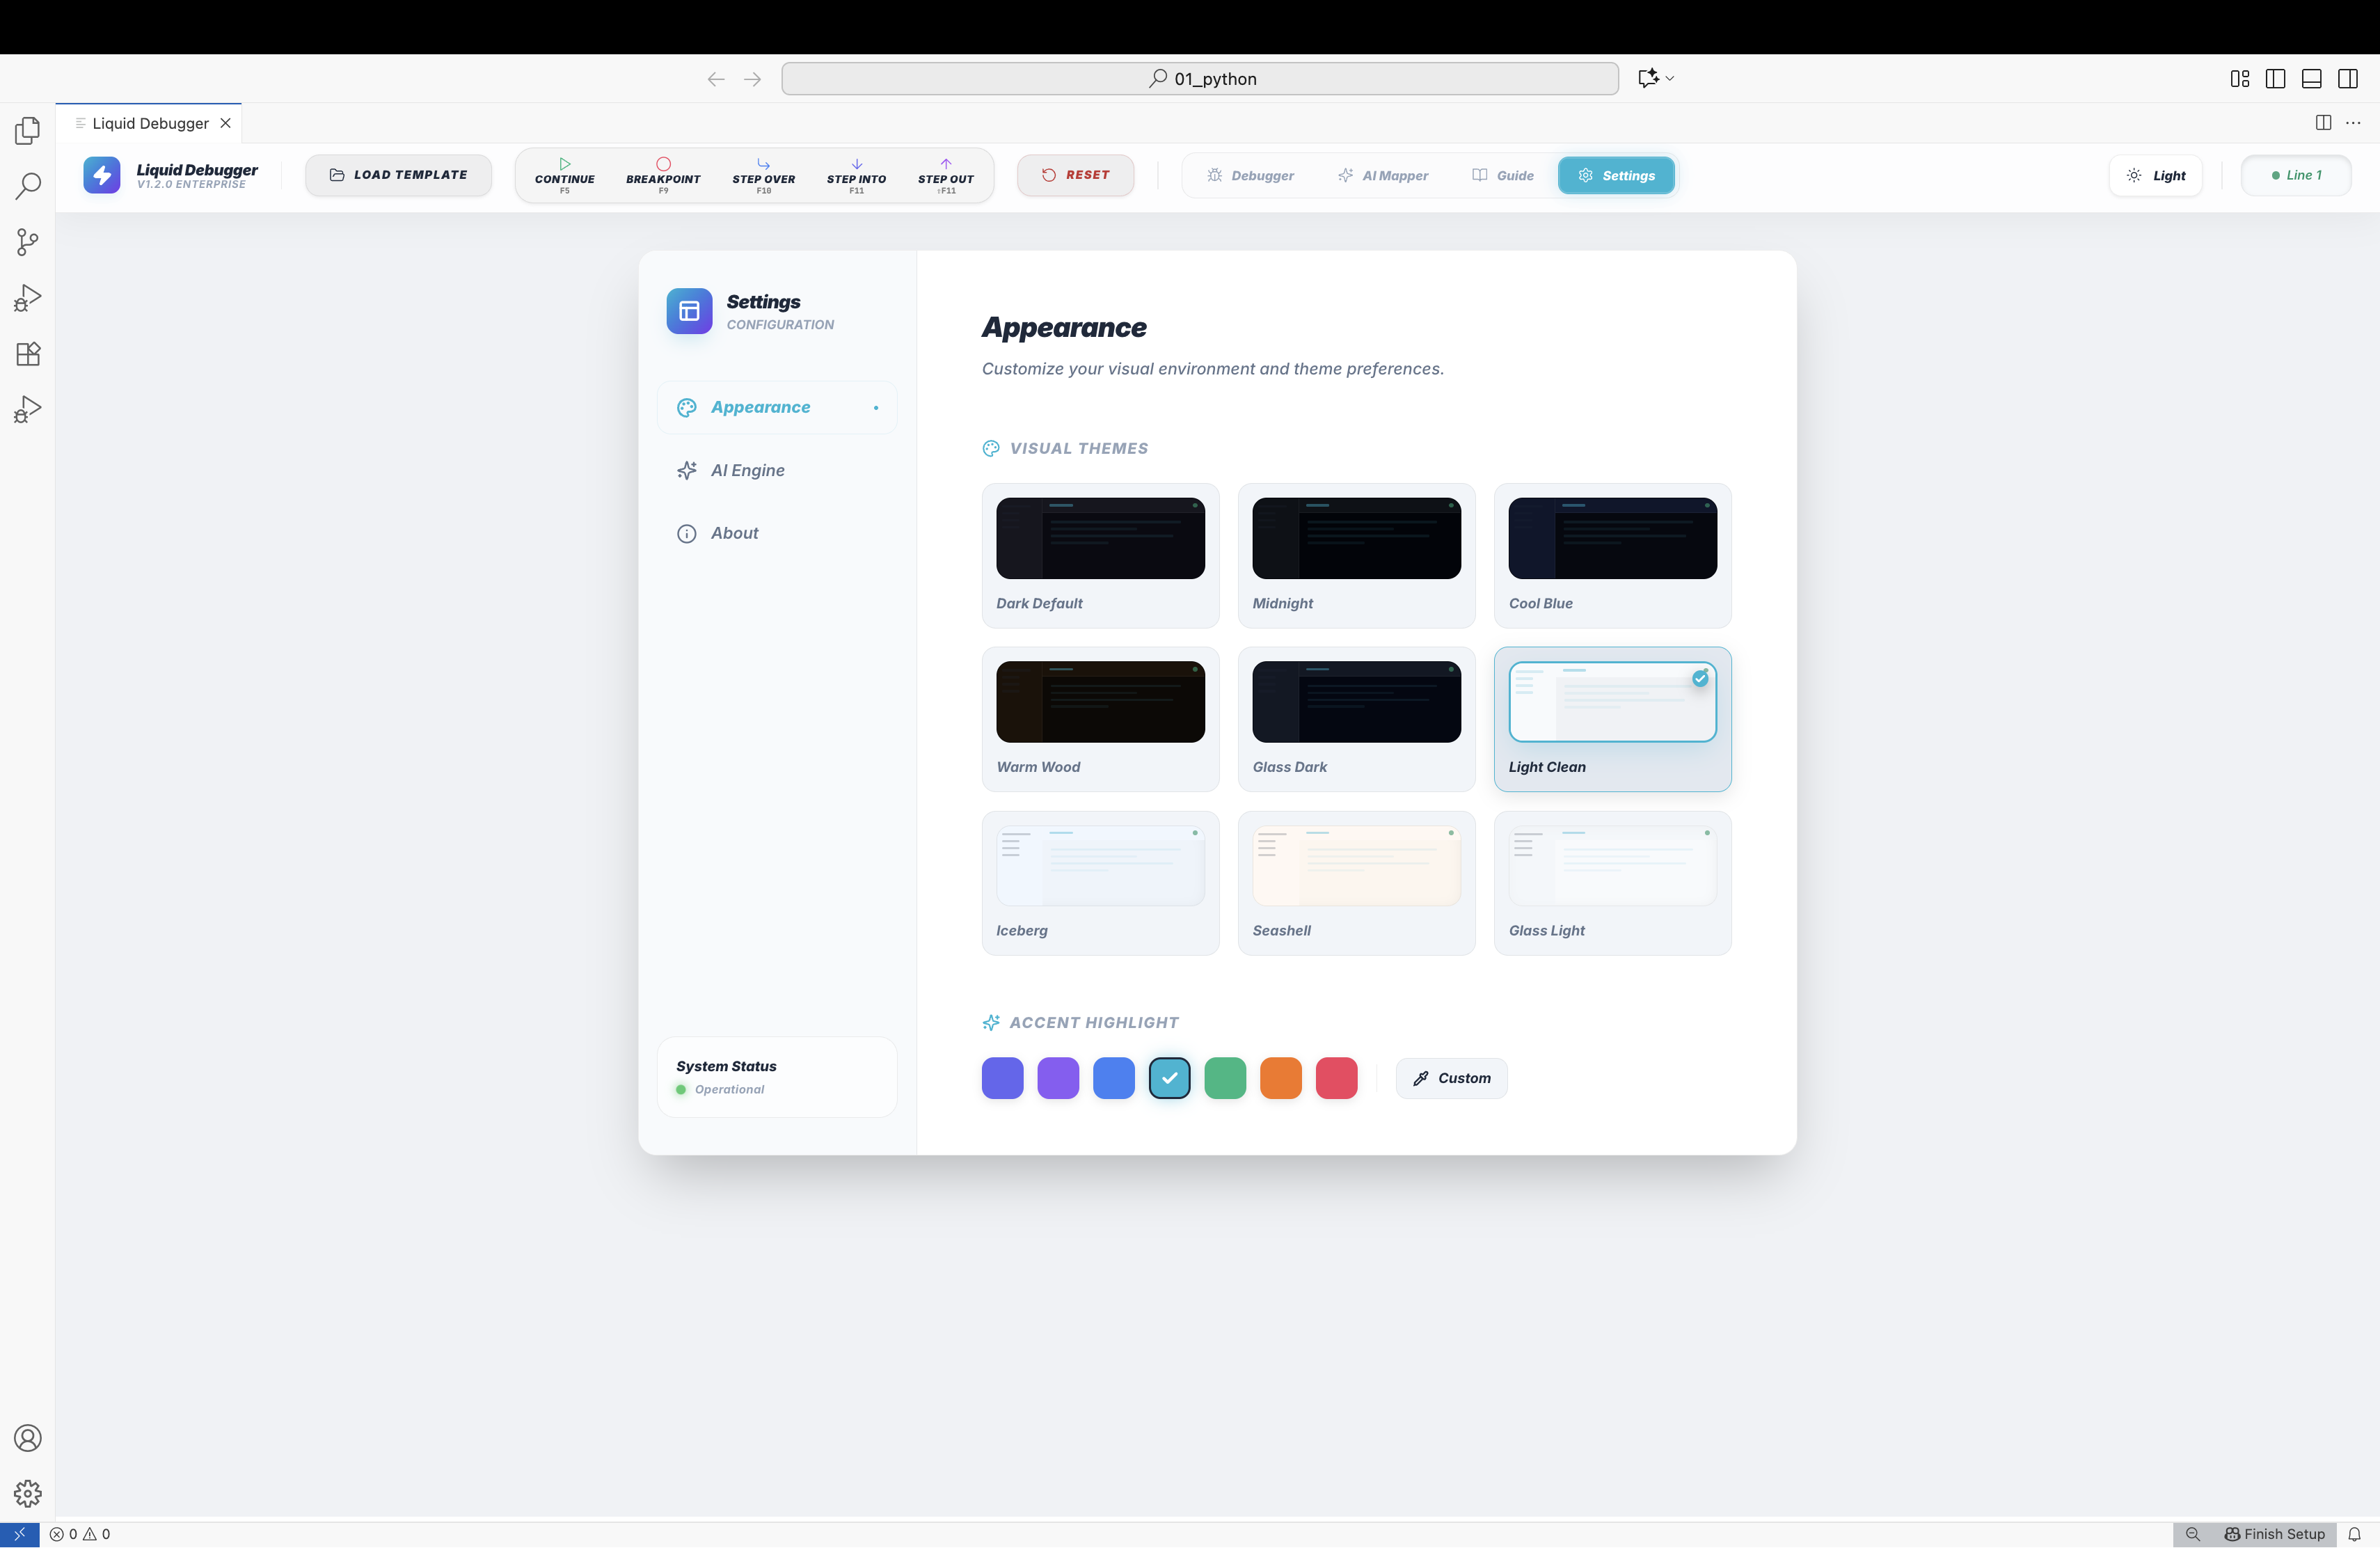
Themes: Dark Default, Midnight, Cool Blue, Warm Wood, Glass Dark, Light Clean, Iceberg, Seashell, Glass Light
Accent colors: Indigo, Violet, Blue, Cyan, Emerald, Orange, Rose — plus a custom hex color picker
Languages: English, 中文 (简体), 中文 (繁體), Español, Français, Deutsch, 日本語, 한국어, Português (Brasil), العربية — auto-detected from VS Code locale, manually switchable in Settings → Language
🔒 Security & Privacy
- Everything runs locally — All template evaluation, XSLT transformation, and DLL reflection happen inside the VS Code extension host process. No remote servers or cloud execution.
- No client data leaves your environment — Your templates, input data, and output are processed entirely on your machine and are never transmitted anywhere.
- Safe for sensitive business transformations and enterprise workflows — Perfect for production data, customer records, PII, financial figures, and proprietary business logic.
| Guarantee |
Detail |
| Runs entirely locally |
All template evaluation, XSLT transformation, and DLL reflection happen inside the VS Code extension host process. No remote servers, no cloud execution. |
| No data leaves your machine |
Template content, input data, and output are never transmitted anywhere — not even to Microsoft or Anthropic. |
| AI is strictly opt-in |
The AI Mapper feature is disabled by default. It only activates when you explicitly enable it and provide your own API key for the provider you choose — Gemini or IBM watsonx. Without a key, no data is ever sent to any AI service. |
| API key in SecretStorage |
If you use the AI Mapper, your provider credentials (Gemini API key, or IBM watsonx IAM API key + Project ID) are stored in VS Code's encrypted SecretStorage — never in settings.json, workspace files, or logs. |
| Sensitive data stays local |
Safe to use with production data, customer records, PII, financial figures, and proprietary business logic. Nothing is uploaded, cached, or indexed externally. |
| DLL reflection without execution |
.NET assemblies are introspected using MetadataLoadContext — a read-only reflection API. Assembly code is never executed on your machine during reflection; only the XSLT runner calls extension methods in an isolated subprocess. |
| Content Security Policy |
The VS Code webview panel runs under a strict CSP; inline scripts and external network requests are blocked. |
| No telemetry |
The extension collects no usage data, crash reports, or analytics of any kind. |
Safe for sensitive enterprise workflows — Liquid maps, XSLT transformations, BizTalk Maps, and DLL assemblies that contain business-critical logic can be debugged without any risk of data exposure.
Supported Files
| Extension |
Mode |
Notes |
.liquid .html |
Liquid |
DotLiquid dialect — Azure Logic Apps compatible |
.xsl .xslt |
XSLT |
1.0, 2.0, and 3.0 — version auto-detected |
.btm |
XSLT + DLL |
BizTalk Map — format auto-detected |
.dll |
XSLT + DLL |
.NET Standard 2.0+, .NET 8/9/10/11, .NET Framework |
.json .xml .csv .txt |
Input data |
All modes |
Requirements
| Requirement |
Notes |
| VS Code 1.85+ |
Always required |
| .NET SDK 8 / 9 / 10 / 11+ on PATH |
XSLT+DLL mode only — first run to compile runner; not needed after |
| Gemini or IBM watsonx API key |
AI Mapper only — strictly opt-in |
launch.json Examples
Liquid:
{
  "version": "0.2.0",
  "configurations": [
    {
      "type": "liquid",
      "request": "launch",
      "name": "Debug Liquid Template",
      "template": "${file}",
      "data": "${workspaceFolder}/data.json",
      "format": "json"
    }
  ]
}
XSLT:
{
  "version": "0.2.0",
  "configurations": [
    {
      "type": "liquid",
      "request": "launch",
      "name": "Debug XSLT Map",
      "template": "${file}",
      "data": "${workspaceFolder}/input.xml",
      "format": "xml"
    }
  ]
}
Support
Built with ❤️ by BlueWave Innovators Team and Bob — enterprise integration developers who debug XSLT and Liquid for a living.
| |

