

Welcome to Connext Studio (Experimental Release)
Connext Studio brings Connext system insight directly into your IDE by helping you inspect, visualize, and debug Connext applications during development. You can interact with Connext Studio through the Studio UI or through chat interfaces, including Connext Chat and GitHub Copilot Chat in Ask mode or Agent mode. The Studio UI is organized around two basic concepts: Data Sources and Views. Data Sources provide information about your running DDS system, which Connext Studio uses to build an in-memory system model. Views present the system model and live Topic data through predefined System and Security Views and custom system-model and Topic-data Views. With the optional Connext AI features, you can describe a custom View in natural language and let Connext Studio generate it; running built-in or previously generated Views does not require Connext AI. If you wish to learn about Connext Studio through instructor-led video training, you can now watch the Connext Studio video training series on RTI Academy. RequirementsTo use Connext Studio, you need the following:
Connext Studio also installs and maintains its own Connext Components to discover and inspect your running DDS system. These components are separate from your development installation and require a Connext license. See Connext Components for the setup and update workflow. In addition, some chat commands may require additional third-party extensions. For example, the [Optional] Connext AI-Powered FeaturesConnext AI features and integrations with AI agent harnesses are optional. The core Connext Studio can be used without AI. The optional AI-powered features and agent integrations included with Connext Studio are:
You can fine-tune which AI capabilities and integrations are active through the AI Features section in the Settings pane. Each feature group can be individually enabled or disabled and includes a data flow note explaining where your data is sent when that feature is used. Studio PanelTo open the Studio panel, click the Studio icon on the left sidebar, as shown below: 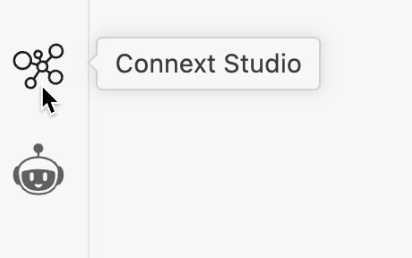
Login and Welcome ScreensLogin with your RTI account is required to use Connext Studio. (See the Requirements section above to get an RTI account.) If you are not logged into Connext Studio, a Login Screen is shown. 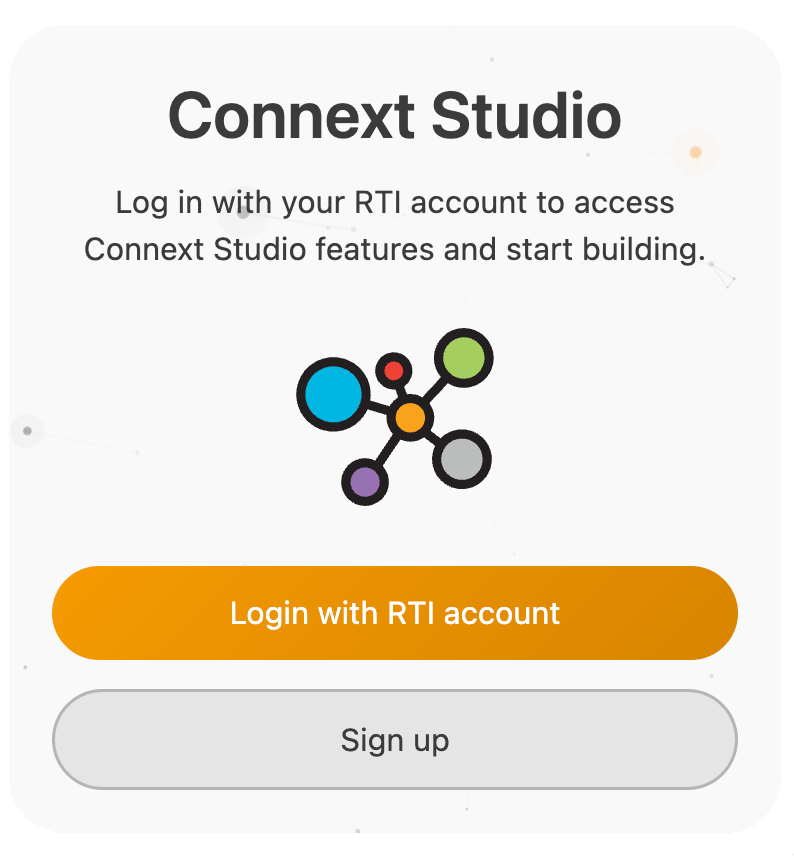
Once logged in, Connext Studio presents an onboarding Welcome Screen when a development installation or its license still needs to be configured. You can select an existing Connext Professional or Connext Drive installation, including the Connext version and RTI Architecture. This selection is used for development tools such as RTI Launcher and RTI Admin Console; Studio uses its separate Connext Components for DDS Spy Data Sources and locally managed Collector Service Lite instances. If you do not have Connext Professional or Connext Drive installed already, the Welcome Screen helps you download and install an evaluation version of Connext, and helps you install an evaluator license file. 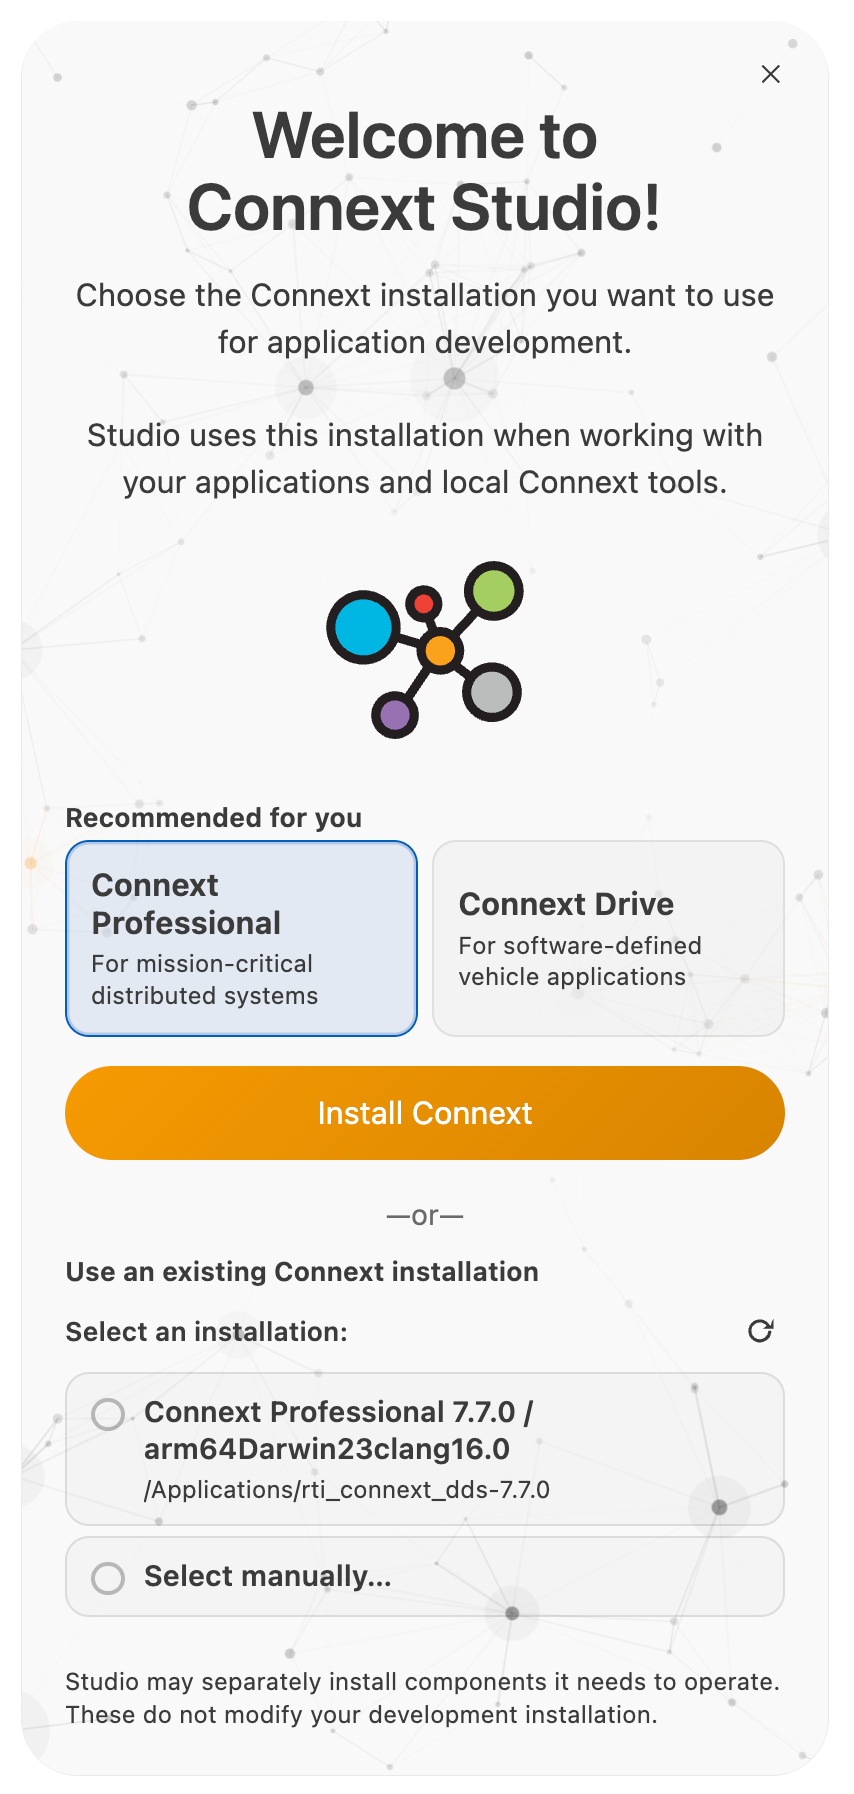
You can skip onboarding, but features that depend on an installation or license remain unavailable. Select Show Welcome Screen under General in the Settings pane to restart onboarding at any time. Connext ComponentsThe Connext Components setup screen appears automatically when Studio needs to install or update its required components, or when their license needs attention. It normally follows development installation and license setup in the Welcome Screen. If the required components and license are already configured, Studio opens without prompting you to install them again. These components provide RTI DDS Spy for live discovery and Collector Service Lite for locally managed Collector Service instances. Studio manages the component version it needs for your platform and architecture. Installing or updating these components does not modify your development installation or change its selected version. You do not need to upgrade your development installation just to update Studio's components. 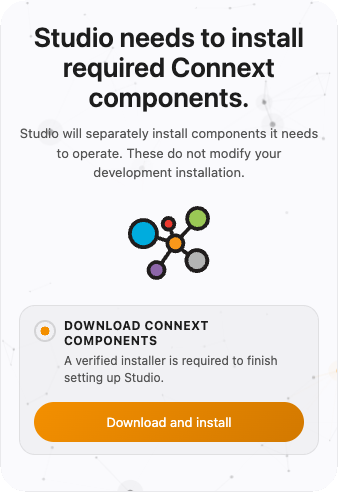
Data SourcesData Sources are inputs you connect, which Connext Studio uses to build a model (i.e., an in-memory representation) of your Connext system. You can connect more than one Data Source, which may help Connext Studio build a more complete model of your system than if it had access to only one Data Source. The supported Data Sources include: You can also connect Data Sources from the cloud. If you have a Connext Cloud account, see Connext Cloud Integration below. To connect a Data Source, click the + icon in the Data Sources pane: 
After clicking the + button, select the desired Data Source from the list and follow the on-screen prompts: 
Data Source Capabilities
RTI DDS SpyThe RTI DDS Spy Data Source connects to a live Connext system using RTI DDS Spy. Connext Studio runs DDS Spy locally and uses the discovered information to build a model of your system. Use this Data Source when you want Connext Studio to discover Hosts, Applications, DomainParticipants, Topics, Publishers, Subscribers, DataWriters, DataReaders, and QoS information directly from a running development system. DDS Spy can discover Connext Professional applications and Connext Micro applications that use DPDE (Dynamic Participant, Dynamic Endpoint Discovery). Type information is not available for Connext Micro applications because Connext Micro does not publish type information through discovery. You can also create an RTI DDS Spy Data Source from a previously saved DDS Spy discovery log file instead of connecting to a live system. This produces an offline (historical) source that Connext Studio builds its model from, which is useful when you want to analyze a captured discovery session without a running DDS domain or a local Connext installation. Collector ServiceThe Collector Service Data Source connects to discovery-related telemetry data published by RTI Collector Service and uses it to build a model of your Connext system. It supports Connext Professional 7.7.0 or later applications with Monitoring Library 2.0 enabled and configured to forward telemetry to Collector Service. Monitoring Library 2.0 is dynamically loaded by default when its shared library is available. Applications that statically link Connext must explicitly link the compatible static Monitoring Library 2.0 library and enable and configure Monitoring Library 2.0. Connext Micro applications are not supported by this Data Source. It operates in two modes:
Use this Data Source when your system is configured to forward remote debugging data through Collector Service, or when you want Connext Studio to run its own local Collector instance to observe a DDS domain. The Collector Service configuration required by Connext Studio for external instances is the same configuration used by RTI Admin Console remote debugging. The Collector Service instance must be configured with a WebSocket exporter endpoint. Depending on your security configuration, the connection uses either a non-secure WebSocket endpoint or a secure WebSocket endpoint. For more information about configuring Collector Service for remote debugging, see the RTI Admin Console Remote Debugging documentation. Note: The Collector Service Data Source only uses the remote debugging data exposed by Collector Service through its WebSocket endpoint. It does not currently provide access to telemetry stored in Prometheus, Loki, or other third-party observability backends. RTI Admin Console Discovery Export FileThe RTI Admin Console discovery export file Data Source imports a discovery snapshot previously exported from RTI Admin Console. Use this Data Source when you want to analyze a system offline, share a captured discovery view, or inspect a system without connecting Connext Studio directly to the running DDS domain. The Admin Console discovery export file provides system topology, information available through the built-in Topic endpoints, including Publication, Subscription, and DomainParticipant information, and type information when discovered and retained in the export. Supported applications and available detail depend on what Admin Console discovered and retained in the exported snapshot. Note: Logs collected through RTI Distributed Logger may be included in an Admin Console discovery export file. Connext Studio ignores these logs and does not import them. This Data Source is useful when the system is no longer running, when direct network access to the DDS domain is not available, or when you want to preserve a point-in-time view of the system for later analysis. Note: You can continue to use RTI Admin Console to inspect discovery information directly. Loading an Admin Console discovery export file into Connext Studio is useful when you want to use Connext Studio capabilities on that captured system model, including AI-powered querying and analysis using Connext AI. Connext Cloud Integration (Preview)Connext Cloud integration lets you browse and connect to your Connext Cloud Databuses and Observability Services directly from Connext Studio. Connected cloud resources become regular Data Sources — a Databus becomes a DDS Spy source and an Observability Service becomes a Collector Service source — so all Studio capabilities (System Explorer, Views, AI analysis, vulnerability detection) work seamlessly with cloud-sourced data.
Cloud ViewThe Cloud View panel appears in the Studio sidebar. It displays your Connext Cloud resources organized into two groups:
Each resource displays a status indicator: Active, Creating, Connecting, Provisioning, Error, or Disabled. The Cloud View auto-refreshes every 60 seconds and can be refreshed manually using the refresh button in the View header. 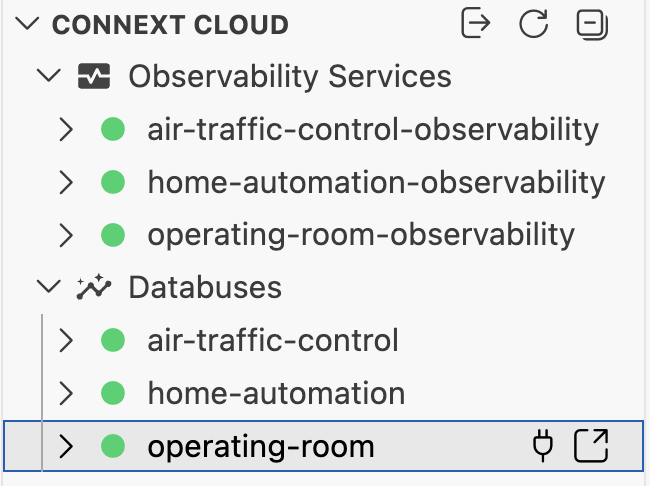
Cloud LoginConnext Cloud uses the same RTI account credentials as Connext Studio. To log in to Connext Cloud, click the Log in button in the Cloud View. This opens your browser for authentication. If you are already signed into your RTI account in the browser, you will likely not be prompted for credentials again. If this is your first time using the Cloud integration, you may be asked to accept the Preview terms before proceeding. Click Continue to Preview to open the Cloud dashboard and accept the terms, then return to Studio. 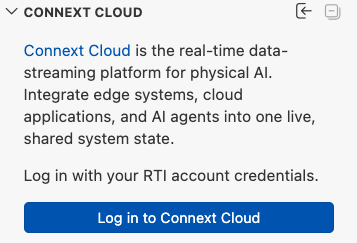
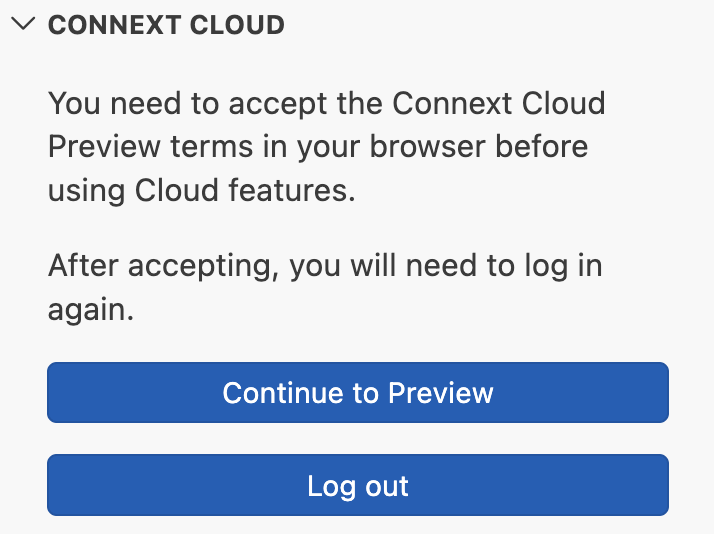
Note: Connext Cloud and your RTI Account have separate login sessions. Logging out from Connext Cloud (using the logout button in the Cloud View) disconnects your cloud resources but keeps your RTI Account session active — you can continue using other Connext Studio features. To log out completely, go to Account & Support and log out from your RTI Account, which also logs you out from Connext Cloud. Connecting Cloud ResourcesOnce logged in, you can connect any active cloud resource to Connext Studio: Connecting a Databus: Click the Connect button (plug icon) next to a Databus in the Cloud View. This creates a DDS Spy Data Source that discovers your cloud Databus. For secure Databuses, Connext Studio automatically handles the security setup — generating keys, requesting certificates from the Cloud API, and storing the security artifacts locally. No manual security configuration is required. 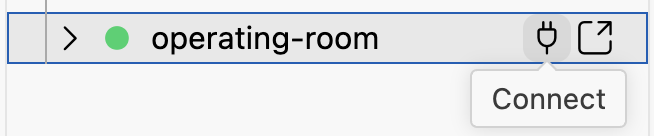
Connecting an Observability Service: Click the Connect button (plug icon) next to an Observability Service. This creates a Collector Service Data Source that streams telemetry from your cloud observability endpoint. Disconnecting: Click the Disconnect button next to a connected resource to remove the Data Source connection. 
Once connected, the cloud Data Sources appear in the Data Sources pane and contribute to the system model like any other Data Source. 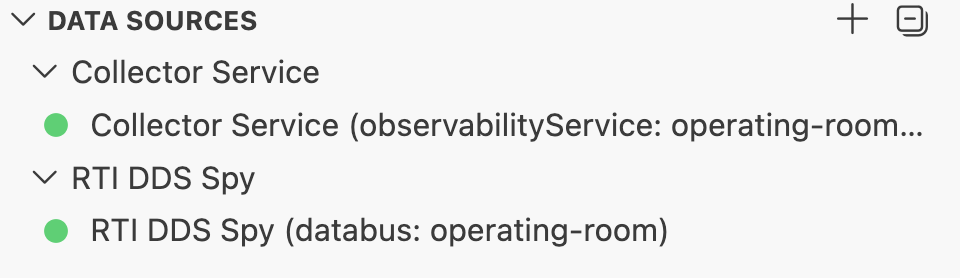
Cloud Dashboard NavigationFrom the Cloud View, you can navigate directly to the Connext Cloud dashboard:
System Explorer, Object Property and ProblemsThe System Explorer, Object Property and Connext Problems panes work together to help you navigate and inspect the model of your Connext system. The System Explorer shows the model built from the connected Data Sources. It provides a tree view that lets you browse discovered DDS entities and navigate their relationships. 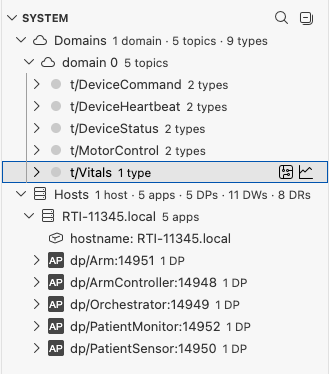
The System Explorer organizes the model from different perspectives, including:
Topic Visibility keeps RTI and DDS standard system Topics out of topology views by default so application entities remain the focus. Their checkboxes start unchecked; checking one displays that Topic and its associated DataWriters, DataReaders, and types in the System Explorer, System Block Diagram, and generated system-model Views. A Publisher or Subscriber is omitted when it has children and all of those children are invisible; childless and mixed-visibility Publishers and Subscribers remain visible. Visibility is a presentation setting only, so these entities remain available in the underlying system model. See Settings Pane to change Topic Visibility. The System Explorer identifies the origin of model data with status decorations. An empty-circle decoration and the tooltip Offline (imported data) indicate that an entity is backed only by imported data, while a half-filled-circle decoration and the tooltip Mixed (live + imported data) indicate that it combines live and imported data. Live entities show no decoration and their tooltip reads Live. When you select an entity in the System Explorer, the Object Property pane shows the properties available for that entity. For example, selecting a DataWriter may show properties such as its name, DDS GUID, QoS policies, type information (including IDL, XML, and JSON schema representations when available), and other metadata discovered for that endpoint. 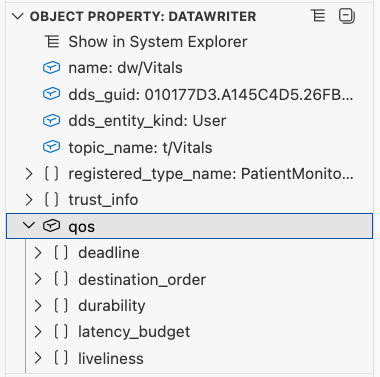
The Object Property pane includes a Show in System Explorer action both as a button in its title bar and as the first clickable item in the property list. Clicking either one reveals the currently displayed entity in the System Explorer tree. This is useful for navigating back to the entity's location in the tree after selecting it from a View or other context. The information shown in the Object Property pane depends on the connected Data Sources. Clicking an entity in the System Explorer also updates the Connext Problems pane to show the problems related to that object. The Connext Problems pane reports:

You can also explore and analyze the discovered system model through the predefined System Views described below. These Views provide complementary perspectives on system architecture, topology, participant behavior, partition use, and communication compatibility. ViewsViews are configurable outputs to visualize and summarize the model of your DDS system. You must have at least one Data Source connected to use Views. All Views update as the system model changes. The Views pane organizes predefined System Views and Security Views, user-created Custom Views, and temporary Agent Views created automatically while an AI agent inspects the system. 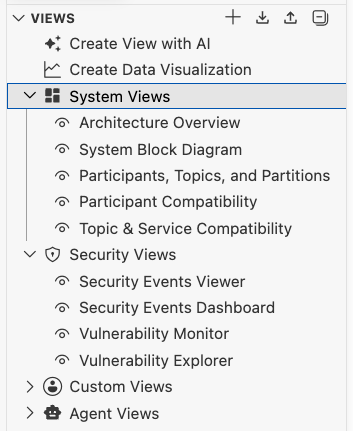
System ViewsSystem Views are predefined Views for understanding the architecture, topology, and communication behavior of your Connext system. They do not require Connext AI. Open a View's context menu and select Help for a description of its purpose and when to use it. The Views are ordered from broad system understanding to focused compatibility diagnosis: Architecture OverviewProvides an architecture-level summary of participant roles, request/reply services, and interaction patterns. The View uses a dot-matrix diagram to organize Topics, request/reply services, or combinations of both into interaction-role columns. Its rows represent participant kinds, which group DomainParticipants that interact with those roles in the same ways by publishing or subscribing to Topics and using or providing services. The dots show the direction of each participant kind's interaction, while supporting tables provide the underlying details. Connext infrastructure services are represented separately as infrastructure participants. Use Architecture Overview as the starting point for an unfamiliar or large system. System Block DiagramShows a graphical representation of the discovered Connext system. It presents information similar to the System Explorer tree view, but as a visual diagram. This View helps you understand the system topology, including Domains, DomainParticipants, Topics, Publishers, Subscribers, DataWriters, DataReaders, and their relationships. 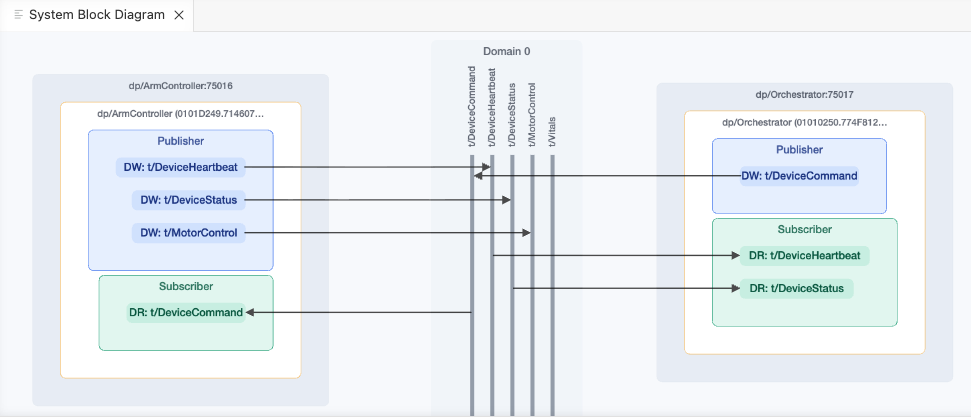
Clicking a DDS object in the System Block Diagram has the same effect as selecting it in the System Explorer: the Object Property pane is populated with contextual information about that object, based on the current system model, and the Connext Problems pane shows any problems related to that object. The System Block Diagram highlights DataWriter/DataReader match problems using colored Topic edges:
DomainParticipant nodes also get a colored border: red when the participant's trust configuration is incompatible with a peer, and orange when its partitions do not overlap with a peer's. The System Block Diagram also surfaces known vulnerabilities on participant and application nodes. Affected nodes display a vulnerability indicator with counts aggregated by severity (Critical, High, Medium, Low) for the node and its descendants, so you can spot the most exposed parts of the system at a glance. Selecting an affected object populates the Connext Problems pane with its vulnerability details. Partition differences are not treated as QoS mismatches. They may still appear in the Connext Problems pane, but only as informational items. The System Block Diagram also indicates whether model data comes from live or imported sources. Nodes backed only by imported data use a dotted border with reduced opacity. Nodes that combine live and imported data use a dashed border. The node tooltip and visualization legend identify these states. Participants, Topics, and PartitionsProvides a participant-centered View of Topics, request/reply services, and partition use. The main table shows where each DomainParticipant runs, what it publishes and subscribes to, which services it uses or provides, and which participant partitions it declares. Select a Topic or service to inspect its participants and endpoint counts, or select a partition to see how concrete names and wildcard expressions match across participants. Use Participants, Topics, and Partitions to inventory participant behavior or verify partition configuration. Participant CompatibilityShows communication status between DomainParticipants, with details about isolation and incompatibility. Select a participant to inspect its peers in a color-coded bus diagram and detail table. The View identifies affected endpoints and distinguishes participant-partition isolation, endpoint-partition isolation, and QoS incompatibility. Use Participant Compatibility when two participants should communicate but do not, or to identify which participant pair is responsible for a communication problem. Topic & Service CompatibilityShows compatibility details for the DataWriters and DataReaders associated with a Topic or request/reply service. Select an item to inspect its endpoint topology and Writer-by-Reader heatmap. Each heatmap cell represents one endpoint pair and explains whether it is matched, isolated, incompatible, or of unknown compatibility. Services combine their request and reply Topics and identify requester and replier roles. Use Topic & Service Compatibility to diagnose a problem on a specific Topic or request/reply service and identify the affected endpoint pair. Security ViewsSecurity Views group together the predefined Views that focus on the security posture of your Connext system, including DDS Security log events and known product vulnerabilities. Open a View's context menu and select Help for a description of its purpose and when to use it. Security Events ViewerShows DDS Security log events discovered by Connext Studio in a detailed, inspectable list. Use this View to review individual security events and investigate specific security-related behavior. Security Events DashboardShows a summarized dashboard of DDS Security log events discovered by Connext Studio. It displays event counts by severity, alerts and errors grouped by reporting DomainParticipant and flagged DomainParticipant, and security events over time. Note: Security events are detected from an RTI DDS Spy Data Source configured to use security and subscribe to the DDS Security built-in secure logging Topics. Vulnerability MonitorShows the known security vulnerabilities that affect the Connext DomainParticipants discovered in your running system. The Monitor lists one entry per affected participant and vulnerability, including the participant name, the affected Connext product and version, the CVE ID, RTI ID, CVSS score, severity, and affected component. Use this View to understand which deployed participants are exposed and to prioritize remediation. The View updates as the system model changes. Records can be grouped, expanded/collapsed (show more/less), and exported to CSV. 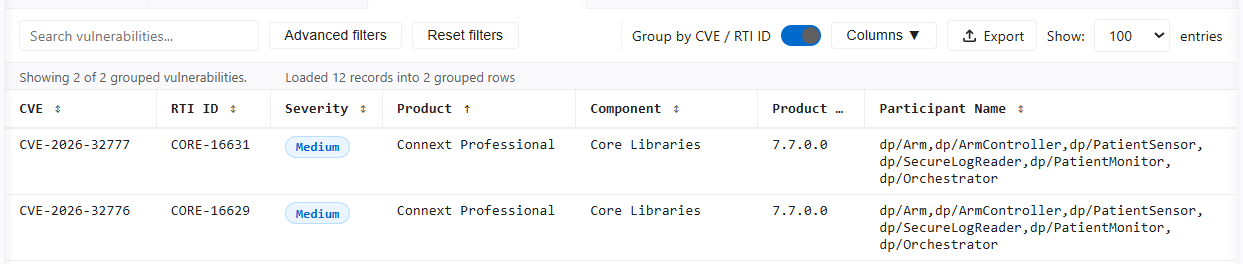
Note: Vulnerability information is derived from RTI's published vulnerability data and is matched against the Connext product versions detected in your system model. Vulnerability detection therefore depends on Data Sources that can report participant product version and security information, such as RTI DDS Spy or an RTI Admin Console discovery export file that includes those fields. The set of vulnerabilities reported for a participant is further refined using the participant's running service, such as Persistence Service, Routing Service, or Recording Service, so that only relevant components are flagged. Vulnerability ExplorerShows a deduplicated catalog of known vulnerabilities for the Connext product versions present in your system (derived from your installed Connext versions), grouped by CVE. Unlike the Vulnerability Monitor, the Explorer is organized by unique vulnerability rather than by affected participant; each entry merges all affected product versions and includes severity, CWE, CAPEC, a description, the user impact (with and without security enabled), and recommended mitigations. Use this View to research the vulnerabilities relevant to your Connext versions independently of which participants are currently running. Entries can be filtered, expanded/collapsed, and exported to CSV. 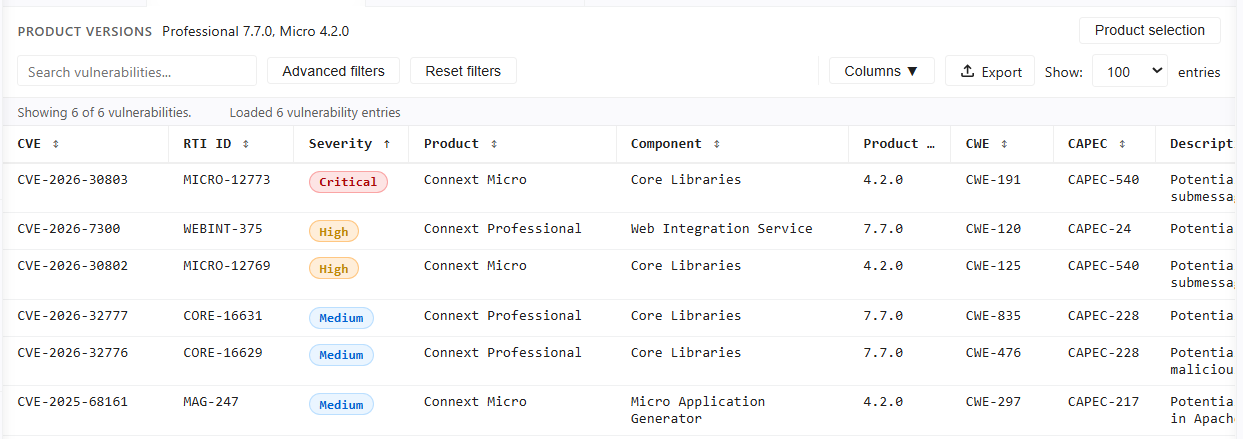
Create Data VisualizationCreate Data Visualization allows you to visualize the samples published on a DDS Topic as a table or time chart. Click Create Data Visualization and follow the wizard to set up the visualization as desired. 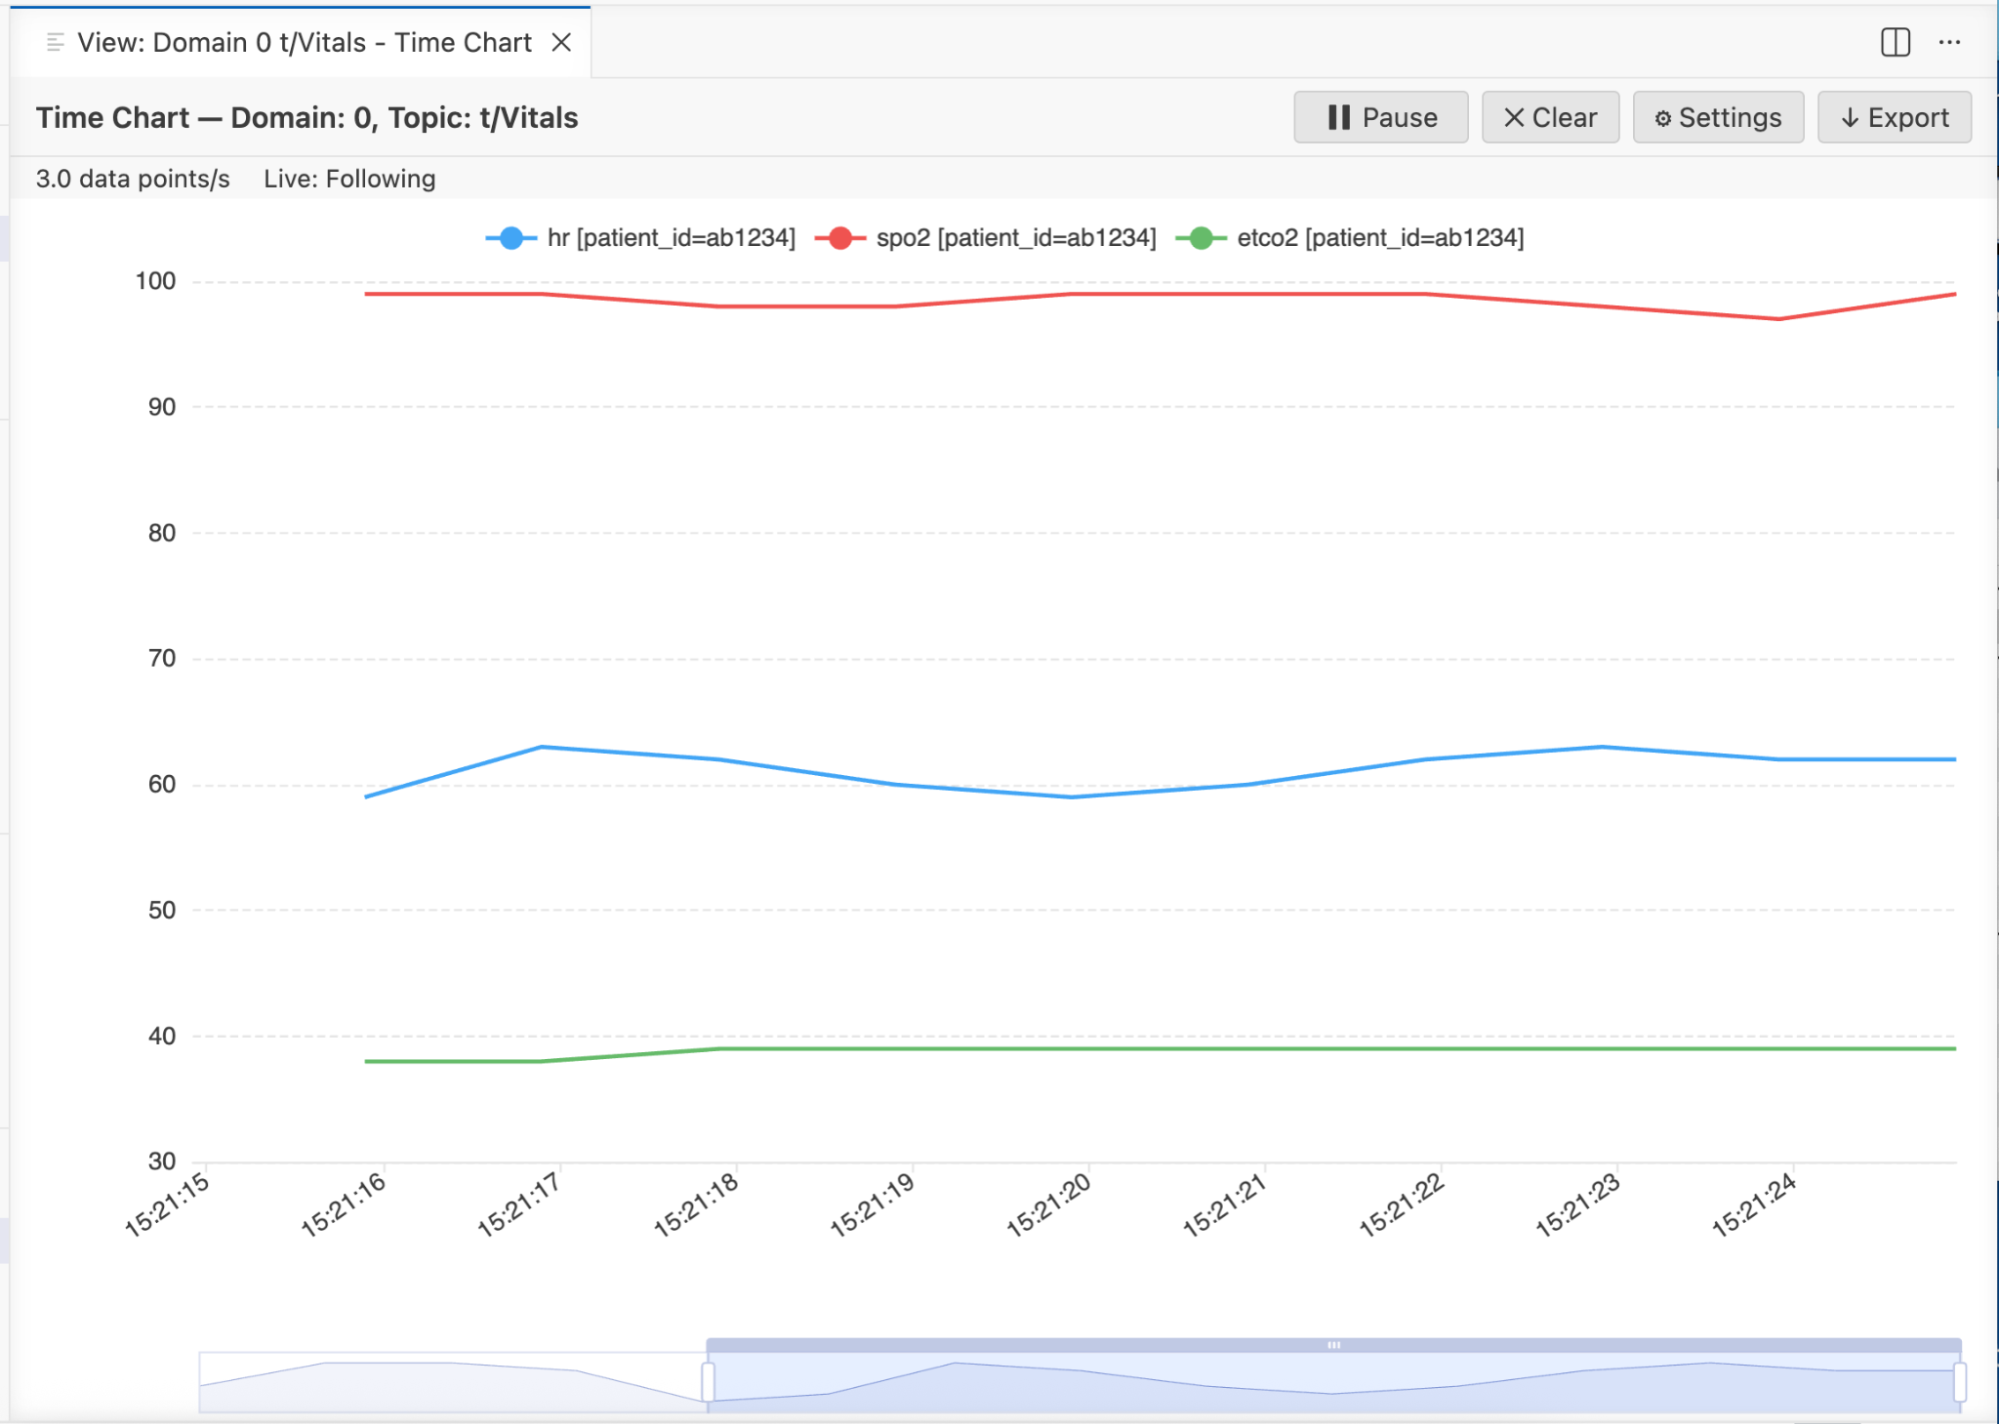
Creating a Data Visualization automatically creates a subscription to the Topic of interest. AI Views (Custom Views)You can also create Views with AI. Click Create View with AI in the Views pane, and then describe a View of your system in natural language. For example, "Create a list of all the reliable DataWriters with only best effort DataReaders" or "Create a dashboard for patient ab1234 that visualizes all signals from the Vital Topic". Connext AI will generate this View based on your system and visualization description. Connext AI is also aware of known vulnerabilities affecting your system, so you can ask it to generate Views that highlight or filter by vulnerable participants, components, or product versions, for example, "List all participants affected by a critical vulnerability". 
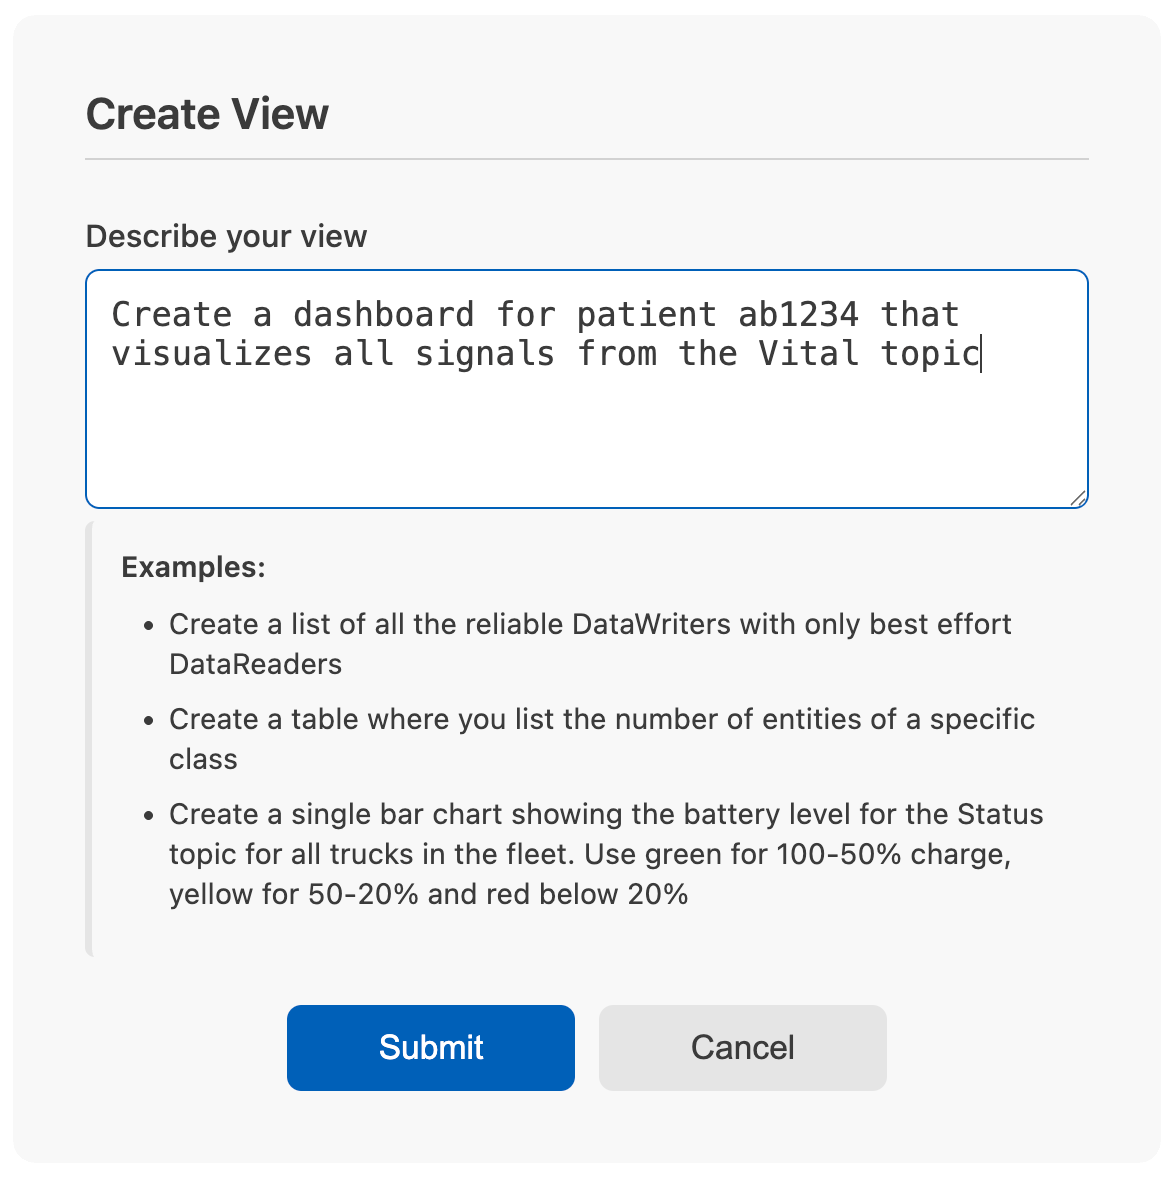
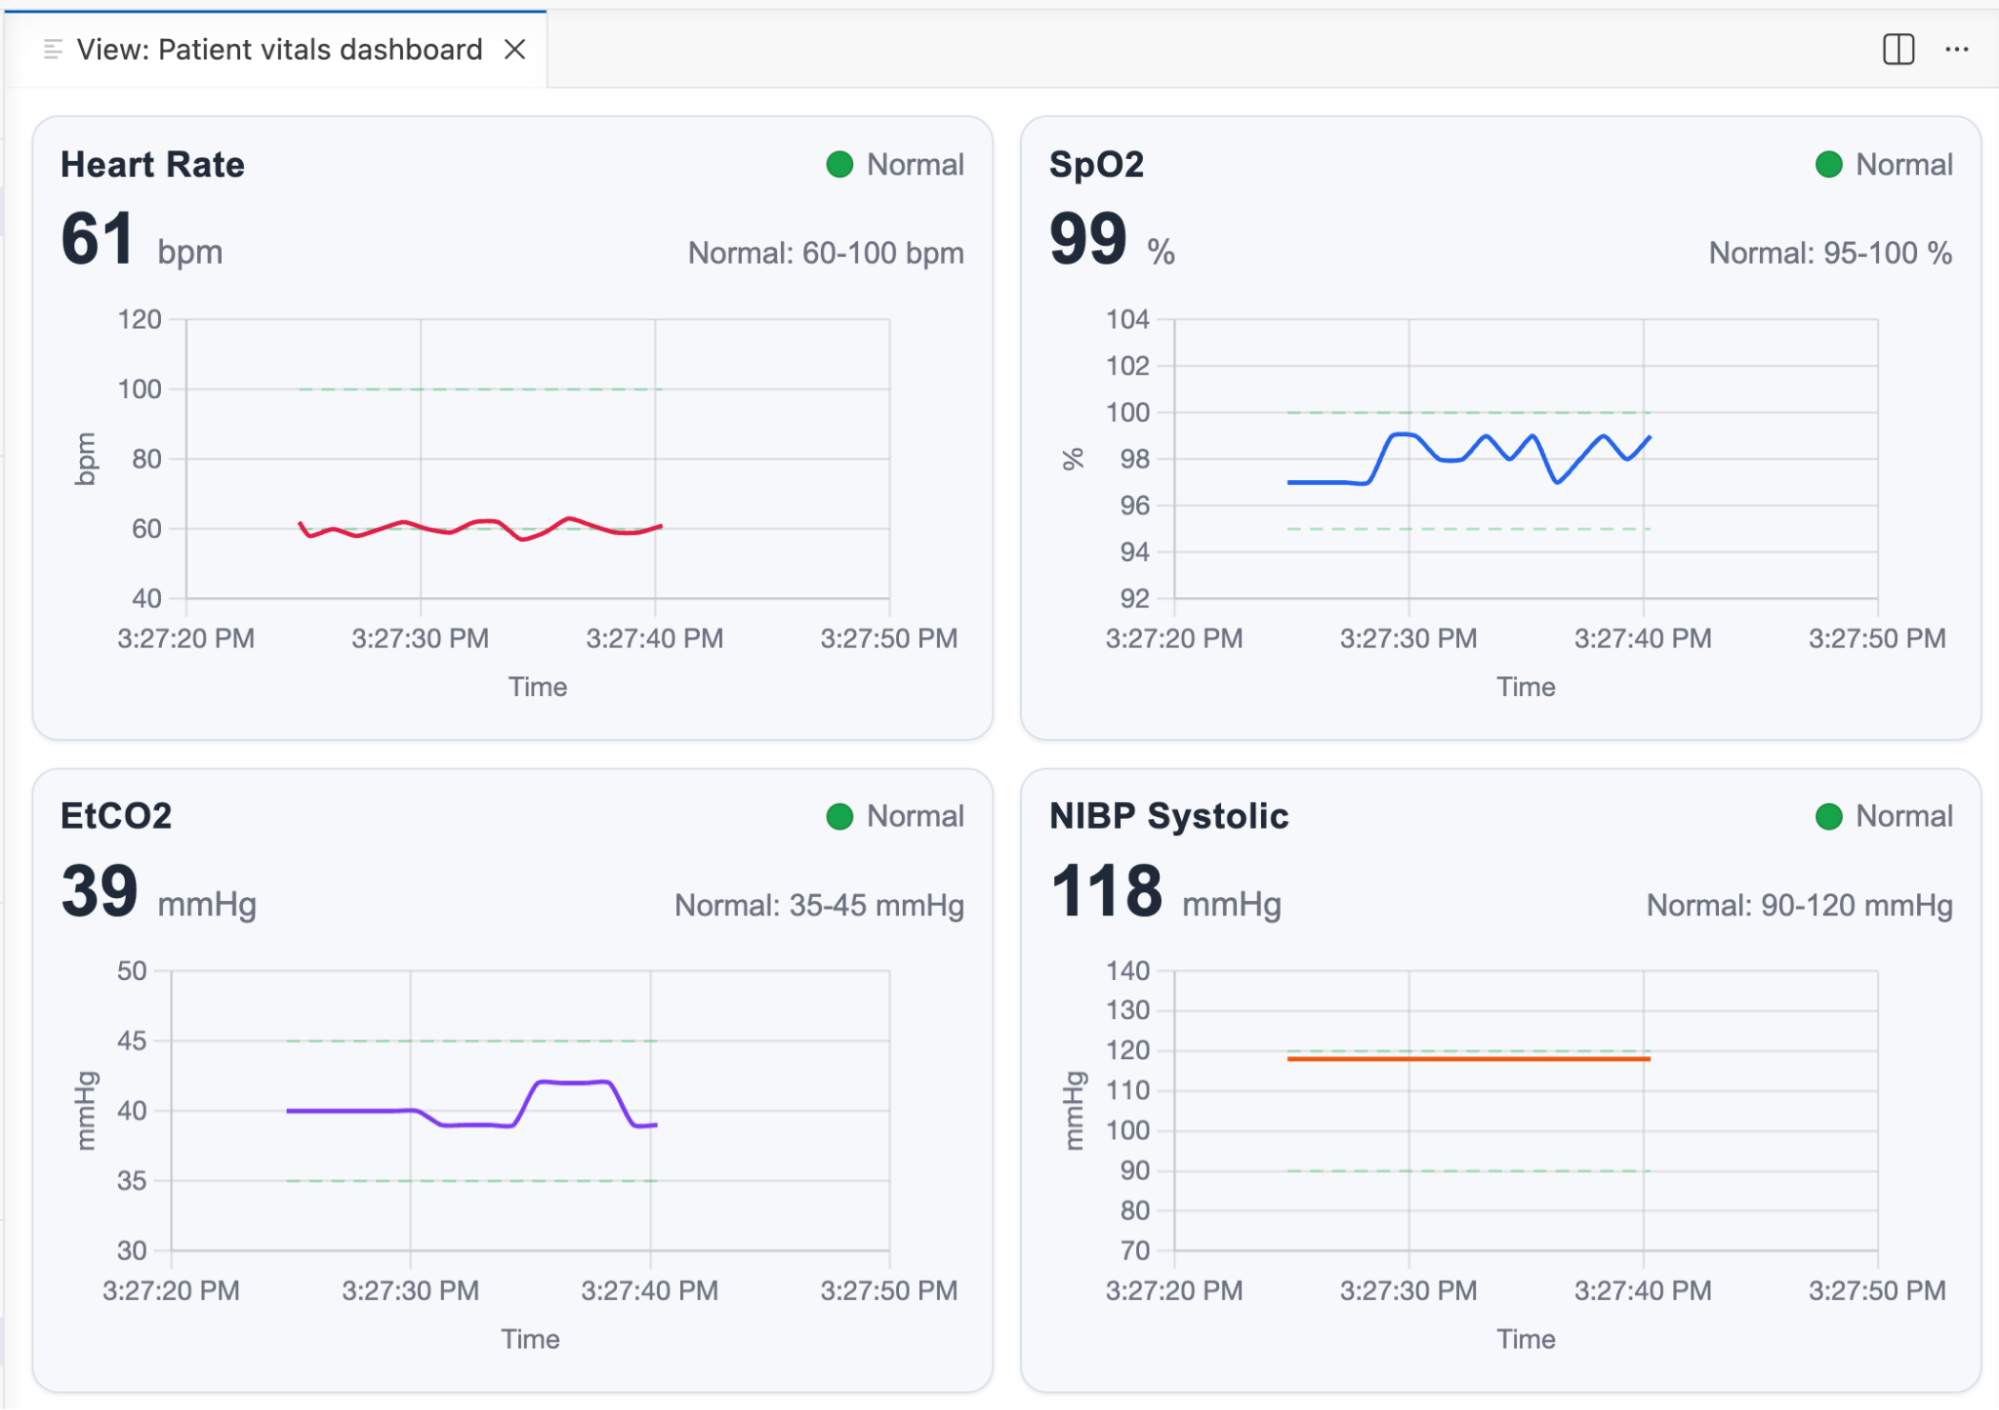
AI Views are automatically saved under Custom Views. After a View has been created, you can open and run it again at any time from Custom Views. User-created Views can be exported and imported using the export and import buttons in the Views pane. Export a View when you want to share a custom analysis with someone else. Import a View to add a View that someone shared with you or restore one that was exported previously. 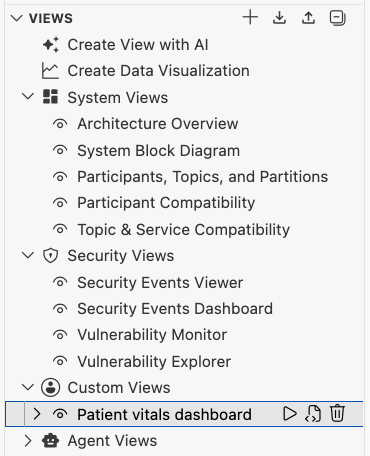
Connext AI is only required to create the View. Once the View has been generated, Connext Studio runs the generated View code directly; Connext AI is not required to execute the View. You can inspect the generated View code by clicking the code/document icon next to the View in Custom Views. As an alternative to using Create View with AI in the UI, you can create a View via Connext Chat using the
Agent ViewsAgent Views are short-lived query Views that Connext Studio creates automatically when an AI agent uses Ask Model Graph to answer a question about the discovered DDS system. They are different from the AI-generated Custom Views described above: you explicitly create a Custom View as a reusable artifact, while an Agent View is an implementation detail of an agent's system-inspection workflow and acts as a query cache. When Ask Model Graph receives a question, Connext Studio first checks whether an existing Agent View or Custom View can answer a semantically equivalent question. If it finds one, Studio runs the saved query code against the current in-memory system model. This produces results from the latest discovered state while avoiding another AI request to generate equivalent query code. If there is no matching View, Connext AI generates a new query and Studio saves it under Agent Views for possible reuse. Each Agent View displays how many minutes remain before it expires. The default lifetime is 30 minutes and can be changed with the The Agent Views section is shown when the AI Features master switch and GitHub Copilot compatibility are enabled in Connext Studio settings. New Agent Views are created only while the System Inspection feature group is enabled. Account & SupportThe Account & Support section provides access to account, configuration, documentation, and feedback actions for Connext Studio. It also allows launching RTI Launcher from the default Connext installation. 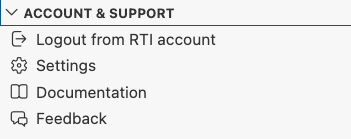
Settings paneThe Settings pane for Connext Studio can be opened by clicking Settings in the Account & Support pane. It brings the extension's most frequently used controls into one place:
In AI Features, you can:
All feature groups are enabled by default except Topic Data, which must be explicitly enabled and requires reviewing and accepting a data-access notice before activation. The Topic Data group controls tools that subscribe to DDS Topics and read live data samples (Subscribe to Topic, Unsubscribe from Topic, Read Topic Samples, Get Topic Schema). Each feature group shows a data flow note indicating whether data is sent to Connext AI, GitHub Copilot, or stays local on your machine. In Licenses, use License details to inspect the license file, expiration, and licensed features. Use Select file or Replace to provide a license for the corresponding entry, or Get Trial License when offered. To update Studio's component license, use the Connext components entry rather than a development installation's entry. In Data Sources, use the Connect on Add master checkbox to change all available source types together, or configure the source types individually. These settings are enabled by default and apply when a new Data Source is added; they do not change the connection state of existing sources. The Topic Visibility section under User Interface Settings controls which Topics appear in topology views. RTI and DDS standard Topic checkboxes are unchecked by default. You can toggle a category or individual Topics. Custom case-sensitive Select Show Welcome Screen under General to restart the onboarding wizard, or select Advanced Settings to access the complete set of extension settings. 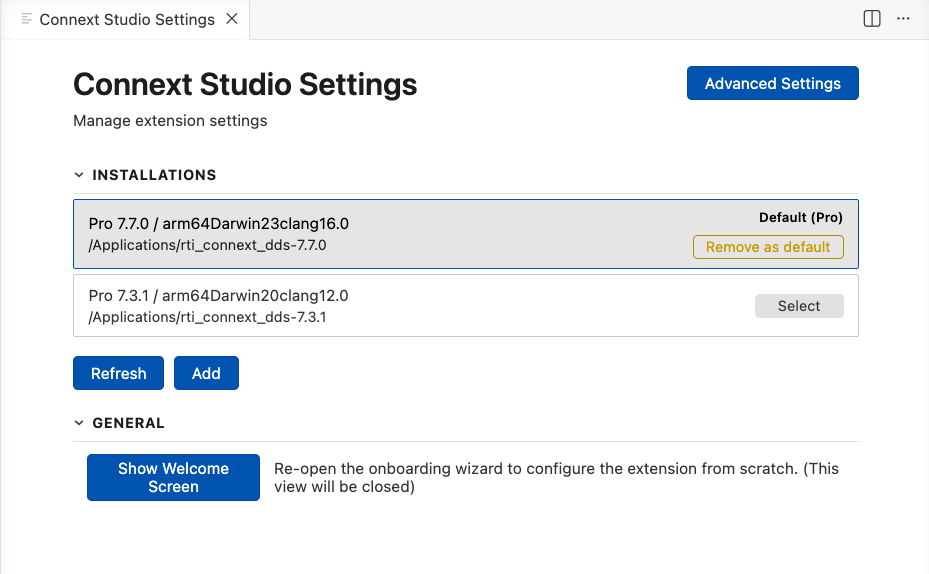
Chat PanelTo open the Connext Chat, click the Connext AI avatar icon on the left sidebar, as shown below: 
And then type your question: 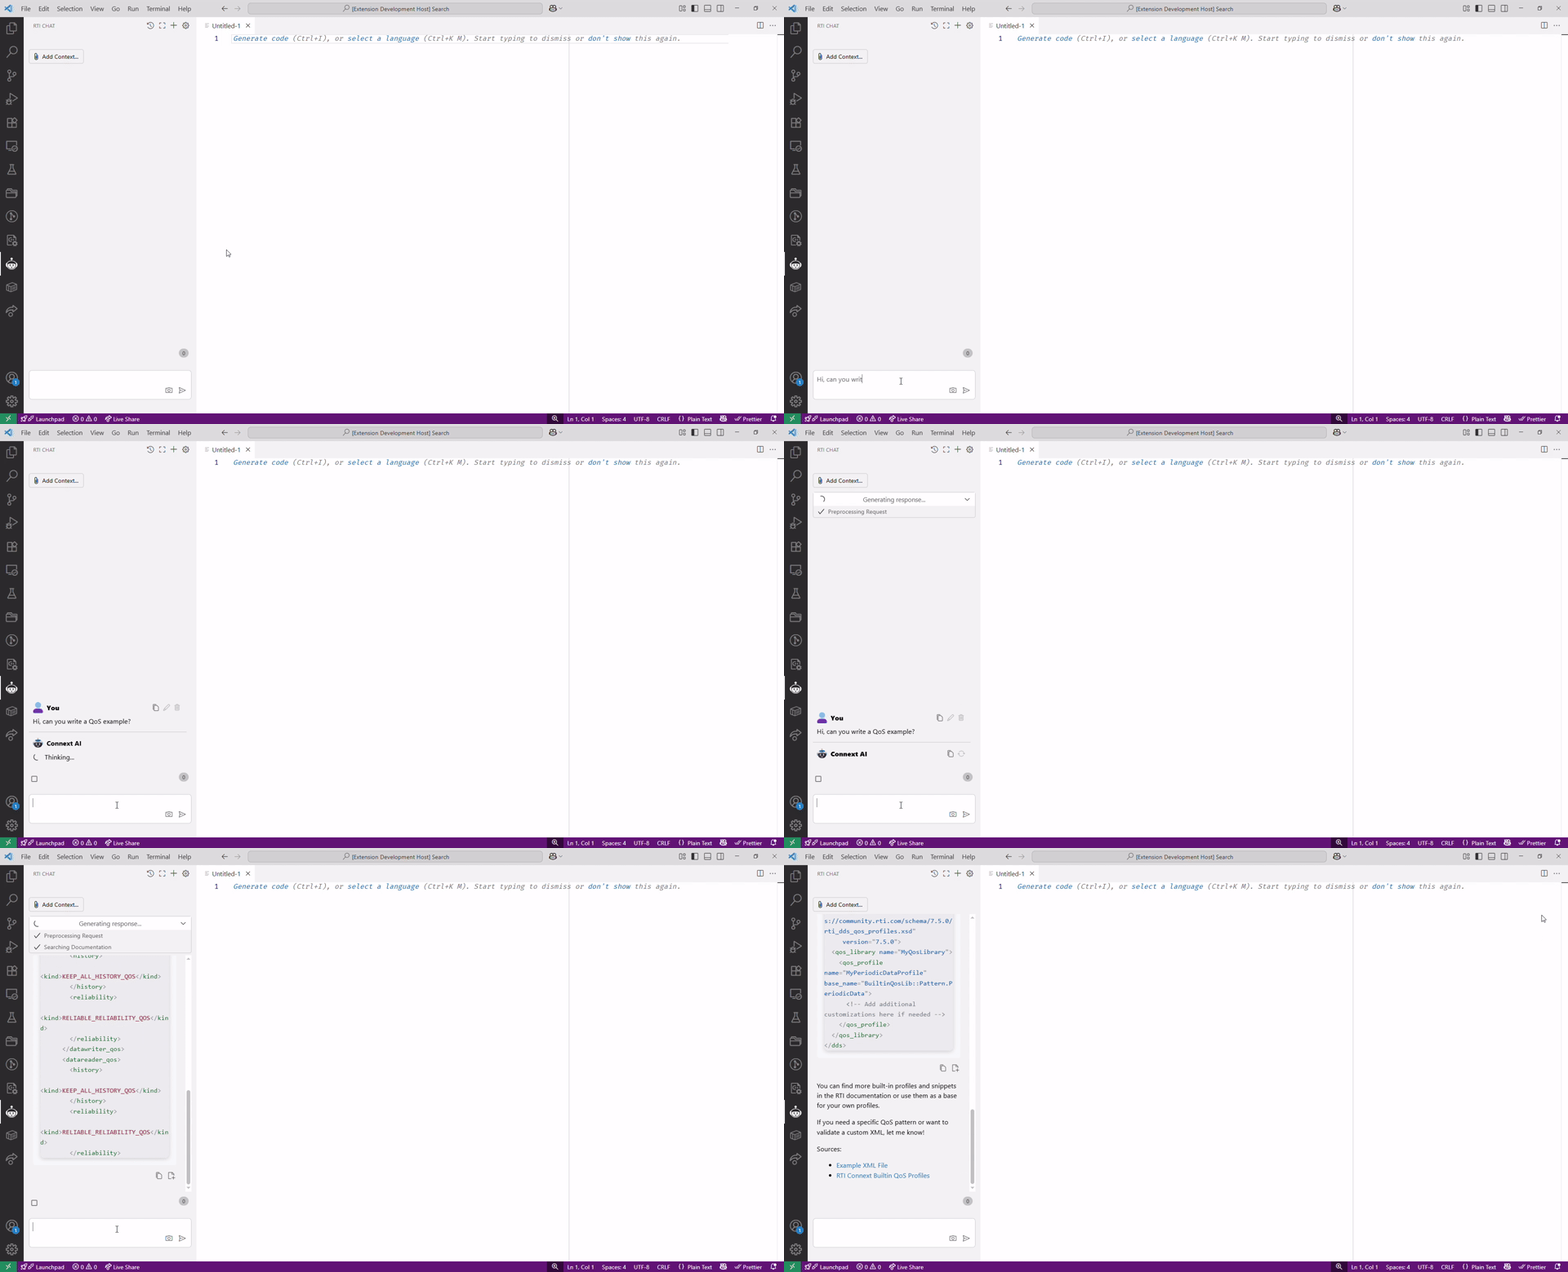
You can enrich your question by adding relevant files or images via the Add Context button: 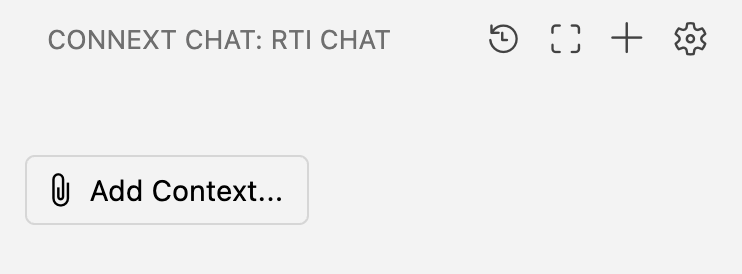
Chat CommandsThis extension allows invoking pre-defined commands from the chat window by typing /<command> or clicking the / (Browse Commands) button in Connext Chat. Standalone Commands can be sent on their own, and Contextual Commands require an argument or further input. The available Standalone Commands are:
The Contextual Commands are:
The commands that start tools will fail if there is no default Connext installation configured (either by using the default installation directory or by setting the NDDSHOME environmental variable). includeOpenFiles and includeWorkspace commandsThe These commands do not include every matching file. Some files are intentionally excluded even if they are open in the editor or present in the workspace. In particular, the following files automatically generated by rtiddsgen are not included because they can be very large and usually add little value to the AI response while quickly consuming the available context length:
The Using Connext Studio with GitHub Copilot ChatWhen GitHub Copilot Chat is installed, Connext Studio integrates with it by default. You can control this integration from the AI Features section of the Settings pane, which provides toggles for:
To run Connext Studio with GitHub Copilot, you need:
Using @connextIn the GitHub Copilot Chat interface in Ask or Agent mode, simply type @connext followed by your question or command. This explicitly routes your message to the Connext Studio chat participant. Use Examples: Once you type In GitHub Copilot Chat, Connext Studio chat commands are available using the same When GitHub Copilot Compatibility is enabled, Connext Studio also exposes additional VS Code integration points, including the Connext right-click context menu with actions such as Explain this, and support for VS Code Quick Chat. Using @connext is only necessary when you are interacting with Connext Studio from the GitHub Copilot Chat interface. Connext Studio AgentOn VS Code 1.110 or later, enabling GitHub Copilot Compatibility also adds Connext Studio to the agent picker in GitHub Copilot Chat. Older supported VS Code versions continue to provide the extension's other functionality, but the custom agent is not supported and may not appear. Select this agent when you want Copilot to coordinate Connext Studio tools for a complete task instead of referencing each tool yourself. For example, the Connext Studio agent can:
Ask the agent directly, for example, Language Model ToolsWhen GitHub Copilot Compatibility is enabled, Connext Studio also exposes Language Model Tools that GitHub Copilot can use in agent mode. Language Model Tools are different from With With Language Model Tools, GitHub Copilot remains the active chat participant. Copilot may invoke a Connext Studio tool when it is useful for the task. That tool invocation sends a request to Connext Studio, Connext Studio returns the result, and Copilot uses that result to continue the Agent mode workflow. In short, Use Agent mode with Language Model Tools when you want GitHub Copilot to work on a broader coding or configuration task and use Connext Studio capabilities as needed. For example, Copilot may call Connext Studio tools to get Connext-specific guidance, inspect local Connext installations, or validate generated Connext code. GitHub Copilot in VS Code receives these tools through VS Code's native Language Model Tools API. Other MCP-compatible agent harnesses can use the Studio-owned tools through the local Connext Studio MCP server. Connext AI tools such as Ask Connext and code validation are available separately through Connext MCP and are not exposed by the local Studio server. Connext Studio - Available ToolsThe MCP column indicates whether the local Connext Studio MCP server exposes the tool to other agent harnesses. Ask Connext and code-validation tools are available separately through Connext MCP. Using Tools in GitHub Copilot ChatYou can reference these tools directly in the GitHub Copilot Chat by using the # prefix followed by the tool reference name. For example:
Alternatively, GitHub Copilot will automatically invoke these tools when it determines they are relevant to your question. For instance, if you ask about Connext DDS in Agent mode, Copilot may automatically use the Ask Connext tool to provide expert-level answers. Example UsageUsing Studio Tools from Other Agent HarnessesConnext Studio exposes its local tools to MCP-compatible agent harnesses over Streamable HTTP. Connext Studio must remain open while a harness uses the tools. Start the MCP Server
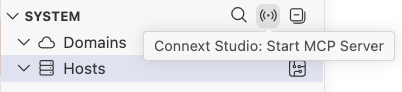
The MCP endpoint is The server binds to Then configure the harness to use Tool availability follows the active Studio mode and AI feature settings. Topic Data tools also require explicit consent. Tools that open a View or the Log Viewer display that UI in the running Connext Studio window, not inside a terminal-based harness. For Cursor, add a project-level For Codex, add the server to For Claude Code, run: Stop the server using the stop icon in the System Explorer title bar, Connext Studio: Stop MCP Server from the Command Palette, or the Connext MCP status item. The server also stops when Connext Studio is deactivated. FeedbackYou can provide feedback from Connext Studio by opening Account & Support and selecting Feedback. For additional feedback, questions, or issues related to Connext AI features, you can contact the Connext AI team at For product support or other assistance, contact RTI Support at Data PrivacyWhen you use Connext Studio, you must be logged into your RTI account. When an internet connection is present, the information listed below is shared with RTI, subject to RTI's Privacy Policy and Connext AI Terms of Use:
Data Flow ControlsThe AI Features section in the Settings pane shows exactly where your data goes for each feature group. Each group includes a data flow note indicating whether data is sent to Connext AI, GitHub Copilot, or stays local on your machine. You can disable any feature group to prevent its data from being shared. When using Connext Chat without GitHub Copilot, requests go directly to Connext AI without passing through GitHub Copilot. Connext Studio uses the active (currently open) file in the IDE as part of its context for answering questions in the Connext Chat panel and through @connext in GitHub Copilot Chat. To control this behavior, you can select None from the dropdown menu under Account & Support → Settings -> Advanced Settings → Connext -> Context Files. Note that users can still include files explicitly using the RTI does not train any AI models on any data shared through Connext Studio or any other means. All data is stored encrypted, with strict role-based access controls, and is accessible only by key RTI personnel. Your data may be reviewed to help improve RTI products. To request data deletion or get more information about RTI's privacy policy, email privacy@rti.com. Visit our Privacy information page for more information about data privacy when AI features are used. AI Use DisclosureOur engineering team uses AI-assisted tools to accelerate code generation and debugging. However, human developers retain full ownership; every line of code is reviewed and approved by human developers. LicenseCopyright (c) 2025 Real-Time Innovations, Inc. All rights reserved. RTI grants you the right to compile and use this software. You may not modify, create derivative works of, or distribute the software. This software is an experimental (i.e., pre-production or beta) product. It is provided “as is”, with no warranty of any type, including any warranty for fitness for any purpose. RTI is under no obligation to maintain or support the Software. RTI shall not be liable for any incidental or consequential damages arising out of the use or inability to use the software. This software integrates with AI services provided by RTI, and your use of those services is subject to RTI's Privacy Policy and these Terms of Use. |