Workspace Disk Usage Visualizer

Visualize your workspace's disk usage with a stunning, modern dashboard inspired by WinDirStat


Identify large files • Analyze folder structures • Reclaim disk space with ease
🎯 Why This Extension?
Ever wondered what's eating up your disk space? Running out of storage on your development machine? This extension provides a beautiful, interactive, and high-performance dashboard to visualize file sizes within your VS Code workspace—helping you identify space hogs instantly.
✨ Key Features
📊 Interactive Treemap Visualization
Explore your file hierarchy with a WinDirStat-inspired treemap. Each rectangle represents a file, sized proportionally to its disk usage. Hover to see details, click to open files, or Ctrl/Cmd+click to reveal in Explorer.
🎨 Modern, Stunning UI
- Glassmorphism Design: Sleek dark theme with frosted glass effects
- Neon Aesthetics: Vibrant purple/cyan accents with animated gradients
- Animated Borders: Elegant light runner effects that trace dashboard elements
- Dynamic Background: Immersive floating particles and glowing gradients
- Rank Badges: Gold, silver, and bronze medals for your top 3 largest files
📈 Extension Breakdown Chart
See which file types (.js, .png, .json, etc.) consume the most space with a modern horizontal bar chart. Instantly identify if images, dependencies, or build artifacts are the culprits.
🏆 Top Files List
A sortable table showing your largest files with:
- File size and path
- Visual rank indicators for top files
- One-click navigation to any file
- Configurable display limit
⚡ Smart & Fast
- 30-40% faster scanning with intelligent file filtering
- Auto-scan on startup: Status bar shows workspace size immediately
- Project type detection: Automatically identifies Node.js, .NET, Java, Python, and more
- Configurable excludes: Skip
node_modules, .git, and other folders
- Real-time progress: Watch the scan progress with a smooth animated loader
📊 Status Bar Integration
Your workspace size is always visible in the status bar (e.g., "1.2 GB · 5,432 files"). Click to refresh or open the dashboard.
🔍 Quick Action Filters
- 🔍 Large Files: Filter to show only files larger than your configured threshold
- 🖼️ Images: Focus on image files only (.jpg, .png, .gif, etc.)
- 🕒 Recent: View recently modified files (last 7 days)
- 📤 Export: Generate detailed Markdown reports
- 🔄 Refresh: Rescan workspace for fresh data
📸 Screenshots
Dashboard Overview
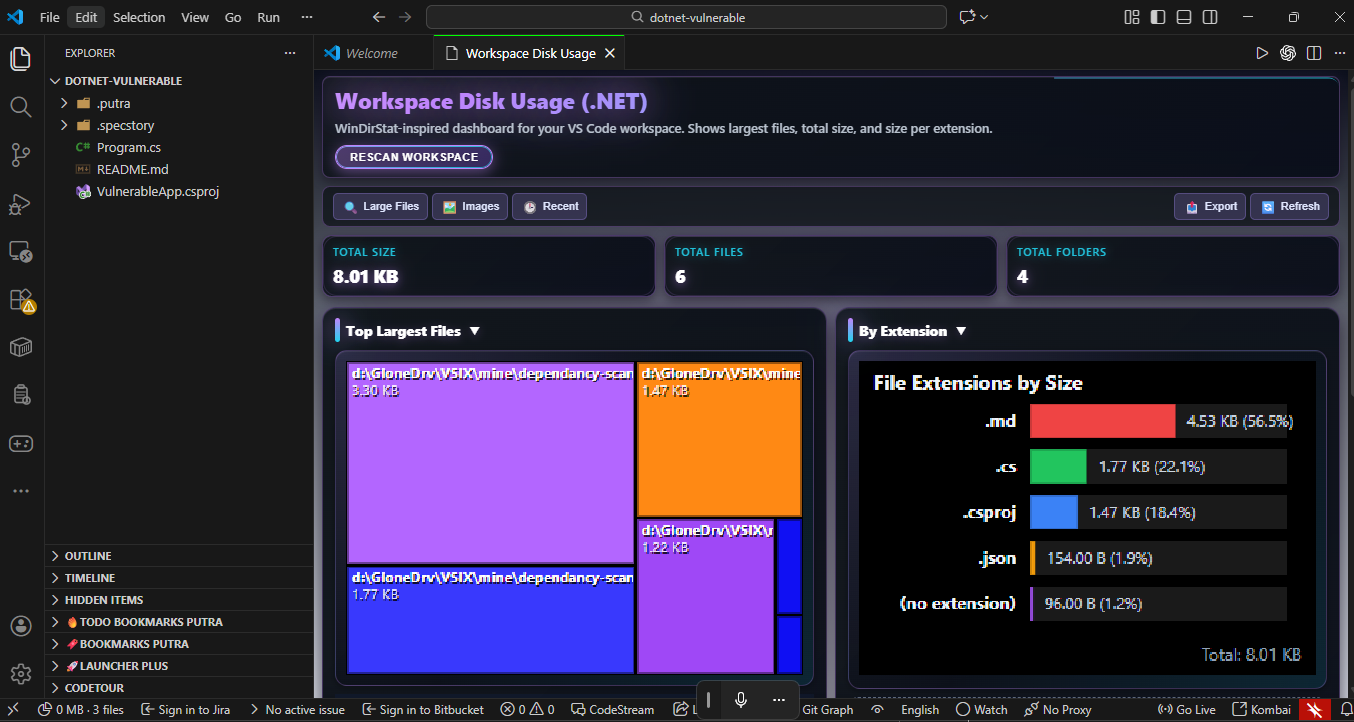
Beautiful glassmorphism design with treemap, charts, and statistics
Detailed Analysis
Interactive treemap with hover tooltips and extension breakdown
🚀 Getting Started
Installation
- Open VS Code
- Press
Ctrl+P (or Cmd+P on Mac)
- Type:
ext install PutraAdiJaya.workspace-disk-usage-visualizer
- Press Enter
Or install directly from the VS Code Marketplace.
Usage
Method 1: Command Palette
- Open Command Palette (
Ctrl+Shift+P or Cmd+Shift+P)
- Type:
📊 Workspace Disk Usage: Open Dashboard
- Press Enter and wait for the scan to complete
Method 2: Status Bar
- Click the workspace size indicator in the status bar
- Or right-click for refresh options
Interacting with the Dashboard:
- Hover over treemap rectangles to see file details
- Click a file to open it in the editor
- Ctrl/Cmd+Click to reveal the file in Explorer
- Sort the top files table by clicking column headers
- Rescan anytime with the glowing button at the top
⚙️ Configuration
Customize the extension in your VS Code settings (Ctrl+, or Cmd+,):
{
  // Folders to exclude from scanning (exact name match)
  "workspaceDiskUsage.excludes": [
    "node_modules",
    ".git",
    "dist",
    "build",
    ".vscode",
    ".idea"
  ],

  // Maximum number of largest files to display
  "workspaceDiskUsage.topFilesLimit": 50,

  // Highlight files larger than this size (in MB)
  "workspaceDiskUsage.largeFileThresholdMB": 50,

  // Highlight extensions taking more than this % of total size
  "workspaceDiskUsage.dominantExtensionThresholdPercent": 40,

  // Automatically scan workspace on startup
  "workspaceDiskUsage.autoScanOnStartup": true
}
Available Commands
| Command |
Description |
📊 Workspace Disk Usage: Open Dashboard |
Open the interactive dashboard |
🔄 Workspace Disk Usage: Refresh Status Bar |
Manually refresh the status bar size |
| Button |
Function |
| 🔍 Large Files |
Filter files > threshold size |
| 🖼️ Images |
Show image files only |
| 🕒 Recent |
Files modified in last 7 days |
| 📤 Export |
Generate Markdown report |
| 🔄 Refresh |
Rescan workspace |
🎨 What Makes This Special?
- Smart filtering: Files are filtered early in the scan process
- Optimized rendering: Canvas-based treemap with efficient drawing
- Memory efficient: Only top files are kept in memory
- Non-blocking: UI remains responsive during large scans
Visual Excellence
- High contrast colors: 8 distinct colors for easy differentiation
- Index-based coloring: Each file gets a unique color based on rank
- Size-based brightness: Larger files glow brighter (up to 25% boost)
- Gradient fills: Every element has depth with gradient effects
- Smooth animations: Transitions and hover effects feel premium
Smart Features
- Recursive folder sizes: Accurate size calculations including all nested files
- Project detection: Recognizes 10+ project types automatically
- Responsive design: Adapts to any window size
- Accessibility: Keyboard navigation and screen reader support
🔧 Use Cases
- 🧹 Clean up projects: Find and delete large unused files
- 📦 Optimize builds: Identify bloated dependencies or build artifacts
- 🖼️ Manage assets: Discover oversized images or media files
- 📊 Audit codebases: Understand project structure and file distribution
- 💾 Free up space: Quickly locate space-consuming files before running out of disk
🤝 Contributing
Found a bug or have a feature request? Contributions are welcome!
📝 Changelog
[0.1.3] - Latest
- 🎨 Compact dashboard layout for better space utilization
- 🚀 Enhanced visual design with refined aesthetics
- 📊 Improved information density while maintaining readability
- ⚡ Quick action toolbar for common operations
- 📁 Export functionality for workspace data (JSON/Markdown)
- 🗂️ Detailed file list with folder grouping and sorting
- 🔍 Treemap zoom and pan capabilities
- ⌨️ Keyboard navigation support
View Full Changelog
📄 License
MIT License - see LICENSE file for details
💖 Support
If you find this extension helpful, please:
Made with ❤️ by PutraAdiJaya
Happy coding and disk space hunting! 🚀