Open Image Debugger for VS Code
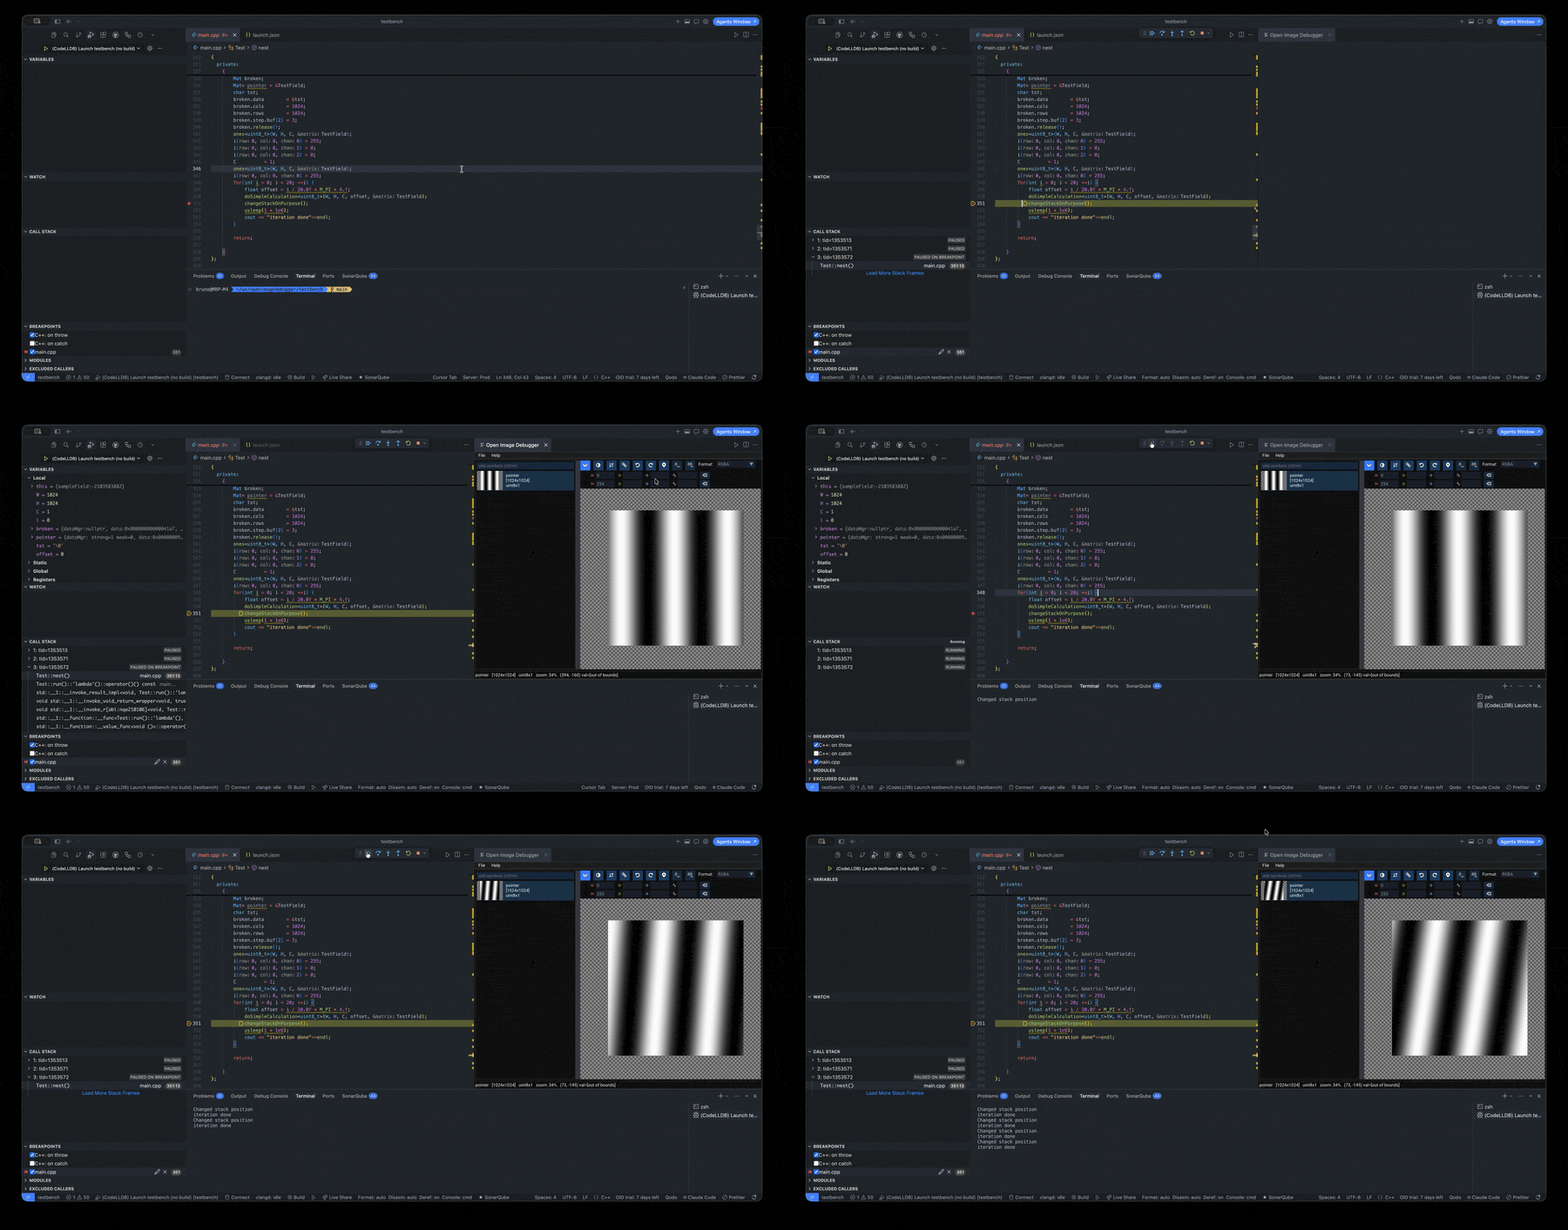
Inspect in-memory image buffers while you debug C++, rendered live in an
editor panel, with contrast stretch, colorspace switching, zoom/pan, and export
to PNG, NumPy .npy, or Octave. OpenCV Mat and Eigen matrices work out of the
box, and you can teach it your own image types in a JSON file.
🧩 New in 1.4.0: custom buffer types. Describe your own image struct in
a .oid/types.json file, with no Python, and plot it like any built-in type.
VS Code checks the file as you type. See
Custom buffer types below.
Pricing: 7-day free trial (full functionality), then a €9 one-time
license, no subscription, up to 3 machines. Buy a license from the viewer
when your trial ends, or run "OID: Enter License Key" any time to
activate one.
Features
- Custom buffer types (new in 1.4.0): describe your own image struct in
a
.oid/types.json file, with no Python. Your editor validates it as you
type. See Custom buffer types.
- AI agent access (MCP): let Claude Code, Cursor, or any MCP client inspect
your image buffers while you debug. Opt-in and loopback-only.
- Live buffer viewer beside your code: plot any image-like variable while
paused in the debugger.
- Watch list:
oid.watchOnStop re-plots chosen variables on every stop.
- Contrast & colorspace controls, min/max readout, pixel value inspection.
- Export any buffer to PNG, NumPy
.npy, or Octave raw matrix.
- Session persistence: your layout and buffers come back per workspace.
Requirements
- VS Code 1.106+ with the CodeLLDB (
lldb debug type) or lldb-dap (lldb-dap debug type) extension.
- With lldb-dap, an LLDB built with Python scripting support. Some Linux
distributions package it apart from the debugger, so install
python3-lldb
alongside lldb; without it LLDB answers error: there is no embedded script interpreter in this mode. and no buffer can be read.
- A C++ debug target compiled with debug info.
Either adapter works the same way. The one difference worth knowing before you
pick: lldb-dap prints everything OID asks the debugger into the Debug Console,
so a few extra lines appear there on every stop, and nothing turns that off.
Quick start
- Start a CodeLLDB or lldb-dap debug session and hit a breakpoint.
- The viewer opens automatically (or run "OID: Open Viewer Panel").
- Select a variable and run "OID: Plot Variable".
Commands
| Command |
Description |
OID: Open Viewer Panel |
Open the image viewer beside the editor |
OID: Plot Variable |
Plot the selected/typed variable |
OID: Export Selected Buffer |
Export the selected buffer to a file |
OID: Enter License Key |
Activate a license key |
OID: Deactivate License on This Machine |
Free an activation slot |
OID: Clear Persisted Settings |
Reset stored UI/session state |
OID: Register MCP Agent (oid-mcp) |
Register the viewer with a local MCP agent |
OID: Unregister MCP Agent (oid-mcp) |
Remove the OID MCP server registration |
AI agent access (MCP)
Let a local AI agent (Claude Code, Cursor, or any MCP client) inspect the
buffers shown in the viewer while you debug.
- Enable the endpoint — set
oid.agent.enabled to true (off by
default) in a trusted workspace. While a debug viewer is open, the
extension listens on a loopback-only, token-authenticated socket and
writes a discovery file that the oid-mcp tool finds automatically.
- Register the agent — run OID: Register MCP Agent (oid-mcp) for
a one-click setup (Claude Code, Cursor, or copy the command), or add it
manually: the MCP server command is
uvx oid-mcp.
- Requirements —
uv provides uvx.
Install it with the official instructions for your platform:
https://docs.astral.sh/uv/getting-started/installation/. oid-mcp is
installed from PyPI on first use. The endpoint only exists while a debug
session's viewer is open with the setting enabled.
Which buffers the agent sees: the agent lists the buffers currently
plotted in the viewer. To make specific buffers visible to the agent as
soon as a breakpoint is hit — without opening them by hand — add their names to
the oid.watchOnStop setting; they are re-plotted on every stop.
Security & limitations: the socket binds 127.0.0.1 only and requires
a per-session random token from a 0700 discovery directory — same threat
model as the native viewer's opt-in agent endpoint. Remote setups
(SSH/WSL/dev containers) are not reachable from the host side: the agent
and uvx oid-mcp must run where VS Code's extension host runs. To undo a
registration, run OID: Unregister MCP Agent (oid-mcp).
Custom buffer types
Teach OID your own image type, with no Python required.
Where the file goes. Create a directory named .oid in your
workspace root, containing a file named types.json:
your-project/
└── .oid/
    └── types.json
In a multi-root workspace, every root contributes its own .oid/types.json.
Outside VS Code, the native tool finds the same file by walking up from the
debugger's working directory, so one file serves both.
{
  "$schema": "https://raw.githubusercontent.com/OpenImageDebugger/OpenImageDebugger/main/resources/schemas/oid-types-v1.json",
  "version": 1,
  "types": [
    {
      "description": "greyscale frame, tightly packed",
      "match": "^MyImage$",
      "pointer": "{sym}.data",
      "width": "{sym}.w",
      "height": "{sym}.h",
      "dtype": "uint8"
    }
  ]
}
Inside VS Code this extension validates .oid/types.json for you. A missing
required field, a misspelled key or most invalid values (including version)
is flagged as you type, before you start a debug session. The $schema line
is optional; it gets you the same checking in any other JSON-aware editor.
match is a regular expression tested against the variable's type name.
description is a free-text note about the entry: optional, must be a
string when you set it, and simply absent from the entry when you don't. JSON
has no comments, so this is the only place to explain what an entry does. The
rest are ordinary debugger expressions evaluated in the stopped frame, with
{sym} standing in for the variable. If p myvar.w works in the Debug
Console, "{sym}.w" works here. Your entries take precedence over the
built-ins, so you can also override how a built-in type is read.
Try it: stop at a breakpoint where your variable is in scope and run OID:
Plot Variable.
If nothing plots, it's one of two things.
The file itself failed (missing, unreadable, wrong version, or an
entry skipped for a bad or missing field) is reported in the Debug
Console, prefixed [OpenImageDebugger]:
[OpenImageDebugger] DEBUG: Types file /path/.oid/types.json does not exist; skipping
A misspelled field name is reported the same way. The entry is skipped rather
than run with that field missing. The message names the entry and every problem
it found (elided here; the real line is one long one):
[OpenImageDebugger] WARNING: Skipping types entry '^MyImage$' from
/your-project/.oid/types.json: missing required field "width"; unknown key(s)
['widht']; …
An entry is identified by its name, or (as here) by its match pattern
when it has none.
That check applies to keys inside an entry; an unrecognized key at the top
level of the file, alongside version and types, is left alone.
A matched entry's expression failed to evaluate (say "{sym}.w" when
the field is actually width). That shows up differently: a warning
notification naming the variable, with detail in OID: Show Logs.
The file is read once per debug session, so restart the session after
editing it.
Padded rows, channel counts, enum and computed dtypes, conditionals, template
arguments and the full field list are covered in
Declarative buffer types.
Licensing FAQ
- Offline? Licensed installs work offline for up to 3 days between license checks.
- New machine? Deactivate on an old machine (or contact support) — licenses
cover up to 3 machines.
- Refunds? Handled by Polar (our payment provider) per their standard policy.
Based on the open-source Open Image Debugger
project (MIT) — see THIRD-PARTY-NOTICES.md.

