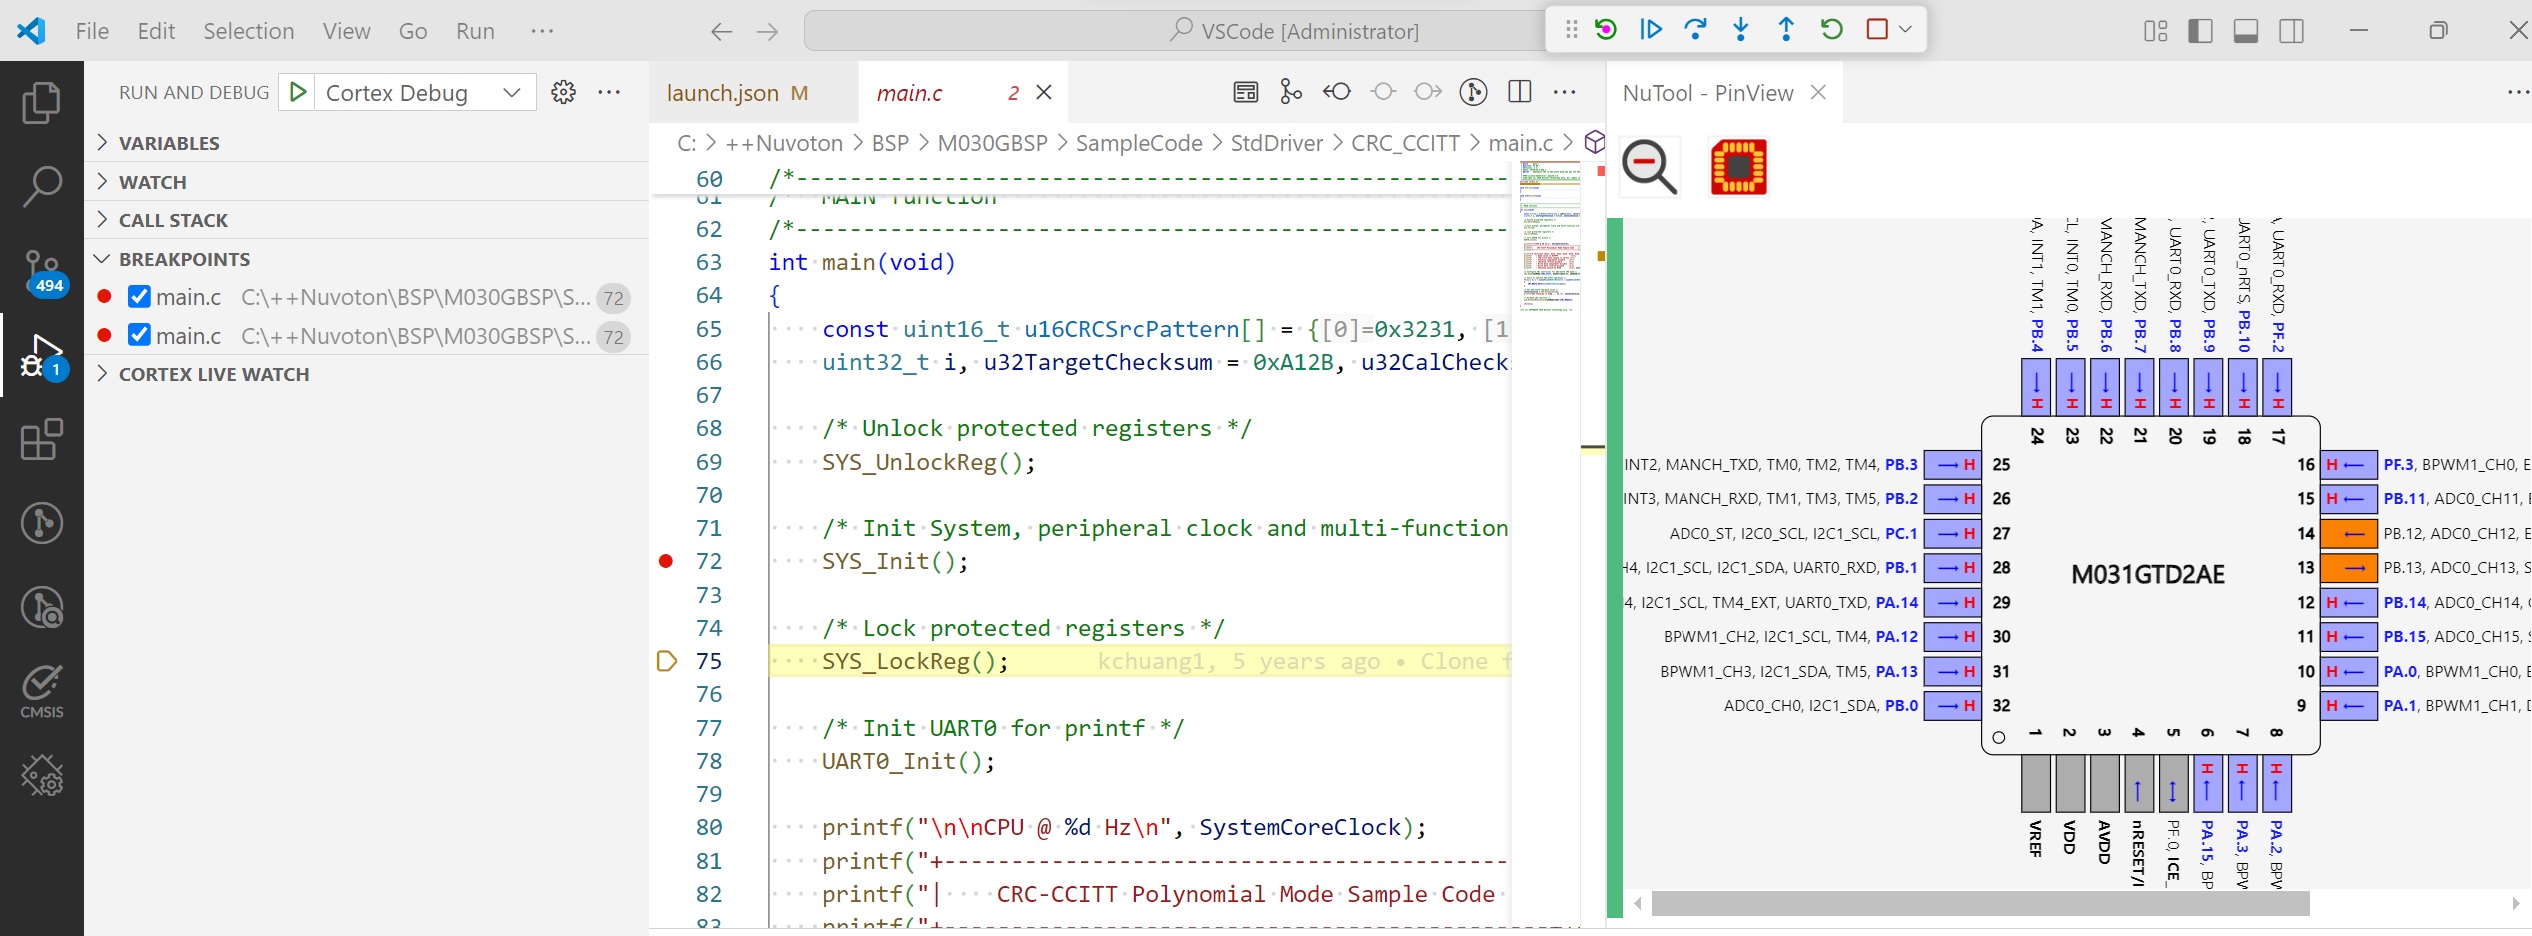
NuTool-PinView is a monitoring and visualization tool that can immediately show the current status of I/O pins, and inform users of certain common pin configuration errors.
Identify the pin function using the background and text colors:
As a general-purpose input/output (GPIO) pin, it shows in blue color.
As a peripheral device pin (e.g., UART, SPI, PWM), it shows in other colorful colors except blue.
Others, it shows in gray color.
Display the pin configuration
If you move the mouse cursor over the pin, a pop-up tooltip that includes one or more of the following descriptions will show up:
The value of multi-function and clock setting registers corresponding to the current pin.
The text of input and output state descriptions for GPIO.
The clock source and frequency of peripheral device.
The baud rate of universal asynchronous receiver/transmitter (UART) device.
The sampling frequency of Pulse-width modulation (PWM) device.
Display an alert for abnormal pin
While detecting the pin in an abnormal status, the pin number will be displayed in red color. Meanwhile, if you move the mouse cursor over the pin, the pop-up tooltip will show the cause messages in red color. The possible abnormal status is described as follows:
The electrical leakage for GPIO pin.
The value of multi-function setting register is undefined.
The clock source of peripheral device is unavailable.
The baud rate setting of UART device exceeds the valid range.
The pre-scale register setting of PWM device is invalid.
To zoom in/out
Mouse cursor over + Ctrl + roll the scroll mouse wheel forward.
Mouse cursor over + Ctrl + roll the scroll mouse wheel backward.
Requirements
Visual Studio Code: Version 1.54.0 or higher is recommended.
Commands
Open the Command Palette (CMD+Shift+P on macOS and Ctrl+Shift+P on Windows/Linux) and type in one of the following commands: