Nsight Visual Studio Code Edition
Nsight Visual Studio Code edition is an extension for
Visual Studio Code that
provides support for CUDA
development, including features such as Intellisense, debugging, debugger views,
and productivity enhancements.
Benefits
Higher Productivity
Using smart CUDA auto-code completion features improves the overall
development experience and enables users to save time and effort when writing
code.
Interactivity
Debugging with Nsight Visual Studio Code Edition provides diverse benefits,
including code formatting, easy navigation through source code, displaying and
interacting with different source files, building executables, and testing.
Remote Development Support
Nsight Visual Studio Code Edition enables developers to implement CUDA code in
various cluster environments such as Virtual Machines or remote Docker
containers. It also supports code development for Linux systems via the Remote
– WSL extension.
Free
As with other Nsight tools from NVIDIA, Nsight Visual Studio Code Edition is
offered free of charge. We love it when your code works better and is
delivered sooner. Enjoy!
Key Features
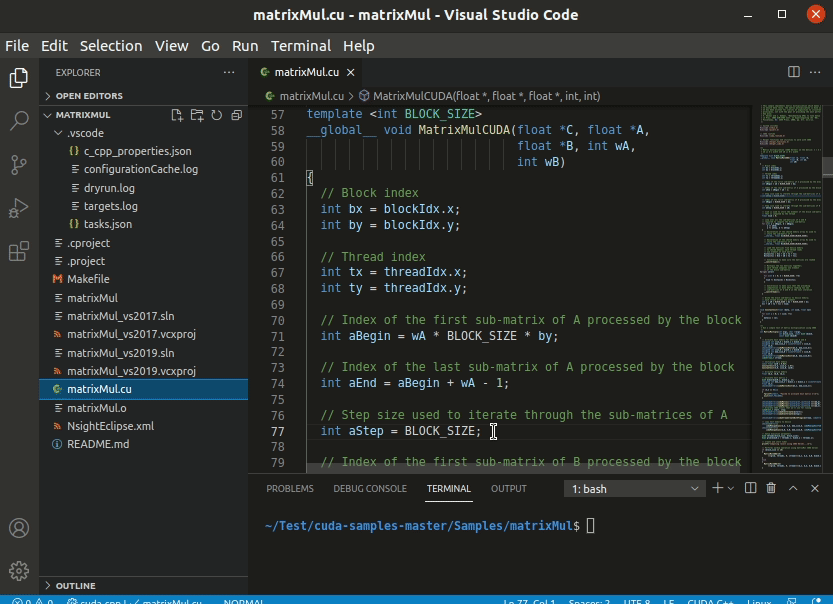
CUDA Syntax Highlighting for Code Development and Debugging
Edit code productively with syntax highlighting and IntelliSense for CUDA
code. Auto-completion, go to definition, find references, rename symbols, and
more all seamlessly work for kernel functions the same as they do for C++
functions.
CUDA Kernel Breakpoint Support and Kernel Execution Control
Break into a debugging session in CPU or GPU device code using standard
breakpoints, including support for conditional breakpoints with expression
evaluation. GUI controls allow you to step over, into, or out of statements in
the source code, just like normal CPU debugging. Breakpoints are evaluated for
every kernel thread and will halt execution when any thread encounters them.
GPU and Kernel State Inspection
Break into the debugger to see all the detailed information at any point in
the application with GPU debugging support for register, variable, and
call-stack. There is watchlist support to add specific variables of interest
for tracking. Additionally, there are focus controls to manually select
block and thread coordinates to switch the debugger
focus.
Want to know more?
Requirements
CUDA Toolkit: Install the CUDA Toolkit to get important tools for
CUDA application development including the
NVCC compiler driver and
cuda-gdb, the NVIDIA tool for debugging CUDA.
Microsoft vscode-cpptools:
Install Microsoft's C/C++ for Visual Studio Code to get Intellisense support for CUDA C++ code.
Nsight VS Code Edition will automatically install this extension.
Quick Start
Open or create a new CUDA application.
Configure the debugging connection
by creating a launch configuration to launch and debug your application, or
an attach configuration if the target application is already running
Start debugging!
Support
Reach out to us for feedback and questions via our developer forum.
Data and telemetry
This extension collects usage data and sends it to NVIDIA to help improve our products. This
extension respects the "telemetry.enableTelemetry" setting, for more info see
Visual Studio Code Telemetry.
| |
