Gimlet
Gimlet is a VSCode Extension that makes Solana smart contract debugging seamless, automated, and fully integrated into the VS Code experience.
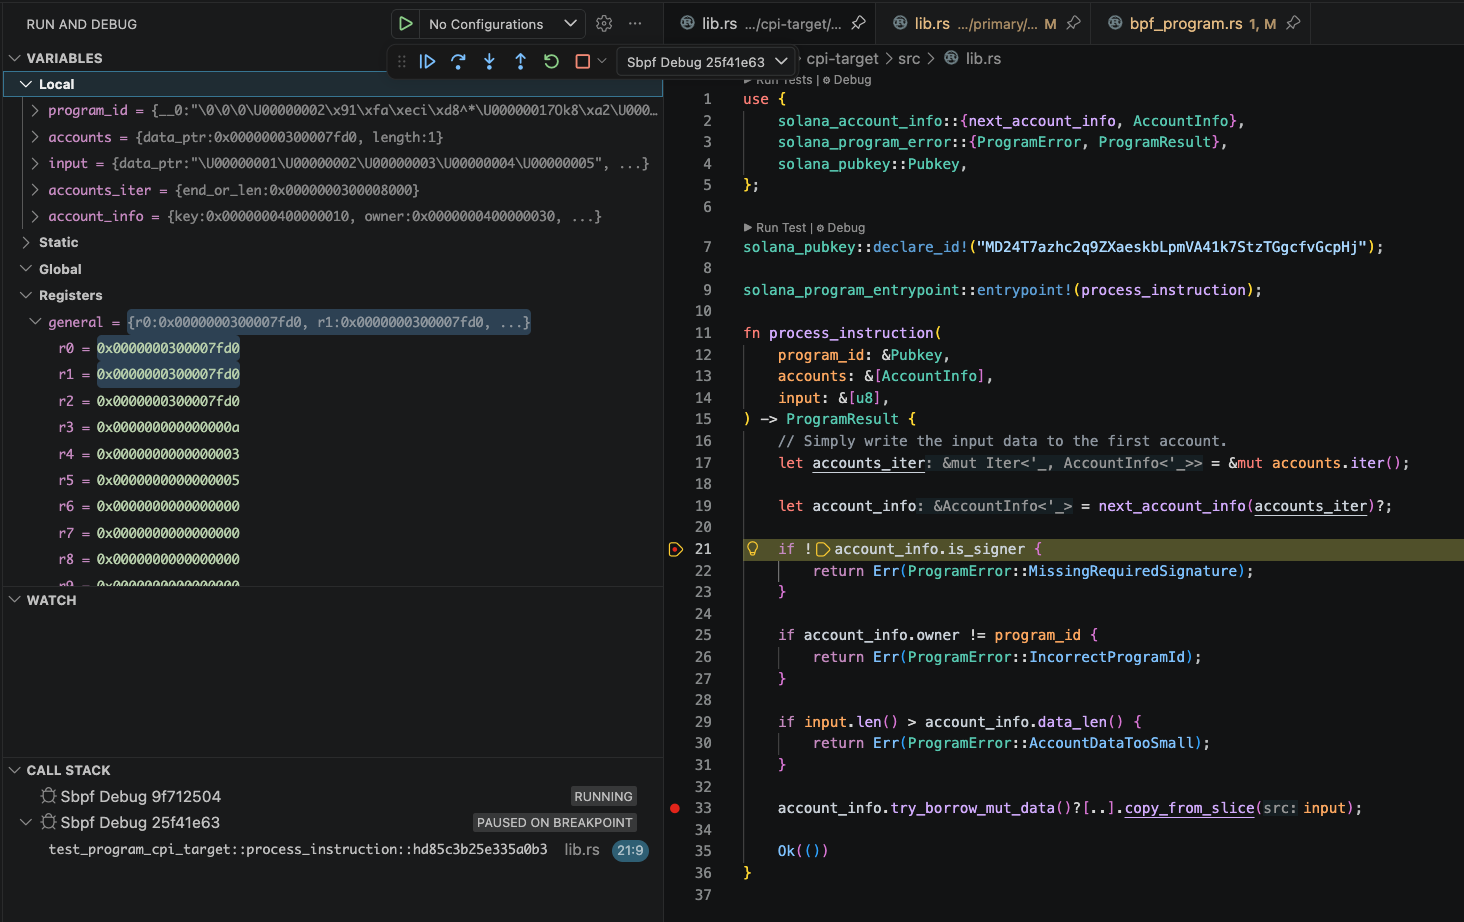
Table of Contents
Prerequisites
Before using Gimlet, ensure you have the following tools installed:
Introduction
When the sbpf-debugger feature is enabled in a Solana testing framework - currently Mollusk (available in mollusk-svm v0.13.0 or higher by Anza's buffalojoec), with LiteSVM and surfpool on the way (pending alignment with Agave 4.0) - each instruction typically spins up a VM that, if both SBF_DEBUG_PORT and SBF_TRACE_DIR are set, listens on that TCP port via a gdbstub. Gimlet connects to this port using the tcpPort setting (which must match SBF_DEBUG_PORT) and launches lldb with a special library provided by the Solana platform-tools, setting up the symbols needed to load and debug ELF files (your compiled Solana programs). CPI (Cross-Program Invocation) debugging is supported as well.
Note: Gimlet currently works with the Solana custom toolchain, which supports dynamic stack frames - a requirement when building without optimizations and with full debug information. In the future, the stack frame size will be configurable for debug builds, dropping the need for dynamic stack frames. We're open to adding upstream eBPF support as well, provided the upstream tooling gains the same stack frame configurability needed for debugging.
Getting Started with Gimlet
Gimlet makes debugging Solana programs inside VS Code effortless. Follow these steps to get started:
1. Automatic Configuration
When you open your Solana project, Gimlet automatically creates a .vscode/gimlet.json configuration file.
You can customize this file to:
- Specify a different platform-tools version
- Point Gimlet at a custom platform-tools install (Nix, renamed dirs, custom toolchains, CI containers)
- Override the LLDB library file directly (non-standard
liblldb names or missing symlinks)
- Change the default TCP port used for debugging
- Control whether the debugger stops on entry or runs straight to your first breakpoint
| Option |
Default |
Description |
tcpPort |
1212 |
TCP port the gdbstub listens on. Must be in the unprivileged range - strictly greater than 1023 and less than 65536. |
platformToolsVersion |
"1.54" |
Solana platform-tools version. Major.minor only (e.g. "1.54"); minimum supported is 1.54. |
stopOnEntry |
true |
Stop at program entry point; set to false to skip to the first breakpoint |
sbfTracePath |
target/sbf/trace |
Workspace-relative path to the SBF trace directory. |
artifactsPath |
target/deploy/debug |
Workspace-relative path to the directory holding your compiled .so programs (plus .debug files); must stay inside the workspace. Resolved in order: (1) this key when set; (2) $CARGO_TARGET_DIR/deploy/debug if that env var is exported; (3) target/deploy/debug. |
platformToolsPath |
~/.cache/solana/v{platformToolsVersion}/platform-tools/ |
Absolute path to your platform-tools root. Gimlet derives the LLDB library, Python site-packages, and scripts dir from {platformToolsPath}/llvm/{lib,bin}/ - override when your toolchain lives outside the default cargo build-sbf cache location. |
lldbLibraryPath |
{platformToolsPath}/llvm/lib/liblldb.{ext} |
Absolute path to a specific liblldb.dylib / liblldb.so file. Wins over the derived LLDB default - use for non-standard library filenames (e.g. liblldb.20.1.7-rust-dev.dylib) or missing liblldb.{ext} symlinks. Does not affect Python/scripts paths; pair with platformToolsPath when the whole install is non-standard. |
Which key do I need? platformToolsPath alone covers most cases - it reroutes all three paths Gimlet depends on. Use lldbLibraryPath only when the LLDB library filename is non-standard or its symlink is missing. Leave both unset for the default cargo build-sbf layout at ~/.cache/solana/v{platformToolsVersion}/platform-tools/.
Gimlet also adjusts a few VS Code workspace settings (.vscode/settings.json) to ensure smooth integration:
| Setting |
Value |
Why |
lldb.library |
Path to Solana platform-tools liblldb |
Points CodeLLDB at the Solana-patched LLDB that understands sBPF ELFs |
lldb.adapterEnv → PYTHONPATH |
Path to platform-tools Python packages |
Ensures LLDB can find its Python dependencies at startup |
2. Setup Steps
- Open VS Code in your Solana project folder.
- Install the Gimlet extension from the VS Code Marketplace.
- Build your program with debug symbols (at the time of writing, this uses dynamic stack frames):
RUSTFLAGS="-Copt-level=0 -C strip=none -C debuginfo=2" cargo build-sbf --tools-version v1.54 --debug --arch v1
- For example, with Mollusk, run your test with the debugger enabled (ensure your workspace's
Cargo.toml includes the sbpf-debugger feature):
SBF_DEBUG_PORT=1212 SBF_TRACE_DIR=$PWD/target/sbf/trace cargo test
SBF_TRACE_DIR is required: it tells the framework where to emit program_ids.map, which maps each program ID to the SHA-256 of its ELF. Gimlet uses this mapping to locate the matching debug symbols.
- Watch the Gimlet status-bar item (bottom-left of VS Code) for the gdbstub state:
Gimlet: Idle → no gdbstub on the configured tcpPortGimlet: Ready → gdbstub is listening; ready to attachGimlet: Attached → debug session is live
- Once it shows Ready, attach by either:
- Opening the Gimlet pane in the activity bar (Gimlet icon on the left sidebar) and clicking Attach Debugger, or
- Running
Gimlet: Attach Debugger from the Command Palette.
- Set breakpoints and step through your code using the standard VS Code debug controls. To disconnect, click Stop Session in the Gimlet pane or run
Gimlet: Stop Debug Session.
Troubleshooting
Permission Denied When Trying to Debug a Program
Refer to the Apple Developer Forum thread for instructions on disabling debugging protection for macOS systems.
We recommend using platform-tools version v1.54.
To force-install the correct version inside your Rust project, run:
cargo build-sbf --tools-version v1.54 --debug --arch v1 --force-tools-install
Python Issues
If for some reason you're willing to debug by hand and lldb fails to start due to missing or mismatched Python, follow the upstream guide: README_SOLANA_LLDB_PYTHON.md.