System Monitor


中文说明
A lightweight VS Code / Cursor extension for monitoring system resources on remote/local Linux (Remote-SSH, WSL, Dev Containers, local Linux, etc.).
Features
| Category |
Details |
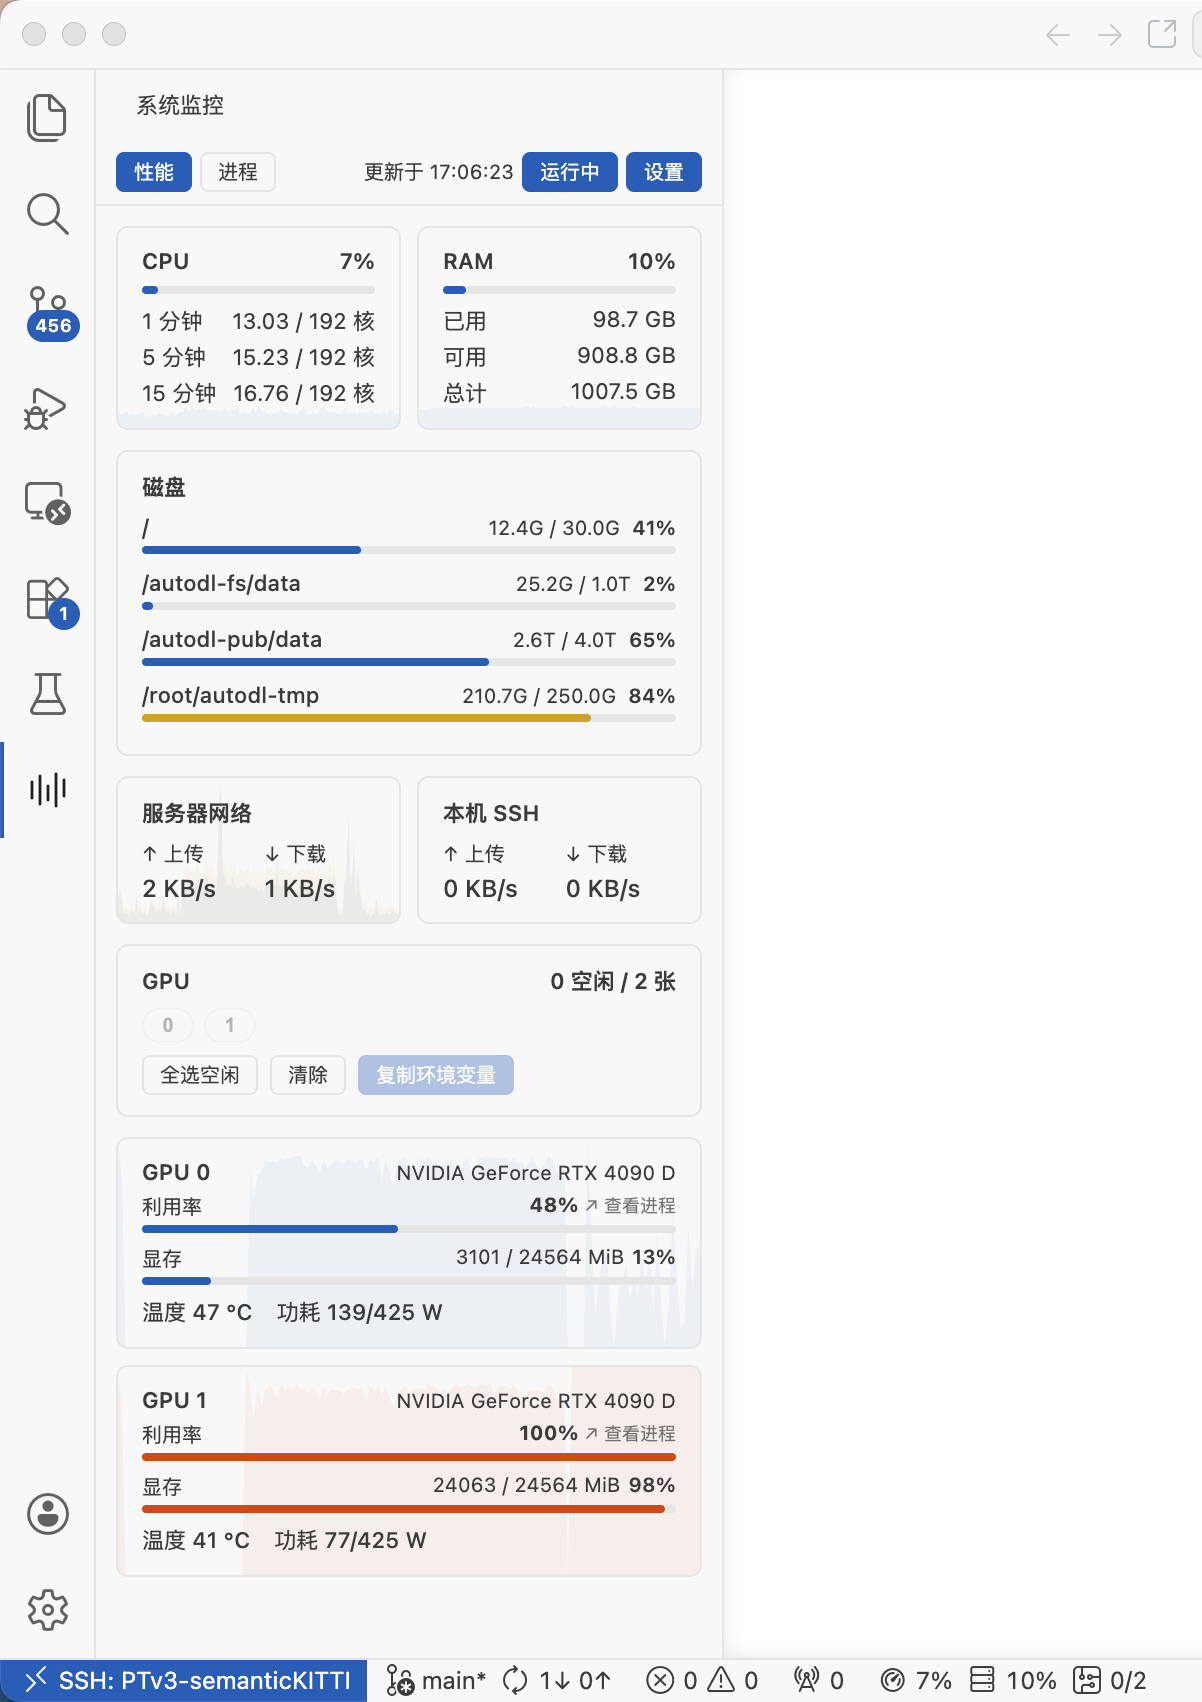
| CPU |
Usage %, 1/5/15 min load, core count, sparkline chart |
| RAM |
Used / Available / Total, sparkline chart |
| Disk |
Mount points with progress bars, real-time R/W speed with sparkline, configurable filters |
| Network |
Upload & download speed, sparkline charts |
| SSH Traffic |
Upload & download through your SSH connection |
| GPU |
NVIDIA utilization, VRAM, temperature, power draw (multi-GPU) |
| GPU Picker |
Select idle GPUs, copy CUDA_VISIBLE_DEVICES with one click |
| Process Manager |
Sort by CPU / RAM / GPU, searchable, right-click to copy cell, row, or PID |
| Status Bar |
Customizable position, priority, and displayed metrics |
| Settings |
Built-in settings panel with live preview — no JSON editing needed |
| i18n |
Chinese & English, auto-detected |
Process Manager
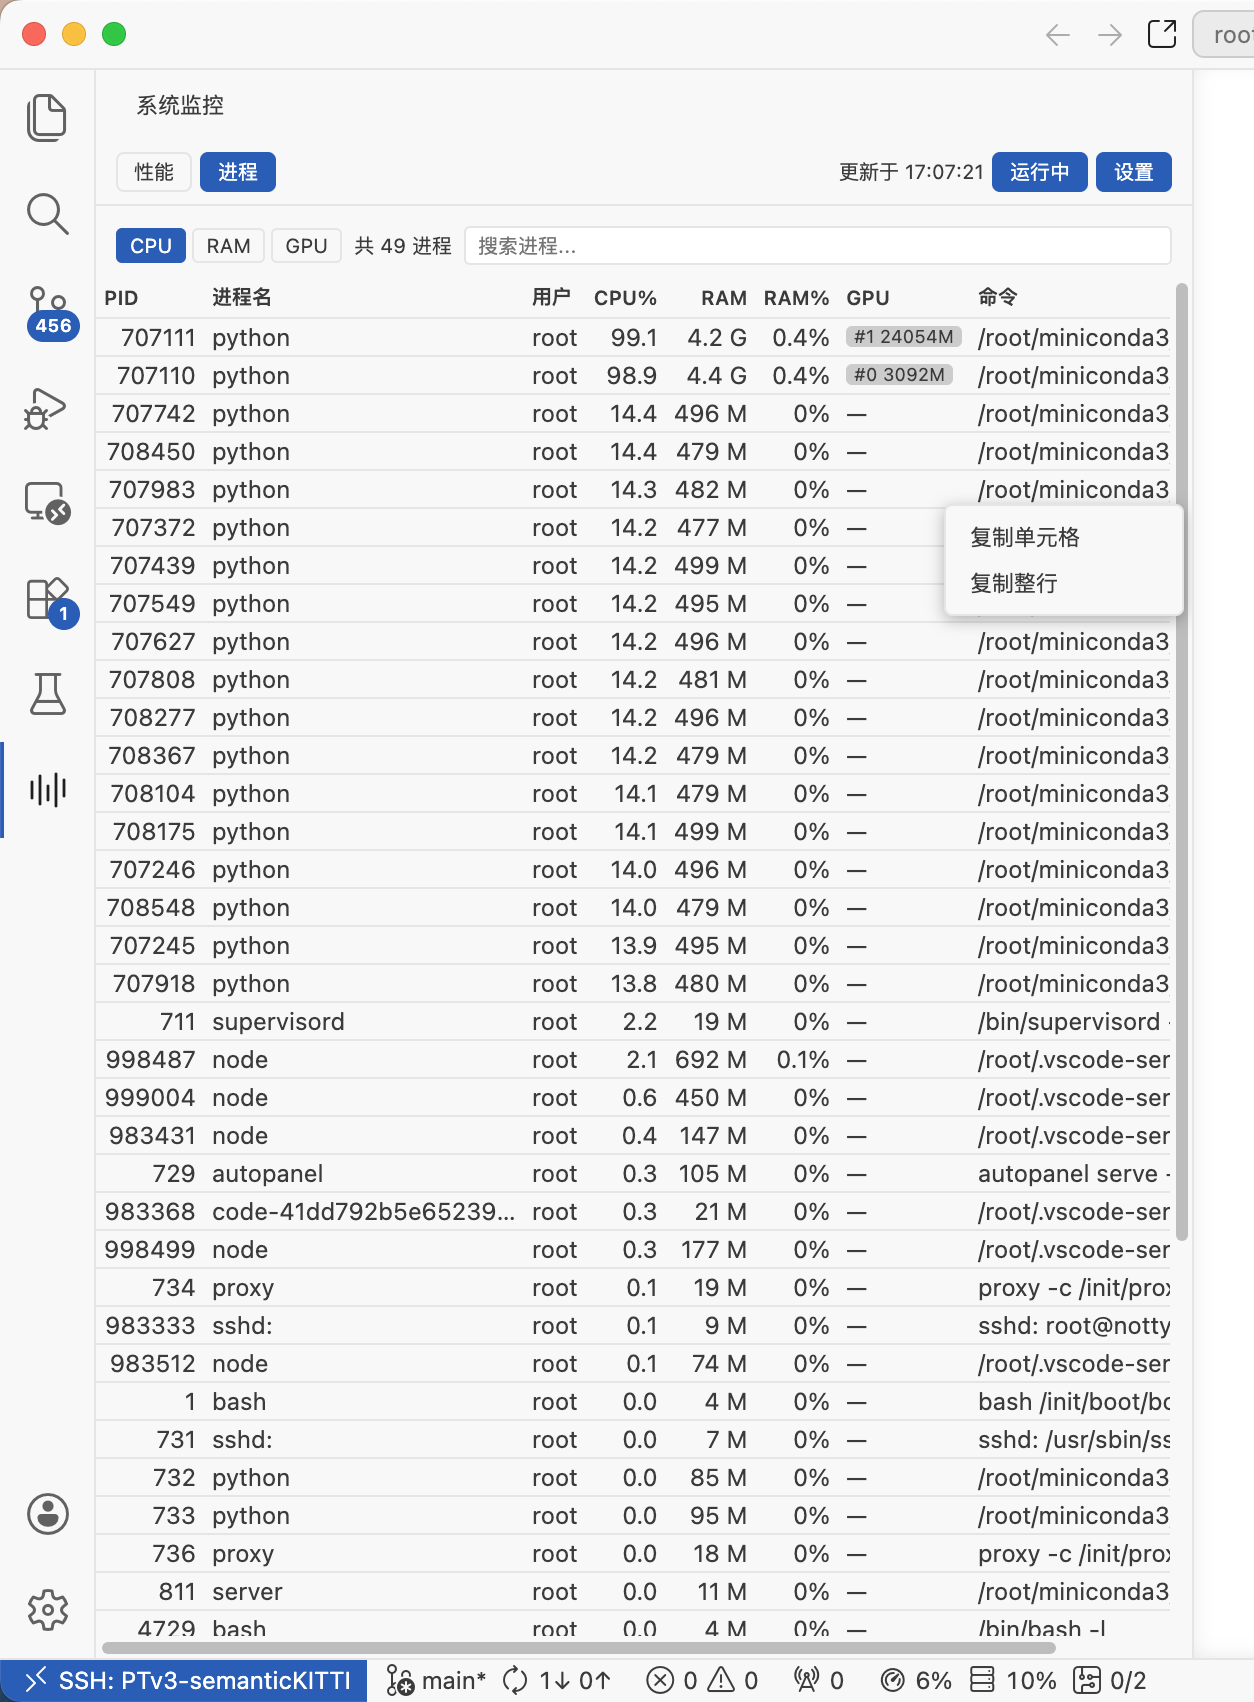
- Sort by CPU, RAM, or GPU usage
- Search by process name, PID, user, or command (
GPU0 / #0 syntax to filter by GPU card)
- Right-click context menu: Copy Cell / Copy Row (full command included) / Copy PID
Settings Panel
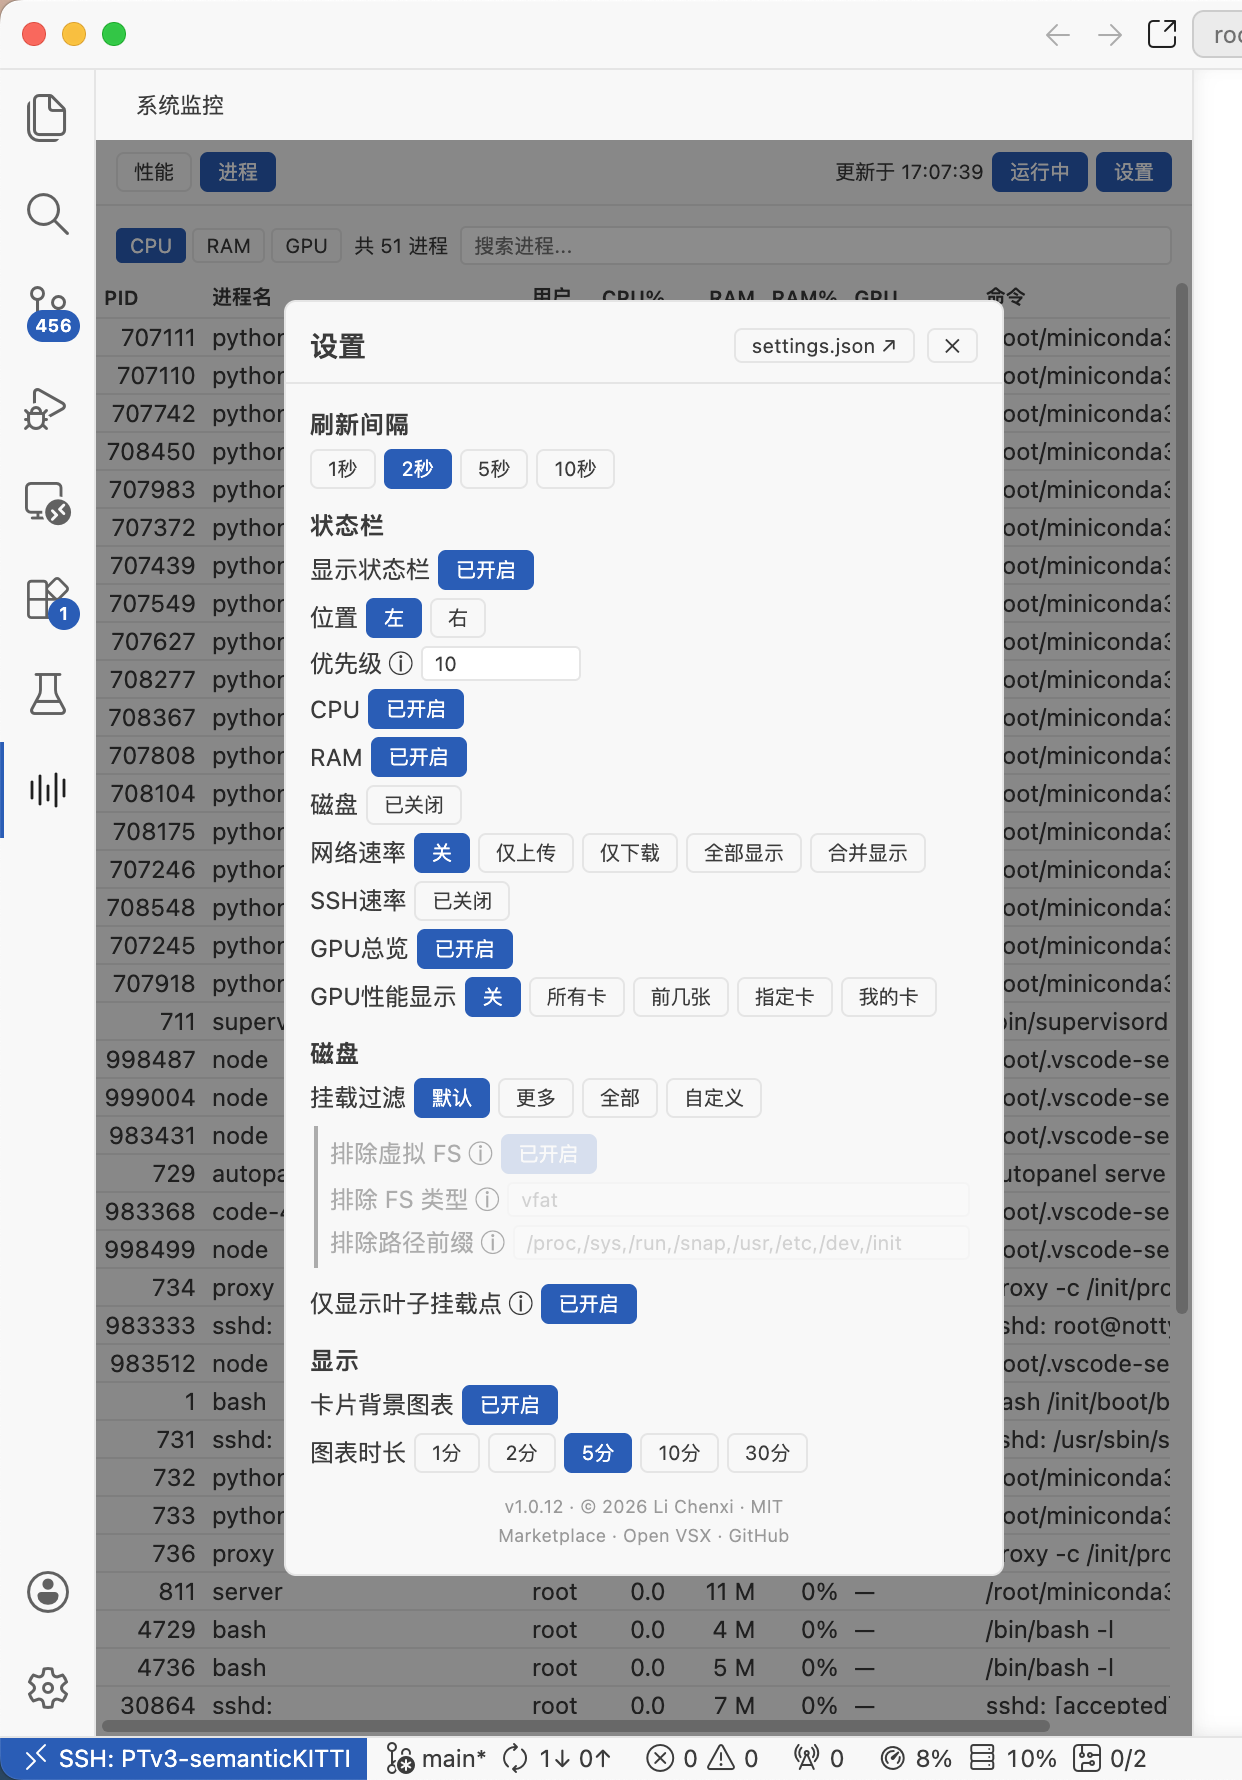
- Refresh Interval — 1s / 2s / 5s / 10s
- Status Bar — Toggle visibility, position (left/right), priority, choose which metrics to display
- Disk Filter — Default / More / All / Custom (exclude FS types, path prefixes, virtual FS)
- Display — Enable/disable sparkline charts, chart duration (1–30 min)
Quick Start
- Install the extension from Marketplace or Open VSX
- Open a Linux workspace — Remote-SSH, WSL, Dev Container, or a local Linux desktop
- The sidebar icon and status bar metrics appear automatically
Note: The system must be Linux. On remote connections (SSH / WSL / Dev Container), the extension runs in the remote extension host. On local Linux, it reads system info directly. On non-Linux local machines, the extension offers to add itself to remote.SSH.defaultExtensions for auto-install on remote servers.
First launch
- Remote-SSH / local non-Linux: The extension offers to add itself to
remote.SSH.defaultExtensions so it auto-installs on every server you connect to.
- Local Linux: The extension activates immediately and monitors the local system.
Configuration
All settings are accessible via the Settings button in the sidebar panel. You can also edit settings.json directly:
{
  "sysmonitor.refreshInterval": 2,
  "sysmonitor.statusBar": {
    "barEnabled": true,
    "alignment": "left",
    "priority": 10,
    "cpu": true,
    "ram": true,
    "net": "both",
    "ssh": true,
    "gpu": {
      "summary": true,
      "mode": "all",
      "metric": "both",
      "skipIdle": false
    }
  },
  "sysmonitor.disk": {
    "mountFilter": "default",
    "hideParentMounts": true
  }
}
GPU status bar modes
| Mode |
Description |
"off" |
No per-card stats |
"all" |
Show all cards |
"first" |
Show first N cards ("firstN": 4) |
"specify" |
Show specific cards ("cards": [0, 1, 3]) |
"my" |
Show only cards used by your processes |
Disk filter modes
| Mode |
Description |
"default" |
Excludes vfat, virtual FS, and common system paths |
"more" |
Only excludes virtual FS |
"all" |
Shows everything including virtual FS |
"custom" |
Configure FS type exclusions, path prefix exclusions, and virtual FS visibility |
Requirements
- Linux (remote or local)
- NVIDIA GPU monitoring requires
nvidia-smi
- SSH traffic monitoring requires
ss (remote connections only)
Contributors


License
MIT
| |
