Why CodeCount
Most line counters tell you how big your project is. CodeCount tells you what changed, who changed it, and when and it assumes the branch you're on is usually the thing you care about.
|
|
| Branch-native |
On a feature branch every panel scopes to that branch's work, including changes you haven't committed yet. On main you get the full history. A ⎇ badge always says which view you're looking at. |
| Numbers that agree |
Every breakdown daily, weekly, hourly, punch card, histogram is derived from one shared commit dataset. Change the granularity or the date range and the totals still reconcile. |
| Fast on big repos |
Expensive git queries run only when you expand a row. Opening the sidebar never blocks on a full-history scan. |
| Genuinely self-contained |
Charts are bundled, not fetched. Works on a plane, behind a corporate proxy, or on an air-gapped machine. Nothing is sent anywhere. |
|
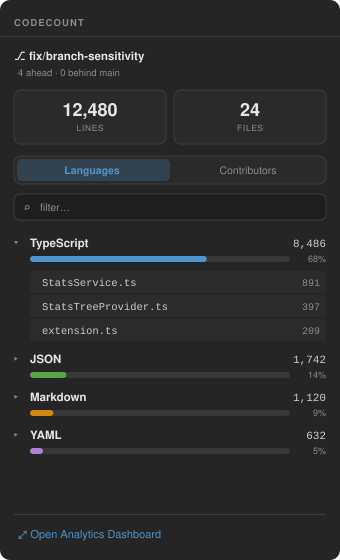
Click the CodeCount icon in the Activity Bar. The panel opens with your branch status, total lines and files, and two tabs.
Languages expand a language to list its files, sorted by size.
Contributors expand a person to see their languages, then their files.
Click any file to open it alongside its commit history. Pick a commit and it opens as a diff.
The history you get depends on where you clicked.
From Languages you see every author who ever touched that file.
From Contributors you see only the selected person's commits.
Heavy git work happens on expand, never on open so the panel stays responsive on repositories with tens of thousands of commits.
|
|
The Dashboard
Four tabs, each answering a different question.
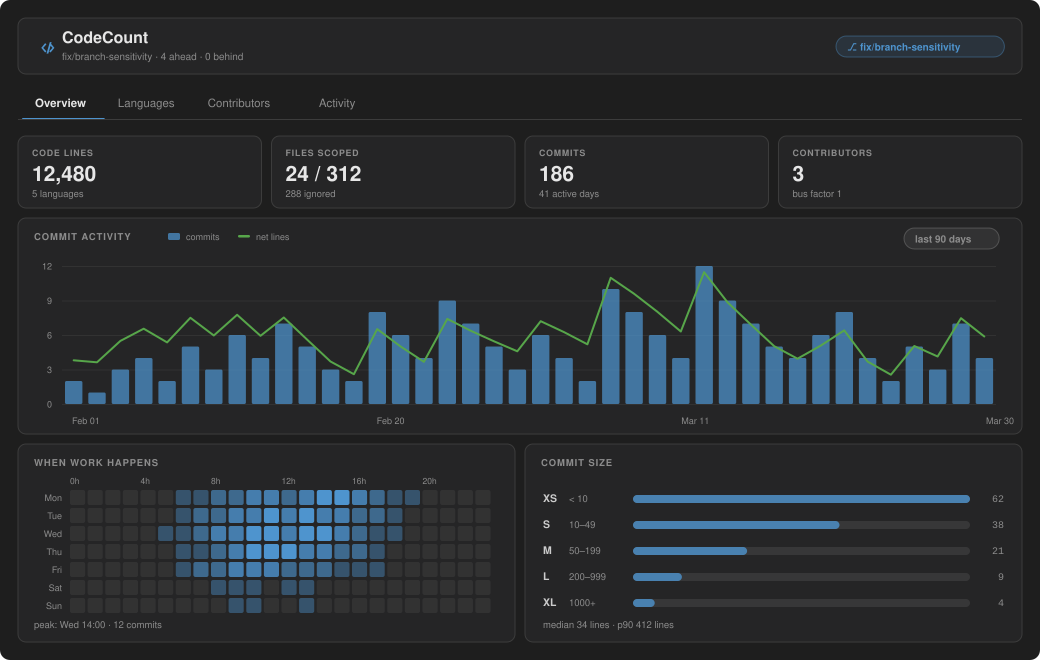
Overview what is the shape of this project?
Headline metrics, recent commit activity, and two things most tools don't show you:
- Punch card a weekday × hour heat map of when work actually happens
- Commit size distribution XS/S/M/L/XL histogram with median and p90, so you can see whether the team ships small changes or occasional monsters
- Most changed files where the churn concentrates
Languages what is this codebase written in?
A composition strip across the top, then line counts and file counts per language, then the largest individual files with their language badges.
Contributors who knows this code?
- Bus factor how few people account for more than half the churn
- Concentration each person's share of total change
- Activity over time stacked commits per author per month
Activity when does the work actually happen?
The full explorer. Date range with 7d / 30d / 90d / 1y / All presets, six granularities (Daily, Weekly, Monthly, Yearly, Weekday, Hour of day), and independent toggles for commits, additions and deletions. The cadence summary and punch card recompute against whatever you filter to.
From [2026-02-01] → [2026-08-04]      ⟨ 7d · 30d · 90d · 1y · All ⟩
Daily ▾    ☑ Commits   ☑ Lines added   ☑ Lines deleted

┌ CADENCE ─────────────┐
│ longest streak   9 d │
│ current streak   2 d │
│ avg gap        1.4 d │
│ busiest      Wed 14h │
│ active days       41 │
└──────────────────────┘
Questions it answers
| You want to know |
Where to look |
| "How much did this branch actually add?" |
Sidebar it scopes to the branch automatically |
| "Who should review this file?" |
Languages → file → history shows every author |
| "What has this person been working on?" |
Contributors → expand → languages → files |
| "Are we shipping small changes or big-bang commits?" |
Overview → Commit size distribution |
| "Is anyone committing at 2am?" |
Overview → punch card, or Activity → Hour of day |
| "What's our bus factor?" |
Contributors → Team card |
| "Which files never stop changing?" |
Overview → Most changed files |
| "Did we slow down last quarter?" |
Activity → set the range, switch to Weekly |
Features
Code metrics
- Workspace analysis total line counts across the project
- File-by-file breakdown per file and per extension
- Comment detection comment and blank lines counted separately
- Gitignore support
.gitignore patterns respected automatically
Git analytics
- Branch-aware everything a branch counts as active when it has commits ahead of the merge base or uncommitted and untracked changes, so no two panels disagree about what "this branch" means
- Six granularities Daily, Weekly, Monthly, Yearly, Weekday, Hour of day
- Day-precision date filtering plus presets, applied identically at every granularity
- Punch card weekday × hour heat map
- Commit size distribution with median and p90
- Cadence longest and current active-day streaks, average gap, average change per commit
- Knowledge concentration bus factor and per-person share of churn
- Most changed files highest add/delete churn in the scoped history
Presentation
- Theme-aware light, dark and high-contrast themes are all first-class. No hardcoded colors anywhere, including inside the charts
- Offline-first Chart.js ships with the extension; the sidebar uses no charting library at all
- Hardened webview strict Content-Security-Policy with a per-render nonce and no remote script sources
Quick start
- Install from the Marketplace
- Open a folder that is a Git repository
- Click the CodeCount icon in the Activity Bar
- Hit Open Analytics Dashboard at the bottom of the panel
No configuration, no API keys, no account.
Commands
From the Command Palette (Ctrl+Shift+P / Cmd+Shift+P):
| Command |
Description |
Open Analytics Dashboard |
Open the full four-tab dashboard |
Show File History |
Open a file alongside its commit history picker |
Count Lines of Code |
Analyze the active file |
Count Lines of Code in All Files |
Analyze the entire workspace |
Count Lines of Code by Extension |
Break down by file type |
Refresh CodeCount Stats |
Clear caches and refresh sidebar and dashboard |
FAQ
Does any of my code leave my machine?
No. CodeCount shells out to your local git and reads files in your workspace. There is no telemetry, no network call, and no remote script the Content-Security-Policy on the webview forbids remote sources outright.
Do I need a Git repository?
For language line counts, no. For anything involving contributors, commits, branches or history, yes that data comes from git itself.
Why does my feature branch show so few files?
That's the point. On a feature branch CodeCount scopes to what that branch touched, so you see the size of your change rather than the size of the repository. Switch to main for the full picture the ⎇ badge tells you which mode you're in.
I'm on a branch with changes but no commits yet. Why are the charts empty?
Commit-derived metrics genuinely have nothing to show yet. Rather than rendering misleading zeros, those sections say so explicitly and tell you how many files you've changed in the working tree.
Is it slow on large repositories?
Opening the sidebar is cheap. The expensive queries a contributor's per-language and per-file history run only when you expand that specific row, and results are cached until your branch or refs change.
Which branch does it compare against?
It resolves a merge base against main, then master, then origin/main, then origin/master the first one that exists.
Requirements
|
|
| VS Code |
1.115.0 or newer |
| Git |
Required for contributor, commit and branch analytics |
How it works
|
|
| Language |
TypeScript strict mode, ES2022, Node16 modules |
| Build |
Compiled straight to out/ with tsc. No bundler, no runtime dependencies |
| Charts |
Chart.js v4 vendored at media/chart.umd.js, loaded via asWebviewUri |
| Git |
Every call goes through runGit using execFile no shell spawning, no injection surface |
| Data model |
One compact commit array is shipped to the webview and every breakdown is derived from it. That is why the numbers stay consistent no matter how you slice them |
Contributing
Issues and pull requests are welcome.
npm install
npm run watch     # TypeScript in watch mode
# press F5 in VS Code to launch an Extension Development Host
npm run lint      # ESLint over src/
npm run compile   # one-shot build
MIT licensed see LICENSE
Made for people who want to know where their code actually went.