Debug Inspector
Visualize your own C/C++ data structures — threads, semaphores, mutexes, queues, linked lists, any struct collection — as live, sortable tables while debugging with GDB. Config-driven and read-only.
Debug Inspector turns the structures you describe into clean, tabbed, sortable tables that refresh every time your GDB (cppdbg) session stops. Point it at any global expression — a thread-control-block list, a semaphore pool, a ready/blocked queue, a timer array, an intrusive free-list, or any node list — and it walks that structure and renders it for you, no more manually expanding nodes in the debugger. What appears is driven entirely by a small debug-inspector.json file you write, so the extension knows nothing about your types and works with any C/C++ codebase: bare-metal, a hobby or commercial RTOS, or plain application code. It is aimed at embedded / RTOS developers inspecting their own kernels, but it is just as useful to any C/C++ developer who wants a live view of a struct collection. It is strictly read-only for your program: it never calls functions and never writes your memory — the only set commands it issues target dedicated GDB convenience variables ($ri_* / $rg_*) used as traversal cursors.
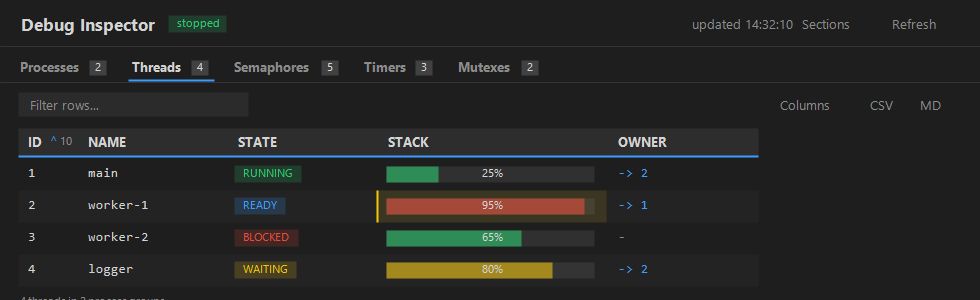
Representative panel — per-process threads with State badges, stack‑usage bars, an Owner cross‑reference link, change highlighting, and per‑column number‑base / sort controls.
Graph view
Toggle any section to an interactive node graph. Linked lists and arrays flow as a serpentine grid with arrowed edges; tree structures render as a top-down hierarchy. Cards size to their content, colour‑code state, draw usage bars, and show value‑mapped labels — and you can pan, zoom, drag nodes, search, and follow cross‑section links, with a minimap for large graphs.
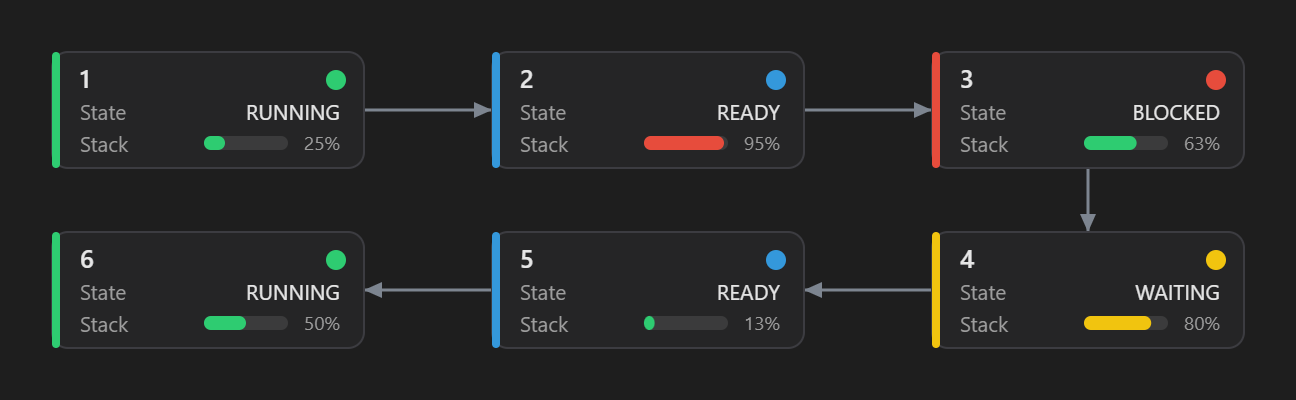
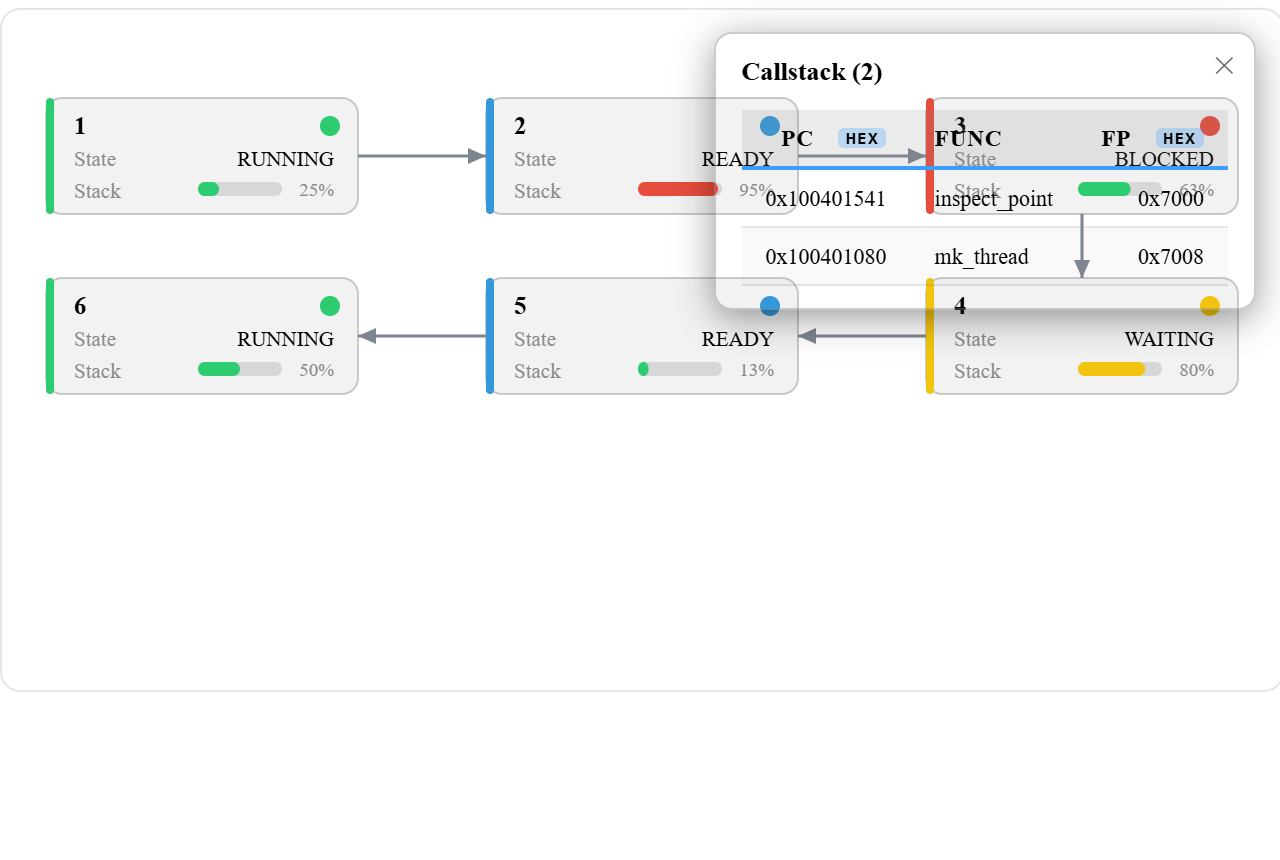
A linked thread list as a node graph: per‑state colour stripes/dots, stack‑usage bars, and arrowed next edges in a serpentine layout.
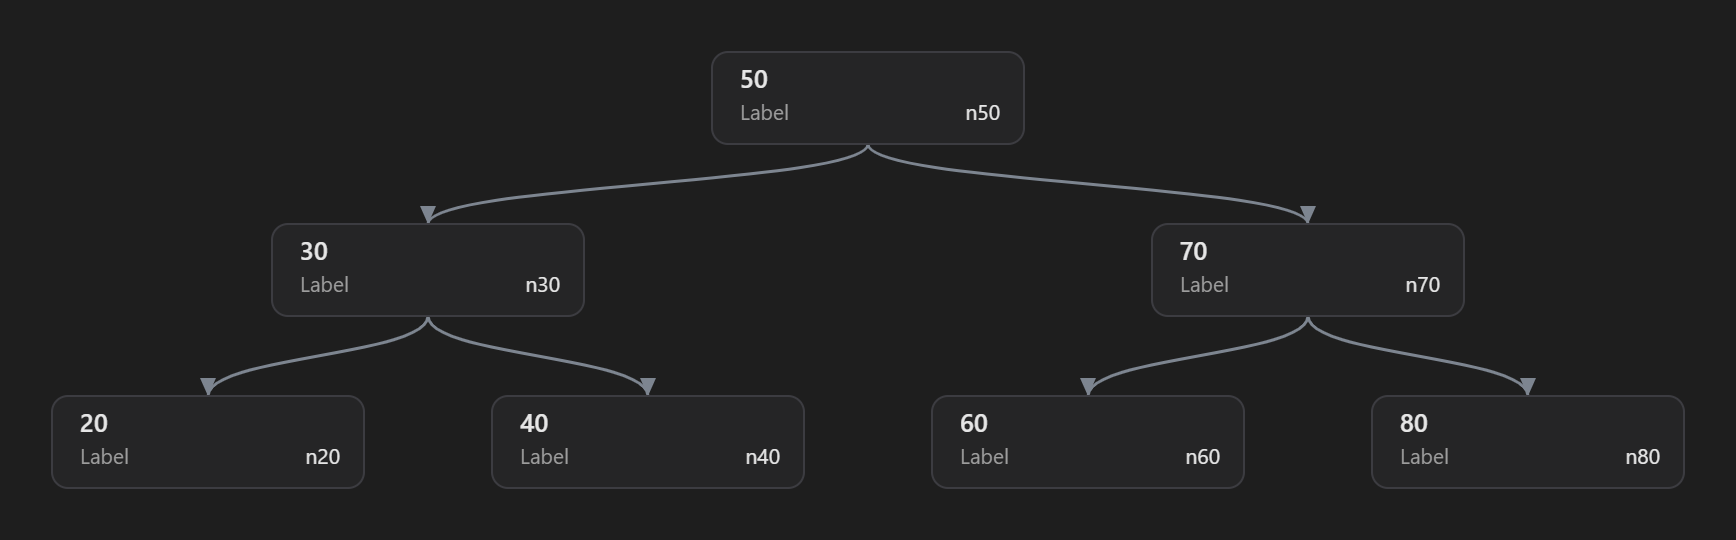
A binary search tree as a hierarchy: edges leave each parent's bottom‑centre and enter each child's top‑centre.
Features
- Config-driven, zero code changes. Describe each structure in JSON; the extension assumes no layout and needs no instrumentation in your program.
- Five traversal modes.
linked_list (follow a next pointer until NULL), array (iterate count elements), index_list (a list stored inside an array, linked by a next-index field, walking from head to nil; unused slots are skipped), tree (walk a tree from root by its child pointers — "children": ["left","right"] by default — rendered as a hierarchical tree in the graph view), and walk (a condition-bounded cursor unwind — the classic case being a call stack unwound by frame pointers — starting at start and continuing while a while predicate is true).
- Arbitrary root expressions.
root is passed to GDB verbatim, so anything valid works: head, g_sys.thread_list, g_kernel.pools[0]->thread_list.
- Live updates. The panel refreshes on every stop and shows a
running… badge while the program runs; a status pill reads stopped / running… / paused, plus an updated <time> timestamp. The panel closes automatically when the debug session ends.
- Prioritized streaming refresh. On each stop the active tab is fetched and shown first, then the other visible sections stream in in the background. Switching tabs re-prioritizes — the tab you open jumps the queue and is fetched next — so large workspaces stay responsive. Sections still in the queue (and newly revealed ones) show a “Loading…” placeholder until their data arrives, and each tab shows a spinning ⟳ while its section is still being fetched — so you can watch sections update one by one. The Refresh button reflects the overall state.
- Progressive per-row rendering. Within a section you don't wait for the whole list either — rows appear as they're fetched (every GDB access is serialized, so a big or grouped section fills in gradually), under a pulsing
⟳ Loading… N rows banner that shows the fetch is still running. Flat sections fill row by row; grouped sections group by group. Change-highlighting, sorting, and filters apply to the final, complete result.
- Sortable columns. Click a header to sort (numeric/hex columns sort numerically, text alphabetically); click again to toggle direction. The choice persists across stops.
- Filter & changed-only. A per-tab filter box narrows rows as you type (focus is preserved) — plain text, or a field test like
PID>=3 / state=running (operators > >= < <= = !=, combinable); a Changed toggle shows only rows that moved since the last stop.
- Copy out & export. Copy the (filtered) table as CSV or Markdown in one click (grouped tables add a leading
Group column); or ⤓ JSON in the top bar exports every section's data to a JSON file (save dialog).
- Quick access to the config. A ⚙ Config button in the top bar opens your
debug-inspector.json (offering to create a starter if it doesn't exist yet). The same is available as the “Debug Inspector: Open Config File” command — bind it to any key from Keyboard Shortcuts (it ships with Ctrl/Cmd+K Ctrl/Cmd+I when the editor isn't focused).
- Per-column number base & alignment. Show any numeric column as dec / hex / bin via a click-to-cycle base button in the column header's top-right (
raw→bin→dec→hex), or set a default in config with a field's "base". Numeric columns right-align with tabular figures, and hovering any cell shows its full value in a tooltip.
- Sticky header. The header row stays put while you scroll a long table.
- Refresh on demand or on change. A Refresh button re-reads the config without restarting the debugger (its icon spins and reads “Refreshing…” while a refresh is in progress), and the panel also refreshes automatically when the config file changes on disk (while stopped). A config edit that only changes presentation — a column's
base, a bar's warn/crit thresholds, a link, badge colors, or a valueMap — is applied without re-reading anything from GDB; only data-affecting edits (expr, root/next/count/cast/wrap, mode, bar.max, editable, when, adding/removing fields, …) trigger an actual refresh.
- Pause / Resume. Stop auto-refreshing and querying GDB on each stop when you don't need it; Refresh still does a one-shot. Remembered per workspace.
- Change highlighting. Cells that changed since the previous stop are amber-highlighted, with the previous value shown faded and struck-through next to the new one. A
N changed badge shows the total; tabs that changed in the background flag their count.
- Pick & reorder columns. Drag a column header (or a row in the ▦ Columns menu) to reorder — a bold blue insertion line marks the drop target and a drag-preview chip follows the cursor. Right-click a header or use the menu to show/hide. Order and visibility persist per workspace. Hidden columns are not read from GDB at all; enabling one fetches only that column on the spot (merged into the existing rows — the rest of the panel isn't re-read).
- Grouping (tree). Relate sections: render one section, in its own tab, as a
collapsible tree grouped under a master section (
groupBy + ${master}) — e.g.
every process's semaphores under its process node — all at once, with a
flat-view toggle and a one-click Collapse all / Expand all control.
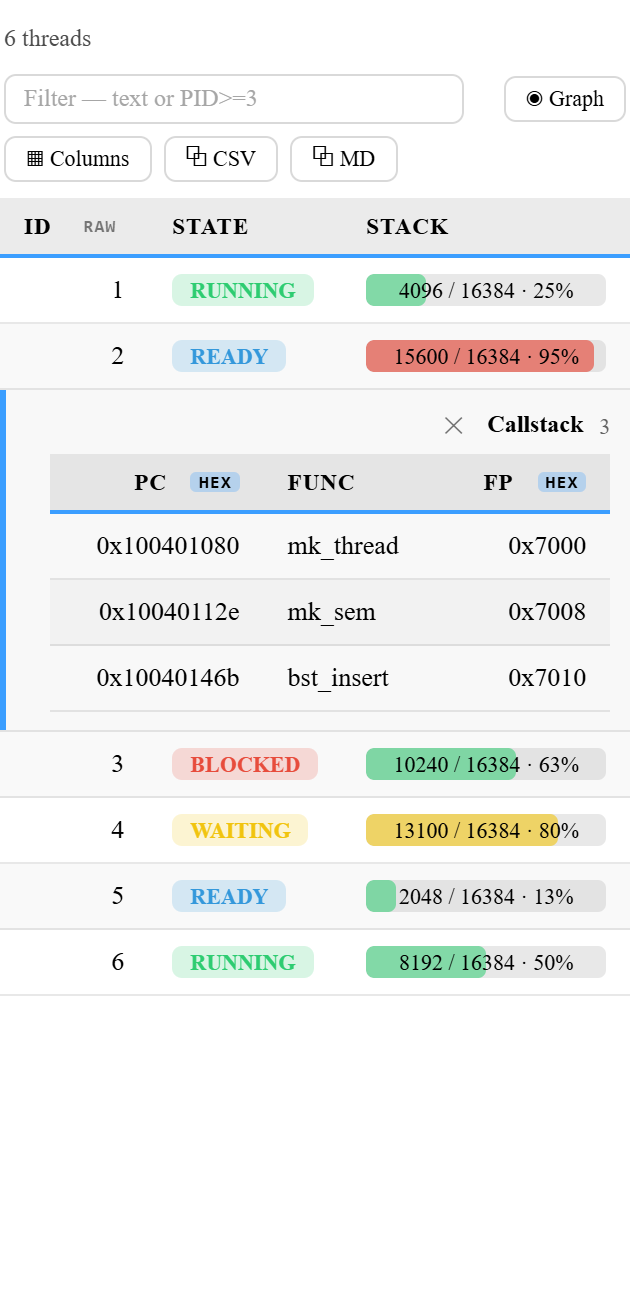
- On-demand detail. For data worth seeing one element at a time (a thread's
call stack, a node's sub-list), mark a section
selectedFrom a master and
right-click a row/node → Show … (detail). ${selected} scopes it to that
element; it expands inline below the row (table) or in the graph detail panel,
and refreshes on every stop while open. Pairs with walk for call stacks.
- Graph view. Toggle any section to an interactive node graph with ◉ Graph
(and back with ▤ Table). Linked/index lists flow as a serpentine grid along
their
next relationship; grouped sections as per-group swimlane columns (label
on top, members beneath); arrays as a card grid. Cards show the title, fields, state
colour and usage bar, and size their width to the section's content (compact for
short values, wider for long ones, uniform within a section). Hover highlights a node's neighbours, click opens a
details panel (which decodes values the same way the cards do — badge/valueMap/flags text and colours, with the raw
integer shown in parentheses — and grows/wraps so nothing is cut off), drag a node to reposition it (the placement is remembered and
follows the row across refreshes), drag the background to pan, scroll to zoom,
and ⤢ Fit to recentre. When a section has cross-references, a ⇄ Links toggle
overlays purple links to the linked rows in other sections (deduplicated; click a
target to jump to it). A Find box spotlights matching nodes — by text or a field
test like count>=3 / state=running (operators > >= < <= = !=, combinable),
with Enter / Shift+Enter to cycle — and a ◉ Map minimap helps you navigate large
graphs (its shape tracks the graph's aspect ratio, so a tall graph gets a tall map and a
wide one a short map). Grouped sections pack their groups into a balanced grid; drag a group's header
to move the whole block, or right-click a group → Collapse group to fold its members away (right-click again to expand;
this shares the table's collapse state). Cards show all of a section's visible fields. Right-click a
node to copy it as a watch expression. The ⇄ Links layer shows both outgoing and
incoming cross-section links (e.g. which mutexes own a thread). tree sections render
as a hierarchical tree with edges running from each parent's bottom into each child's top.
Drag nodes anywhere — the canvas grows in every direction and
shrinks back. From the table, right-click a row → Show in graph to jump to its node.
- Usage bars. Render a numeric field as a
used / max · % bar
(green → amber → red) with a field's "bar" — e.g. per-thread stack usage.
- Cross-reference links. A field with
"link" renders as a clickable link to
another object; clicking jumps to that section and highlights the matching row
(e.g. a mutex's Owner → the owning thread).
- Conditional fields. A field with
"when" shows only when its condition holds
(else blank) — several on one discriminator give tagged‑union / variant rows.
- Hide columns by default. Mark a field
"hidden": true to start it collapsed
(and unfetched) until you enable it from the ▦ Columns menu.
- Manage sections (tabs). Hide/show whole sections from the ▤ Sections menu
and reorder by dragging a tab (or a row in the menu) — instant (client-side),
remembered per workspace. Revealing a hidden section fetches only that section
(not the whole panel). A section can also start hidden with
"hidden": true
in config.
- Readable UI. Recognized columns get automatic styling: a
State column becomes a colored badge (RUNNING / READY / BLOCKED / WAITING — or your own value→color map via a field's "badge", or a value→text+color map via "valueMap"), plus a summary line per tab. Changed cells light up amber.
- Read-only by default (optional editing). Debug Inspector only reads your data — it never calls functions. A field can opt into editing with
"editable": true; then right-click → Edit value… writes it with GDB set var, and only the edited row is re-read afterwards (not the whole panel). Right-click any cell also offers Copy cell and Copy row as watch expression — the latter copies the row's stable element expression (e.g. (g_mutexes)[5], or the master‑qualified path for grouped sections) so you can paste it into VS Code's Watch panel (VS Code has no API to add a watch entry directly). A plain‑member (or editable) cell also offers Add watchpoint (break on change), which sets a GDB data watchpoint on that field's resolved address (one hardware register, even for linked/grouped cells) so the program stops when it changes — it doesn't write memory. A watched cell is then marked with a gold ★ (and a left accent), its hover tooltip notes the watchpoint, and its menu switches to ★ Remove watchpoint (runs GDB delete). Stars persist across refreshes and clear when the session ends.
- Leveled, color-coded logging. A Debug Inspector Output channel (rendered with the
log syntax so timestamps/severities/values are colorized); pick off / info / debug.
Requirements
- The C/C++ extension (
ms-vscode.cpptools) and a working GDB debug configuration (type: cppdbg).
- GDB available on your system.
Quick start
- Debug your C/C++ program with
cppdbg (GDB).
- Put a
debug-inspector.json at your workspace root (see the schema below).
- Run “Debug Inspector: Open Panel” from the Command Palette (it opens beside your editor).
- When you hit a breakpoint the panel fills in; on
continue it shows running…, then refreshes again on the next stop. Each config section gets its own tab.
Run “Debug Inspector: Show Log” any time to open the Output channel for diagnostics.
Configuration
The config file (default debug-inspector.json) is a JSON object that is a map of named sections. Each key whose value is an object with a string mode and an array fields is treated as a section; the JSON key is the tab label (threads, semaphores, pool, … — any name). Add one section per data structure, as many as you like; section order in the file drives tab order. Keys beginning with // are skipped, so you can use them for inline comments.
Schema — every field
| Field |
Modes |
Meaning |
mode |
all (required) |
"linked_list", "array", "index_list", "tree", or "walk". |
root |
most (required) |
Starting expression in your program's own syntax (head pointer, array, or tree root). May contain ${master} (grouping). For walk, use start instead. |
children |
tree |
Child-pointer field names walked from each node (BFS); defaults to ["left","right"]. The graph view draws the result as a hierarchical tree. |
start |
walk |
Initial cursor (an address/value expression). In next/while/fields, ${expr} is the current raw cursor; ${wrapped_expr} is that cursor after cast+wrap (e.g. ((frame_t *)(cursor))). |
while |
walk |
Boolean ${expr} template; the walk continues while it's true and stops when false (e.g. cursor within stack bounds). |
next |
linked_list, index_list, walk |
Field giving the next element — a pointer (cursor->next) for linked_list, an index for index_list. For index_list/walk it may instead be a ${expr} template (like wrap) that computes the next index/cursor, e.g. "${expr}.link.idx" or "*(unsigned long *)(${expr})". Used verbatim, so set it (it only falls back to next when building a master's clickable/grouped selector). |
head |
index_list |
Starting index expression. May contain ${master} (grouping). |
nil |
index_list |
Sentinel index that ends the walk (default -1). May contain ${master} (grouping). |
count |
array |
Expression yielding the element count (parsed as an integer). May contain ${master} (grouping). |
access |
array, index_list, walk |
Element-to-field accessor: "." (default) or "->" for a pointer element. (linked_list is always ->.) In walk it applies to the default field path over ${wrapped_expr}. |
cast |
array, index_list, walk |
Cast — written in full (e.g. widget_t *); no * is auto-added. For array/index_list it reinterprets a generic/void* root buffer. In walk it types the cursor: ${wrapped_expr} becomes ((cast)(cursor)), so you write ${wrapped_expr}->member instead of raw pointer math. |
wrap |
all |
Template that transforms the element before field access; ${expr} is the element. In walk it wraps the (cast-typed) cursor to form ${wrapped_expr}; ${expr} there stays the raw cursor value (so next/while arithmetic is unaffected). |
label |
master sections |
Expression evaluated on the master element to title each tree node when another section groups by this one. |
groupBy |
grouping sections |
Names a master section; renders this section as a collapsible tree, one group per master element (use ${master} in root/head/count/nil). |
selectedFrom |
detail sections |
Names a master section; makes this an on-demand detail — not a tab. Right-click a master row/node → Show … (detail) to build it for that one element. ${selected} (in this section's traversal expressions — root/start/next/while/head/nil/count/wrap — and in any field expr/wrap/when/bar; not cast) is the selected element's stable expression. |
hidden |
all |
true starts this section's tab hidden (until shown from the ▤ Sections menu). Ignored once you change section visibility in the UI. |
max |
all |
Traversal upper bound / safety guard (default 1024). |
fields |
all (required) |
Ordered list of { "label", "expr" } columns (first column = row identity). expr is appended after the element, OR a computed expression via ${expr} / ${wrapped_expr} (the element, like wrap/next) — e.g. "${expr}->stack_size - ${expr}->stack_used" for arithmetic across two members. A field may add "hidden": true (start collapsed/unfetched), "base": "dec"\|"hex"\|"bin" (default number base), "bar": { "max": "<expr>", "warn": 75, "crit": 90 } (usage bar), and/or "link": { "section": "<target>", "match": "<column>" } (clickable cross-reference), and/or "when": "<bool expr>" (conditional field — blank when false; several on one discriminator = variant/tagged‑union), "editable": true (right‑click → Edit value writes via GDB set var), "wrap": "<tmpl>" (transform the field value after access — ${expr} = the accessed value), "badge": { "<value>": "<color>" } (value→color badge, overriding the built-in State coloring), "valueMap": { "<value>": "<text>"\|{text,color} } (render a value as custom text + color — the text-changing superset of badge), "flags": { "<mask>": "<name>"\|{text,color} } (decode a bit-flag integer to named flags by mask), and/or "symbol": true (treat the value as a code address and show its function symbol via GDB print/a — e.g. a callstack PC → function name; unresolved addresses stay as the raw address), and/or "sourceLine": true (resolve a code address to its source file:line via GDB info line — click the cell to open it in the editor; blank if built without -g). |
Notes on the subtle fields
cast is written in full. There is no auto-appended * — you supply the complete type, so it composes for any target. The base becomes ((cast)(root)) and elements are indexed off it: "cast": "widget_t *" over root: "g_widgets.data" produces ((widget_t *)(g_widgets.data))[i].field.
wrap parenthesizes twice and supports a field hop. The element is parenthesized into the wrap, and then the wrap output is itself parenthesized before the field access is appended. So wrap: "((widget_t *)${expr})" with element g_slots[i] and access: "->" yields (((widget_t *)(g_slots[i])))->field. The extra outer parens fix precedence, so a deref wrap "*(${expr})" correctly becomes (*(elem)).field rather than the mis-parsed *(elem).field. wrap composes with cast: cast is applied to root to form the element, then wrap wraps that element. You can also hop through a field before casting by reaching it inside the wrap — e.g. wrap: "((widget_t *)(${expr}.data))" reaches .data first, giving ((widget_t *)(g_boxes[i].data))->field.
${master} substitutes the processed element. In a section that sets
groupBy, ${master} resolves — for each master element — to a type-safe
re-selection of that master row, with the master's own cast and wrap
already applied, substituted (in parentheses) into this section's root, count,
head, and nil. No address-taking and no extra cast is required.
label runs on the processed master element. It titles each tree node in a grouped child. A char* rendered as 0x.. "init" is reduced to just init; otherwise the value is used as-is. If the master has no label, the group falls back to the master row's first-column key.
Mode 1 — linked_list
Start at a head pointer and follow next until NULL (or max).
{
  "processes": {
    "mode": "linked_list",
    "root": "g_process_list",
    "next": "next",
    "label": "name",
    "fields": [
      { "label": "PID",  "expr": "pid" },
      { "label": "Name", "expr": "name" }
    ]
  }
}
Mode 2 — array
Iterate count elements (capped at max).
{
  "timers": {
    "mode": "array",
    "root": "g_timers",
    "count": "g_timer_count",
    "access": ".",
    "fields": [
      { "label": "ID",      "expr": "id" },
      { "label": "Name",    "expr": "name" },
      { "label": "Period",  "expr": "period" },
      { "label": "Elapsed", "expr": "elapsed" },
      { "label": "Active",  "expr": "active" }
    ]
  }
}
Mode 3 — index_list
A list living inside an array, linked by a next-index field. Start at head, read root[idx], follow next until the index equals nil; slots not on the chain are never visited. (Below, the chain is 0 → 2 → 5; slots 1/3/4 are skipped.)
{
  "pool": {
    "mode": "index_list",
    "root": "g_slot_pool",
    "head": "g_slot_head",
    "next": "next",
    "nil": "-1",
    "access": ".",
    "fields": [
      { "label": "ID",   "expr": "id" },
      { "label": "Name", "expr": "name" },
      { "label": "Next", "expr": "next" }
    ]
  }
}
When the next index isn't a plain field, next accepts a ${expr} template
(like wrap) — e.g. "next": "${expr}.link.idx" or a lookup
"next": "g_succ[${expr}.id]". ${expr} is the un-wrapped element — the same
one wrap receives, so it means the same thing in both. To reuse a cast/wrap
instead of rewriting it, use ${wrapped_expr} (the post-cast/wrap
element): with wrap: "((node_t *)${expr})", write "next": "${wrapped_expr}->nxt".
(The demo's procSlots uses "next": "${expr}.next".)
Mode 4 — tree
Walk a tree from root, following each node's child pointers. children lists the child-pointer field names (default ["left","right"]); NULL children end a branch. The graph view draws the result as a hierarchical tree — root on top, children below, edges leaving each parent's bottom-centre and entering each child's top-centre — while the table view lists the nodes. (Below: a binary search tree reached through left/right.)
{
  "btree": {
    "mode": "tree",
    "root": "g_tree_root",
    "children": ["left", "right"],
    "fields": [
      { "label": "Key",   "expr": "key" },
      { "label": "Label", "expr": "label" }
    ]
  }
}
children is not limited to two — list as many child-pointer fields as your node has (e.g. ["first_child","next_sibling"] for an n-ary tree, or ["lo","mid","hi"]). Each named field is followed from every node; a cycle/again-visited guard keeps the walk finite, and unreadable or NULL children simply stop that branch.
Mode 5 — walk (condition-bounded cursor unwind)
A computed walk for sequences that aren't a plain array or next-pointer list — the classic case is a call stack unwound by following frame pointers. A cursor starts at start, and at each step the row's fields are read with ${expr} = the current raw cursor value (and ${wrapped_expr} = that cursor after an optional cast/wrap), then next (a template over ${expr}/${wrapped_expr}) computes the next cursor; the walk continues while while (a boolean template) is true and stops when it goes false (plus a max cap and a no-progress/cycle guard). Unlike the other modes it terminates on a predicate, not a sentinel or a count.
{
  "callstack": {
    "mode": "walk",
    "start": "thread->fp",                                              // initial cursor (a saved frame pointer / address)
    "next":  "*(unsigned long *)(${expr})",                             // next cursor = the saved previous FP at [FP]
    "while": "(${expr}) >= thread->stack_base && (${expr}) < thread->stack_top",  // keep going while the FP stays in the stack
    "max":   64,
    "fields": [
      { "label": "PC", "expr": "*(unsigned long *)((${expr}) + 8)", "base": "hex" },  // return address at [FP+8] (x86-64)
      { "label": "FP", "expr": "${expr}", "base": "hex" }
    ]
  }
}
${expr} is the raw cursor value (an address), so you can do the pointer arithmetic yourself — this works for a frame-pointer chain (above), an SP scan, or any "advance until out of bounds" traversal. It's read-only (no edit/watch on computed frames).
To skip the manual casting, add a cast (and/or wrap) and use ${wrapped_expr} — the cursor typed once. cast types the cursor (${wrapped_expr} = ((cast)(cursor))), so next and the fields read members directly while ${expr} stays the raw value for the bounds check:
{
  "callstack": {
    "mode": "walk",
    "cast":  "frame_t *",                                                 // type the cursor once
    "start": "thread->fp",
    "next":  "${wrapped_expr}->prev",                                      // next FP via the typed frame, not raw [FP] math
    "while": "(${expr}) >= thread->stack_base && (${expr}) < thread->stack_top",  // ${expr} = raw cursor (bounds)
    "max":   64,
    "fields": [
      { "label": "PC",     "expr": "${wrapped_expr}->pc", "base": "hex" },   // return address as a typed member
      { "label": "Func",   "expr": "${wrapped_expr}->pc", "symbol": true },  // … resolved to its function symbol
      { "label": "Source", "expr": "${wrapped_expr}->pc", "sourceLine": true },  // … and its source file:line (click → open)
      { "label": "FP",     "expr": "${expr}", "base": "hex" }
    ]
  }
}
On-demand detail (selectedFrom + ${selected})
Some data is only worth seeing for one element at a time — a thread's call stack, a connection's packet ring, a node's sub-list. Mark such a section with selectedFrom: "<master>" and it becomes an on-demand detail rather than a tab: nothing is fetched until you right-click a row (table) or node (graph) of the master section and choose Show … (detail). ${selected} then resolves to that row's stable element expression, and the detail is (re)fetched on every stop while it's open (close it from the ✕ in its header). In the table it expands as an accordion right below the selected row; in the graph the detail panel opens and widens to hold it.
This pairs naturally with walk — the call-stack example above, scoped to the thread you click:
{
  "callstack": {
    "mode": "walk",
    "selectedFrom": "threads",                                          // not a tab; right-click a thread → Show Callstack
    "start": "${selected}->cs_fp",                                      // the selected thread's saved frame pointer
    "next":  "*(unsigned long *)(${expr})",
    "while": "(${expr}) >= g_stack_base && (${expr}) < g_stack_top",
    "max":   64,
    "fields": [
      { "label": "PC",     "expr": "*(unsigned long *)((${expr}) + 8)", "base": "hex" },
      { "label": "Func",   "expr": "*(unsigned long *)((${expr}) + 8)", "symbol": true },  // PC → function name (print/a)
      { "label": "Source", "expr": "*(unsigned long *)((${expr}) + 8)", "sourceLine": true },  // PC → file:line (info line; click → open)
      { "label": "FP",     "expr": "${expr}", "base": "hex" }
    ]
  }
}
selectedFrom is independent of the master's mode (array, linked list, grouped tree…) — the right-clicked element's stable expression is what ${selected} substitutes. A master may have more than one detail (each gets its own menu item).
Grouping / tree (groupBy + ${master})
Set groupBy to a master section's name to render this section in its own tab as a collapsible tree showing all master elements at once. ${master} is replaced with each master's processed element. Node titles come from the master's label (here, processes sets "label": "name"). A Flat view toggle switches between the tree and one ungrouped table.
{
  "semaphores": {
    "groupBy": "processes",
    "mode": "linked_list",
    "root": "${master}->sem_list",
    "next": "next",
    "fields": [
      { "label": "ID",         "expr": "id" },
      { "label": "Count",      "expr": "count" },
      { "label": "Max",        "expr": "max_count" },
      { "label": "Waiting",    "expr": "waiting" },
      { "label": "Discipline", "expr": "discipline" }
    ]
  }
}
Grouping also composes with index_list for a per-parent chain — e.g. "head": "${master}->slot_head".
void* cast (cast)
Reinterpret a generic buffer as a typed array. Here g_widgets.data is a void* holding a widget_t[]; the generated access is ((widget_t *)(g_widgets.data))[i].field.
{
  "widgets": {
    "mode": "array",
    "root": "g_widgets.data",
    "count": "g_widgets.size",
    "cast": "widget_t *",
    "access": ".",
    "fields": [
      { "label": "X",     "expr": "x" },
      { "label": "Y",     "expr": "y" },
      { "label": "Label", "expr": "label" }
    ]
  }
}
wrap — deref / cast the element
g_slots is void *g_slots[3], each element a widget_t*. Cast the element inside wrap, then use access: "->". Generated: (((widget_t *)(g_slots[i])))->field.
{
  "slots": {
    "mode": "array",
    "root": "g_slots",
    "count": "3",
    "wrap": "((widget_t *)${expr})",
    "access": "->",
    "fields": [
      { "label": "X",     "expr": "x" },
      { "label": "Y",     "expr": "y" },
      { "label": "Label", "expr": "label" }
    ]
  }
}
wrap — pre-cast field hop
Each slot of box_t g_boxes[3] is { void *data; int kind } and data holds a widget_t*. Reach .data inside the wrap before casting. Generated: ((widget_t *)(g_boxes[i].data))->field.
{
  "boxes": {
    "mode": "array",
    "root": "g_boxes",
    "count": "3",
    "wrap": "((widget_t *)(${expr}.data))",
    "access": "->",
    "fields": [
      { "label": "X",     "expr": "x" },
      { "label": "Label", "expr": "label" }
    ]
  }
}
Per-column field options (with examples)
Any fields entry can carry extra options beyond label/expr. One example each:
Computed value — reference the element with ${expr} (raw) / ${wrapped_expr} (after cast/wrap) for arithmetic, casts, or ternaries:
{ "label": "Free", "expr": "${expr}->stack_size - ${expr}->stack_used" }
Element index — ${index} is the element's container index: the array subscript in array mode and the slot index in index_list mode. It is not available in linked_list or tree — those have no array index (use ${depth} for tree). Like ${expr}, it makes the expression standalone (not appended to the element), so use it alone to show the index, or inside another expression to index a parallel array:
{ "label": "Idx",  "expr": "${index}" }
{ "label": "Name", "expr": "g_names[${index}]" }
Tree depth — in tree mode, ${depth} is the node's depth: 0 for the root, 1 for its children, 2 for grandchildren, and so on (the tree's only positional keyword; ${index} does not apply to trees). Standalone like ${index}:
{ "label": "Depth", "expr": "${depth}" }
Master element (${master}) — in a grouped section (one with groupBy), ${master} is the master element this row belongs to. Beyond root/head/count/nil, it now also works inside a field's expr (and wrap/when), so a child row can show or compute from its parent. You write the access (-> for a pointer master, . for a value master); like ${expr} it's standalone:
{ "label": "Proc", "expr": "${master}->name" }
Using ${master} in a section without groupBy does nothing (there's no master) — the extension leaves it unresolved (the cell errors) and shows a warning prompting you to add groupBy or remove ${master}.
Selected element (${selected}) — in a section with selectedFrom, ${selected} is the stable expression of the master row/node you right-clicked to open the detail. It substitutes in root/start/next/while/head/nil/count/wrap and field expr/wrap/when/bar (everywhere except cast), so the detail traverses from that element (e.g. "start": "${selected}->cs_fp"). See On-demand detail.
Symbol resolution (symbol) — set "symbol": true on a field whose value is a code address, and the extension reads it with GDB print/a and shows the resolved function+offset instead of the raw number (an unresolved address stays as the address). The canonical use is turning a call-stack PC into a function name; it works for any address field. Read-only (no base/edit/watchpoint on a symbolized field):
{ "label": "Func", "expr": "*(unsigned long *)((${expr}) + 8)", "symbol": true }
Source location (sourceLine) — set "sourceLine": true on a field whose value is a code address, and the extension resolves it with GDB info line *(…) and shows the file:line the address maps to (an address with no line information — e.g. code built without -g — leaves the cell blank). The canonical use is turning a call-stack PC into a source location right next to its symbol function name. Click the cell to open that file at that line in the editor — navigation uses the full path GDB reports (cygwin paths mapped to Windows, relative paths resolved against the workspace), so it opens the right file even when several share a basename. Requires debug info (.debug_line); read-only (no base/edit/watchpoint):
{ "label": "Source", "expr": "${wrapped_expr}->pc", "sourceLine": true }
Number base (base) — default display base dec / hex / bin (also toggle live from the 10 / 16 / 2 button in the column header):
{ "label": "Handle", "expr": "id", "base": "hex" }
Usage bar (bar) — render the value as a used / max · % bar, green → amber (≥ warn) → red (≥ crit); max is a sibling expression or a constant:
{ "label": "Stack", "expr": "stack_used", "bar": { "max": "stack_size", "warn": 75, "crit": 90 } }
Cross-reference link (link) — render the value as a link; clicking jumps to the row in section whose match column equals it (only when a match exists):
{ "label": "Owner", "expr": "owner", "link": { "section": "threads", "match": "ID" } }
Conditional fields (when) — show a column only when its boolean expression holds; put several on one discriminator for tagged-union / variant rows:
{ "label": "Owner",   "expr": "owner",   "when": "locked",            "link": { "section": "threads", "match": "ID" } },
{ "label": "Waiting", "expr": "waiters", "when": "${expr}.locked == 0" }
Editable (editable) — right-click the cell → Edit value… writes it back with GDB set var (assignable fields only):
{ "label": "Locked", "expr": "locked", "editable": true }
Hidden by default (hidden) — start the column collapsed and unfetched; enable it from the ▦ Columns menu:
{ "label": "Next", "expr": "next", "hidden": true }
Field wrap — transform the value after access (${expr} = the accessed value), e.g. reinterpret a void* member differently per column:
{ "label": "X", "expr": "data", "wrap": "((widget_t *)${expr})->x" }
Badge colors (badge) — map values to colored badges (case‑insensitive exact match), overriding the built‑in State coloring. Color names green / blue / red / amber / orange / purple / cyan / gray, or a #rrggbb hex. Works for numeric states too:
{ "label": "State", "expr": "state", "badge": { "RUNNING": "green", "READY": "cyan", "BLOCKED": "red", "WAITING": "amber" } }
Value mapping (valueMap) — render a value as a custom text and color (the text-changing superset of badge, which only colors). Give a plain string to change just the displayed text, or { "text": ..., "color": ... } to change both. color is a name (as above) or a #rrggbb hex. Matching is case‑insensitive exact (and also matches an enum's quoted name). Applies in both the table cell and the graph card (where the color also tints the card's accent stripe):
{ "label": "Locked", "expr": "locked", "valueMap": { "0": { "text": "free", "color": "#2ecc71" }, "1": { "text": "HELD", "color": "#e74c3c" } } }
{ "label": "Active", "expr": "active", "valueMap": { "0": "idle", "1": "armed" } }
Bit flags (flags) — decode an integer whose bits are independent flags and show the set ones by name. The key is the bit mask (hex 0x04 or decimal 4); the value is a name string or { "text", "color" }. A flag shows when (value & mask) == mask, so single bits and multi-bit masks work. Bits not covered by any mask are appended as +0x.. so nothing is hidden; value 0 (no bits) just shows 0. Renders as colored pills in the table and joined names on the graph card:
{ "label": "Flags", "expr": "flags", "flags": {
    "0x1": { "text": "BUSY", "color": "amber" },
    "0x2": { "text": "OWNED", "color": "blue" },
    "0x4": { "text": "ROBUST", "color": "green" },
    "0x8": "RECURSIVE"
} }
(e.g. flags == 0x1B → BUSY · OWNED · RECURSIVE · +0x10 — the 0x10 bit isn't mapped, so it's shown as a residual.) On the graph card each flag is drawn in its own colour (uncoloured flags use the default text colour); a value too long for the card is truncated with ….
Notes on expr and rendering
You never declare types or sizes. Whatever expr evaluates to is formatted by GDB according to its type: enums render as names (RUNNING, FIFO), pointers as addresses, integers as numbers. A fixed-size char array is shown only up to the first \0 — the trailing NULs GDB prints ("abc\000\000" or "abc", '\000' <repeats N times>) are dropped, so you just see "abc". A value GDB cannot read — No symbol …, cannot access memory, optimized out, or an evaluation error — is shown as a distinct red ⚠ with the GDB error in its tooltip (and logged to the Output channel). A NULL pointer (0x0) is shown as a muted - (visually separate from an error), and a plain integer 0 is shown as 0.
Settings
| Setting |
Default |
Description |
debugInspector.configPath |
debug-inspector.json |
Path to the config file. Absolute paths are used as-is (work even with no workspace folder); a relative path is resolved against the workspace root. |
debugInspector.logLevel |
info |
Verbosity of the Debug Inspector Output channel: off / info / debug. |
debugInspector.debugTypes |
["cppdbg"] |
Debug adapter types the tracker attaches to. Use cppdbg for GDB. |
debugInspector.maxHardwareWatchpoints |
2 |
How many watchpoints may use hardware debug registers before new ones fall back to (slower) software watchpoints. Each watchpoint uses one register because the extension watches the lvalue's resolved address (print $w = &expr; watch *$w) rather than the expression itself — so even linked/grouped (->) cells stay hardware. x86 has 4 registers; raise this for targets with more, or 0 to always use software. |
Logging & troubleshooting
Open the channel with “Debug Inspector: Show Log”. It uses VS Code's log language id, so the theme color-codes timestamps, severities, and values. Pick the level with debugInspector.logLevel (applied live):
off — no logging.info (default) — general milestones plus warnings/errors: activate, refresh, selection, and GDB access failures.debug — everything info shows, plus every prepared GDB access string (gdb ▸) and its result (gdb ◂), and step-by-step traversal. For an index_list you can see how next resolves at each hop (e.g. step N: idx X → next [...] = "v" → idx N); for a linked_list, each node N as the cursor advances. This is the fastest way to confirm exactly what expression was sent to GDB when a column shows -.
License
MIT