FlintJVM Debug extension for Visual Studio Code

A Visual Studio Code extension support for the debugging java language with FlintJVM.
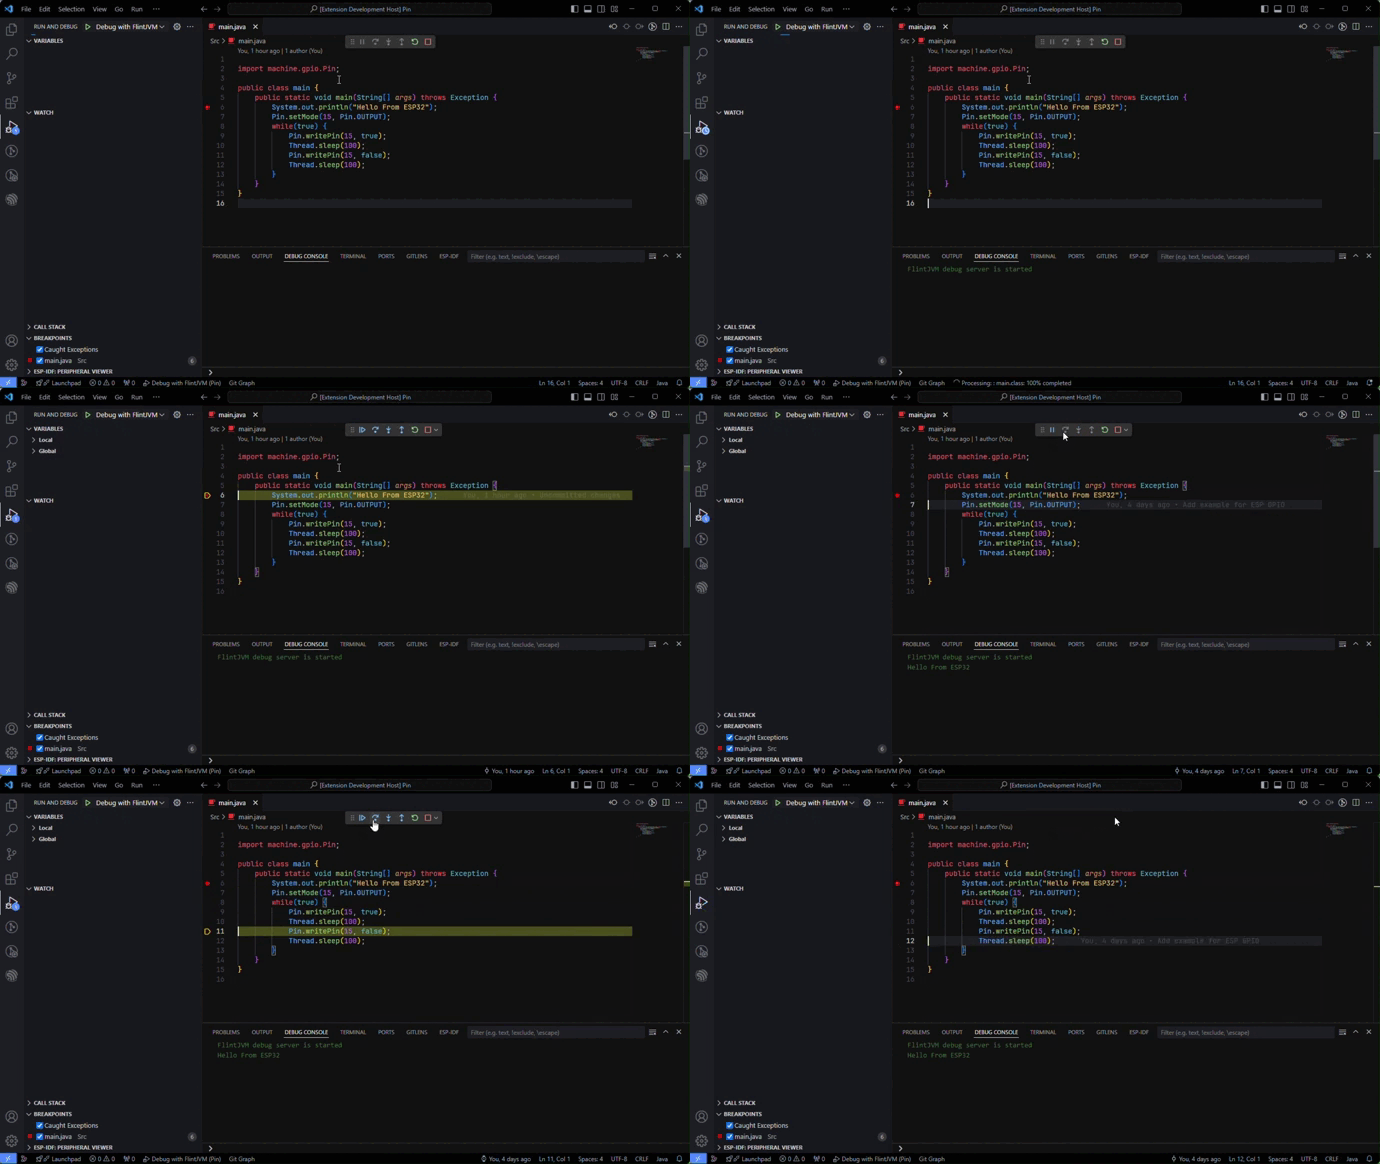
It Provides basic features such as:
- Pause, Continue, Restart.
- Step Over, Step Into, Step Out.
- Stack trace.
- Set and remove breakpoints.
- Stop on exception and display exception information.
- View local variables and evaluate expressions.
- Display message printed from java code.
How to use
- Install FlintJVM Debug extension on VS Code.
- Click on the "Install" button.
- In the new window, open the your java project that will be run on FlintJVM.
- Open
Run > Add Configuration... > Flint Debug to add launch.json with default configuration.
- Change the default properties in launch.json to match your project.
- Press
F5 to start debugging your java project.
Contribute
- Clone and open this repo in VS Code.
- Run
npm install to install the dependencies.
- Press
F5 to open a new window with your extension loaded.
| |