Skip to content
| Marketplace
Sign in
Visual Studio Code>Programming Languages>PHP ProfilerNew to Visual Studio Code? Get it now.
PHP Profiler

PHP Profiler

DEVSENSE

devsense.com
|
4,829,137 installs
| (4) | Free Trial
Support for PHP (Xdebug) profiling files and inspecting them.
Installation
Launch VS Code Quick Open (Ctrl+P), paste the following command, and press enter.
Copied to clipboard
More Info

PHP Profiler for Visual Studio Code

PHP Tools product page PHP Tools on Twitter

Xdebug profile files (cachegrind format) can be opened, viewed, and inspected. The extension also highlights hot paths in your code, according to the profiling results. There is more, please see the features below for the details.


Overview

PHP code profiling allows you to inspect how much time and how many calls were made to every single function in the code.

Profiling PHP in VS Code Video

The extension enables inspecting of Xdebug profile files which contain information about PHP code performance. It works best in combination with PHP Tools for Visual Studio Code. Debug, profile, and inspect the profiling results right in Visual Studio Code.

Quickly Setup PHP for Profiling

  • Ensure, you have PHP installed.
  • Ensure Xdebug PHP extension is installed as well.
  • Make sure PHP zlib extension is enabled (recommended).
  • Check your php.ini setting:
    xdebug.output_dir="<an output directory>"
    
  • With PHP Tools for Visual Studio Code, use the following launch.json setting:
    {
        "name": "Launch Built-in server & Profile",
        "type": "php",
        "request": "launch",
        "runtimeArgs": [
            "-S", "localhost:8888", "-t", "."
        ],
        "noDebug": true, // <-- disable debugging
        "profile": true, // <-- enable profiling
    }
    

Opening Profiling Result

Open the file containing your profiling data. By default, it is in form of cachegrind.out.%p.gz.

Using Command Palette

  • Bring the Command Palette, and run Open Profile File (Xdebug Profiling Output).
  • Choose the file, and confirm. open profiling file command

Drag & Drop "cachegrind.out.*.gz" File

Alternatively, if your profile file name is in form of
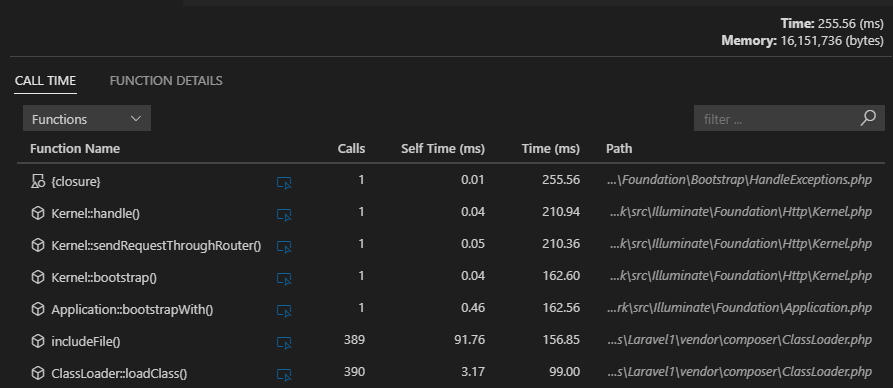
 cachegrind.out.%p.gz, you can open the file right in the Visual Studio Code editor - using File/Open File menu.

Be aware, large files may take some time to open.

Inspecting Call Times

The following view lists all the functions with the number of calls (Calls), time spent by the function body (Self Time), and time including nested calls (Time).
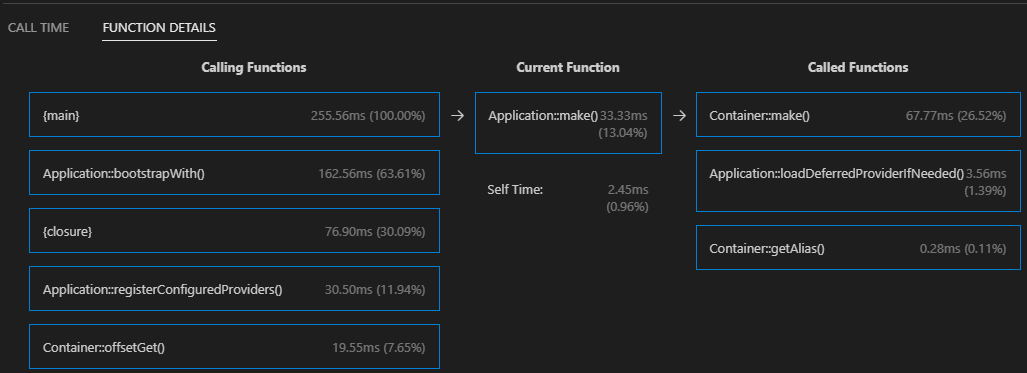
profiling call times

Inspecting Callers/Callees

The Function Details view is focused on a single function; and displays all the calling functions and all the called functions, including the time information.
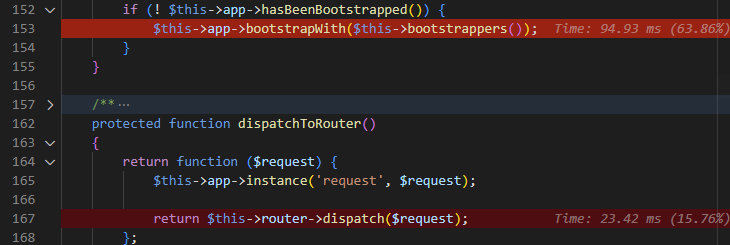
profiling callers

Highlighting Hot Paths

The loaded profiling result file is analyzed, and hot paths are highlighted directly in the source code. Highlighting can be turned off in the profiling result view.

profiling hot path highlight

See Also

  • PHP Tools for Visual Studio - All-in-One PHP language integration for VS Code.
  • Documentation

Notes

The extension may send us (DEVSENSE s.r.o.) error telemetries, if enabled in VS Code (see Telemetry settings). Data are anonymized, sampled, and destroyed after 30 days. This helps us to make the product stable and reliable. We do not provide the data to any 3rd party.

  • Contact us
  • Jobs
  • Privacy
  • Manage cookies
  • Terms of use
  • Trademarks
© 2025 Microsoft